Network structure, metadata and the prediction of missing nodes and annotations
The empirical validation of community detection methods is often based on available annotations on the nodes that serve as putative indicators of the large-scale network structure. Most often, the suitability of the annotations as topological descrip…
Authors: Darko Hric, Tiago P. Peixoto, Santo Fortunato
Net w ork structure, metadata and the prediction of missing no des and annotations Dark o Hric ∗ Dep artment of Computer Scienc e, A alto University Scho ol of Science, P.O. Box 12200, FI-00076 A alto, Finland Tiago P . P eixoto † Dep artment of Mathematic al Scienc es and Centr e for Networks and Col lective Behaviour, University of Bath, Claverton Down, Bath BA2 7A Y, Unite d Kingdom ISI F oundation, Via Alassio 11/c, 10126, T urin, Italy and Institut für The or etische Physik, Universität Br emen, Ho chschulring 18, D-28359 Bremen, Germany San to F ortunato ‡ Dep artment of Computer Scienc e, A alto University Scho ol of Scienc e, P.O. Box 12200, FI-00076, Finland and Center for Complex Networks and Systems R ese arch, Scho ol of Informatics and Computing, Indiana University, Blo omington, USA The empirical v alidation of comm unit y detection metho ds is often based on a v ailable annotations on the no des that serve as putative indicators of the large-scale netw ork structure. Most often, the suitabilit y of the annotations as top ological descriptors itself is not assessed, and without this it is not p ossible to ultimately distinguish b et w een actual shortcomings of the communit y detection algorithms on one hand, and the incompleteness, inaccuracy or structured nature of the data anno- tations themselv es on the other. In this w ork we presen t a principled metho d to access b oth asp ects sim ultaneously . W e construct a joint generative mo del for the data and metadata, and a nonpara- metric Bay esian framework to infer its parameters from annotated datasets. W e assess the qualit y of the metadata not according to its direct alignmen t with the net work comm unities, but rather in its capacity to predict the placemen t of edges in the netw ork. W e also show how this feature can b e used to predict the connections to missing no des when only the metadata is a v ailable, as w ell as missing metadata. By inv estigating a wide range of datasets, we sho w that while there are seldom exact agreements b et w een metadata tok ens and the inferred data groups, the metadata is often informative of the netw ork structure nev ertheless, and can improv e the prediction of missing no des. This shows that the metho d uncov ers meaningful patterns in b oth the data and metadata, without requiring or exp ecting a p erfect agreement b et ween the tw o. P ACS num b ers: 89.75.Hc I. INTR ODUCTION The netw ork structure of complex systems determine their function and serv e as evidence for the ev olution- ary mechanisms that lie b ehind them. Ho w ever, v ery of- ten their large-scale prop erties are not directly accessible from the netw ork data, and need to b e indirectly derived via nontrivial metho ds. The most prominen t example of this is the task of identifying mo dules or “comm unities” in netw orks, that has driven a substantial volume of re- searc h in recent y ears [1–3]. Despite these efforts, it is still an op en problem b oth how to characterize such large- scale structures and how to effectively detect them in real systems. In order to assist in bridging this gap, many researc hers hav e compared the features extracted from suc h metho ds with known information — metadata, or “ground truth” — that putativ ely corresp ond to the main indicators of large-scale structure [4 – 6]. Ho wev er, this as- sumption is often accepted at face v alue, even when suc h ∗ darko.hric@aalto.fi † t.peixoto@bath.ac.uk ‡ santo.fortunato@aalto.fi metadata may contain a considerable amount of noise, is incomplete or is simply irrelev an t to the netw ork struc- ture. Because of this, it is not y et understoo d if the discrepancy observed b et w een the metadata and the re- sults obtained with comm unity detection metho ds [4, 7] is mainly due to the ineffectiveness of such methods, or to the lac k of correlation betw een the metadata and actual structure. In this work, we present a principled approac h to ad- dress this issue. The cen tral stance we take is to mak e no fundamen tal distinction b etw een data and metadata, and construct generative pro cesses that account for b oth sim ultaneously . By inferring this join t model from the data and metadata, we are able to precisely quantify the exten t to which the data annotations are related to the net work structure, and vice versa 1 . This is different from approac hes that explicitly assume that the metadata (or a portion thereof ) are either exactly or appro ximately correlated with the b est netw ork division [12 – 19]. With 1 Here we consider exclusively annotation on the no des. Netw orks may also p ossess annotations on the edges, whic h may b e treated as edge co v ariates or la yers, as already considered extensively in the literature (e.g. [8–11]). 2 our metho d, if the metadata happ ens to be informative on the netw ork structure, w e are able to determine ho w; but if no correlation exists b et w een the t wo, this gets unco vered as well. Our approach is more in line with a recent metho d by Newman and Clauset [20] — who prop osed using av ailable metadata to guide prior prob- abilities on the net work partition — but here we intro- duce a framework that is more general in three impor- tan t wa ys: Firstly , we do not assume that the metadata is present in such a wa y that it corresp onds simply to a partition of the no des. While the latter can be directly compared to the outcome of conv en tional communit y de- tection metho ds, or used as priors in the inference of typ- ical generative mo dels, the ma jority of datasets contain m uch richer metadata, where nodes are annotated m ul- tiple times, with heterogeneous annotation frequencies, suc h that often few no des p ossess the exact same anno- tations. Secondly , we develop a nonparametric Bay esian inference metho d that requires no prior information or ad ho c parameters to b e sp ecified, suc h as the n umber of comm unities. And thirdly , w e are able not only to ob- tain the correlations b etw een structure and annotations based on statistical evidence, but also we are capable of assessing the metadata in its p ower to pr e dict the network structur e , instead of simply their correlation with laten t partitions. This is done b y leveraging the information a v ailable in the metadata to predict missing no des in the net work. This contrasts with the more common approach of predicting missing edges [21 – 27], whic h cannot be used when entire no des ha ve not b een observed and need to b e predicted, and with other approaches to detect missing no des, whic h are either heuristic in nature [28], or rely on v ery sp ecific assumptions on the data generating pro- cess [29, 30]. F urthermore, our metho d is also capable of clustering the metadata themselves, separating them in equiv alence classes according to their occurrence in the net work. This clustering of the metadata is done simul- taneously with the clustering of the netw ork data itself, with b oth asp ects aiding each other, and thus providing a full generalization of the task of communit y detection for annotated netw orks. As we sho w, both features allows us to distinguish informativ e metadata from less infor- mativ e ones, with resp ect to the netw ork structure, as w ell as to predict missing annotations. In the following we describ e our metho d and illustrate its use with some examples based on real data. W e then follo w with a systematic analysis of many empir- ical datasets, fo cusing on the prediction of nodes from metadata alone. W e show that the predictiveness of net- w ork structure from metadata is widely distributed — b oth across and within datasets — indicating that typi- cal netw ork annotations v ary greatly in their connection to net w ork structure. Data, A Metadata, T Figure 1. Schematic represen tation of the joint data-metadata mo del. The data la yer is composed of data nodes and is de- scrib ed b y an adjacency matrix A , and the metadata lay er is comp osed of the same data no des, as well as tag no des, and is describ ed by a bipartite adjacency matrix T . Both lay ers are generated b y tw o coupled degree-corrected SBMs, where the partition of the data no des in to groups is the same in b oth la yers. I I. JOINT MODEL FOR D A T A AND MET ADA T A Our approac h is based on a unified represen tation of the netw ork data and metadata. W e assume here the general case where the metadata is discrete, and may b e arbitrarily associated with the no des of the netw ork. W e do so b y describing the data and metadata as a single graph with t wo no de and edge types (or layers [31, 32]), as sho wn in Fig. 1. The first la yer corresp onds to the net work itself (the “data”), where an edge connects t wo “data” no des, with an adjacency matrix A , where A ij = 1 if an edge exists betw een t w o data no des i and j , or A ij = 0 otherwise. This lay er would corresp ond to the en tire data if the metadata were to b e ignored. In the second la yer b oth the data and the metadata no des are presen t, and the connection betw een them is represented b y a bipartite adjacency matrix T , where T ij = 1 if no de i is annotated with a metadata token j (henceforth called a tag no de), or T ij = 0 otherwise. Therefore, a single data node can b e asso ciated with zero, one or multiple tags, and likewise a single tag node ma y be associated with zero, one or multiple data no des. Within this gen- eral representation we can account for a wide sp ectrum of discrete node annotations. In particular, as it will b e- come clearer below, w e make no assumption that individ- ual metadata tags actually corresp ond to sp ecific disjoint groups of no des. W e construct a generative model for the matrices A and T by generalizing the hierarchical sto c hastic blo c k mo del (SBM) [33] with degree-correction [34] for the cas e 3 with edge lay ers [8]. In this mo del, the no des and tags are divided into B d and B t groups, resp ectiv ely . The n umber of edges b et w een data groups r and s are given b y the parameters e rs (or t wice that for r = s ), and b et w een data group r and tag group u by m ru . Both data and tag no des p ossess fixed degree sequences, { k i } and { d i } , for the data and metadata la y ers, respectively , corresp onding to an additional set of parameters. Given these constrain ts, a graph is generated b y placing the edges randomly in b oth la yers indep enden tly , with a joint lik eliho od P ( A , T | b , θ, c , γ ) = P ( A | b , θ ) P ( T | b , c , γ ) , (1) where b = { b i } and c = { c i } are the group memberships of the data and tag no des, resp ectiv ely , and b oth θ = ( { e rs } , { k i } ) and γ = ( { m ru } , { d i } ) are shorthands for the remaining mo del parameters in b oth la yers. Inside eac h la yer, the log-lik eliho od is 2 [34, 35] ln P ( A | b , θ ) ≈ − E − 1 2 X rs e rs ln e rs e r e s − X i ln k i ! , (2) and analogously for P ( T | b , c , γ ) . Since the data nodes ha ve the same group memberships in b oth lay ers, this pro vides a coupling b et w een them, and we ha ve thus a join t model for data and metadata. This mo del is gen- eral, since it is able to account sim ultaneously for the sit- uation where there is a perfect correspondence betw een data and metadata (for example, when B d = B t and the matrix m ru connects one data group to only one meta- data group), when the correspondence is non-existent (the matrix T is completely random, with B t = 1 ), as well as an y elab orate relationship b et w een data and metadata in b et ween. In principle, we could fit the ab o ve mo del by finding the model parameters that maximize the likelihoo d in Eq. 1. Doing so w ould unco v er the pre- cise relationship betw een data and metadata under the v ery general assumptions tak en here. How ev er, for this approac h to work, we need to know a priori the num- b er of groups B d and B t . This is b ecause the likelihoo d of Eq. 1 is parametric (i.e. it depends on the particu- lar choices of b , c , θ and γ ), and the degrees of free- dom in the model will increase with B d and B t . As the degrees of freedom increase, so will the lik eliho od, and the p erceiv ed qualit y of fit of the model. If we follo w this criterion blindly , w e will put eac h no de and meta- data tag in their individual groups, and our matrices e rs and m rs will corresp ond exactly to the adjacency ma- trices A and T , resp ectiv ely . This is an extreme case of overfitting , where we are not able to differentiate random fluctuations in data from actual structure that should b e 2 Eq. 2 is an approximation that is v alid for sparse graphs, where the o ccurrence of parallel edges can b e neglected. If this is not the case, the likelihoo d should b e appropriately mo dified. See Refs. [35, 36] for more details. describ ed by the mo del. The proper w ay to proceed in this situation is to make the mo del nonp ar ametric , b y including noninformative Bay esian priors on the model parameters P ( b ) , P ( c ) , P ( θ ) and P ( γ ) , as describ ed in Ref. [33, 36] (See also Appendix A). By maximizing the joint nonparametric likelihoo d P ( A , T , b , θ , c , γ ) = P ( A , T | b , θ , c , γ ) P ( b ) P ( θ ) P ( c ) P ( γ ) we can find the b est partition of the no des and tags into groups, together with the num ber of groups themselves, without ov erfitting. This happ ens b ecause, in this setting, the degrees of free- dom of the mo del are themselv es sampled from a distribu- tion, which will intrinsically ascrib e higher probabilities to simpler models, effectively w orking as a p enalt y on more complex ones. An equiv alent wa y of justifying this is to observ e that the joint likelihoo d can b e expressed as P ( A , T , b , θ , c , γ ) = 2 − Σ , where Σ is the description length of the data, corresp onding to the n umber of bits necessary to enco de b oth the data according to the mo del parameters as well as the mo del parameters themselv es. Hence, maximizing the joint Bay esian lik eliho od is iden- tical to the minimum description length (MDL) crite- rion [37, 38], whic h is a formalization of Occam’s razor, where the simplest hypothesis is selected according to the statistical evidence av ailable. W e note that there are some ca veats when selecting the priors probabilities abov e. In the absence of a priori kno wledge, the most straightforw ard approach is to select flat priors that enco de this, and ascribe the same proba- bilit y to all p ossible mo del parameters [39]. This choice, ho wev er, incurs some limitations. In particular, it can b e shown that with flat priors it is not p ossible to infer with the SBM a n umber of groups that exceeds an upp er threshold that scales with B max ∼ √ N , where N is the n umber of no des in the net work [40]. Additionally , flat priors are unlikely to be goo d mo dels for real data, since they assume all parameters v alues are equally likely . This is an extreme form of randomness that enco des maximal ignorance about the mo del parameters. How ev er no data is truly sampled from such a maximally random distribu- tion; they are more likely to b e sampled from some non- random distribution, but with an unknown shap e. An alternativ e, therefore, is to postp one the decision on the prior un til w e observe the data, b y sampling the prior distribution itself from a hyperprior. Of course, in doing so, we face the same problem again when selecting the h yp erprior. F or the mo del at hand, w e pro ceed in the fol- lo wing manner: Since the matrices { e rs } and { m rs } are themselv es adjacency matrices of multigraphs (with B d and B d + B t no des, respectively), we sample them from another set of SBMs, and so on, following a nested hierar- c hy , until the trivial model with B d = B t = 1 is reached, as describ ed in Ref. [33]. F or the remaining mo del param- eters w e select only tw o-lev el Bay esian hierarc hies, since it can be shown that higher-level ones hav e only negligible impro vemen ts asymptotically [36]. W e review and sum- marize the prior probabilities in Appendix. A. With this Ba yesian hierarchical mo del, not only we significan tly in- crease the resolution limit to B max ∼ N / ln N [33], but 4 also we are able to provide a description of the data at m ultiple scales. It is imp ortan t to emphasize that we are not restricting ourselv es to purely assortative structures, as it is the case in most comm unit y detection literature, but rather we are op en to a m uch wider range of connectivit y patterns that can b e captured by the SBM. As mentioned in the in tro duction, our approach differs from the parametric mo del recen tly in tro duced b y Ne wman and Clauset [20], where it is assumed that a no de can connect to only one metadata tag, and eac h tag is parametrized indi- vidually . In our model, a data no de can possess zero, one or more annotations, and the tags are clustered in to groups. Therefore our approach is suitable for a wider range of data annotations, where en tire classes of meta- data tags can be iden tified. F urthermore, since their ap- proac h is parametric 3 , the appropriate num b er of groups m ust be known b eforehand, instead of being obtained from data, which is seldom p ossible in practice. A ddition- ally , when employing the fast MCMC algorithm dev el- op ed in Ref. [42], the inference pro cedure scales linearly as O ( N ) (or log-linearly O ( N ln 2 N ) when obtaining the full hierarch y [33]), where N is the n umber of no des in the net work, indep enden tly of the n umber of groups, in con- trast to the exp ectation-maximization with b elief prop- agation of Ref. [20], that scales as O ( B 2 N ) , where B is the num b er of groups b eing inferred. Hence, our metho d scales well not only for large netw orks, but also for arbi- trarily large num ber of comm unities. An implementation of our metho d is freely av ailable as part of the graph-to ol library [43] at http://graph- tool.skewed.de . This join t approach of mo delling the data and meta- data allo ws us to understand in detail the extent to whic h net work structure and annotations are correlated, in a manner that puts neither in adv antage with resp ect to the other. Imp ortan tly , we do not interpret the individ- ual tags as “ground truth” lab els on the comm unities, and instead infer their relationships with the data comm uni- ties from the en tire data. Because the metadata tags themselv es can b e clustered into groups, w e are able to assess b oth their individual and collective roles. F or in- stance, if t wo tag no des are assigned to the same group, this means that they are b oth similarly informative on the net w ork structure, ev en if their target no des are dif- feren t. By follo wing the inferred probabilities betw een tag and node groups, one obtains a detailed picture of their corresp ondence, that can deviate in principle (and often does in practice) from the commonly assumed one- to-one mapping [4, 7], but includes it as a sp ecial case. 3 More precisely , the approac h of Ref. [20] is based on semi- Bay esian inference, where priors for only part of the parameters are sp ecified (the node partition) but not others (the metadata- group and group-group affinities, as well as no de degrees). This approach is less susceptible to ov erfitting when compared to pure maximum likelihood, but cannot be used to select the mo del or- der (via the number of groups) as we do here, for the reasons explained in the text (see also Ref. [41]). Before going into the systematic analysis of empirical datasets, we illustrate the application of this approach with a simple example, corresp onding to the net work of American college football teams [44], where the edges indicate that a game o ccurred b et ween t w o teams in a giv en season. F or this data it is also av ailable to which “conferences” the teams b elong. Since it is exp ected that teams in the same conference play eac h other more fre- quen tly , this is assumed to b e an indicator for the net- w ork structure. If we fit the ab ov e mo del to this dataset, b oth the nodes (teams) and tags (conferences) are di- vided into B d = 10 and B t = 10 groups, resp ectiv ely (Fig. 2). Some of the conferences corresp ond exactly to the inferred groups of teams, as one would expect. How- ev er other conferences are clustered together, in partic- ular the indep enden ts, meaning that although they are collectiv ely informativ e on the net w ork structure, indi- vidually they do not serv e as indicators of the netw ork top ology in a manner that can be conclusiv ely distin- guished from random fluctuations. In Fig. 2 w e used the conference assignments presented in Ref. [45], which are different from the original assign- men ts in Ref. [44], due to a mistak e in the original publi- cation, where the information from the wrong season was used instead [46]. W e use this as an opp ortunity to show ho w errors and noise in the metadata can be assessed with our metho d, while at the same time we emphasize an imp ortant application, namely the prediction of miss- ing nodes. W e describe it in general terms, and then return to our illustration afterw ards. A. Prediction of missing no des T o predict missing no des, we must compute the like- liho od of all edges inciden t on it simultaneously , i.e. for an unobserv ed node i they correspond to the i th row of the augmented adjacency matrix, a i = { A 0 ij } , with A 0 kj = A kj for k 6 = i . If we kno w the group membership b i of the unobserv ed node, in addition to the observed no des, the lik eliho od of the missing incident edges is P ( a i | A , b i , b ) = P θ P ( A , a i | b i , b , θ ) P ( θ ) P θ P ( A | b , θ ) P ( θ ) (3) = P ( A , a i | b i , b , ˆ θ ) P ( ˆ θ ) P ( A | b , ˆ θ 0 ) P ( ˆ θ 0 ) , (4) where ˆ θ and ˆ θ 0 are the only c hoices of parameters compat- ible with the no de partition. How ev er, we do not kno w a priori to which group the missing no de b elongs. If we ha ve only the netw ork data av ailable (not the metadata) the only choice we hav e is to make the probabilit y con- ditioned on the observed partition, P ( a i | A , b ) = X b i P ( a i | A , b i , b ) P ( b i | b ) , (5) where P ( b i | b ) = P ( b , b i ) /P ( b ) . This means that w e can use only the distribution of group sizes to guide the place- 5 Figure 2. Joint data-metadata model inferred for the net work of American fo otball teams [44]. (a) Hierarc hical partition of the data nodes (teams), corresp onding to the “data” lay er. (b) Partition of the data (teams) and tag (conference) no des, corresp onding to the second lay er. (c) A v erage predictive likelihoo d of missing no des relative to using only the data (discarding the conferences), using the original conference assignment of Ref. [44] (GN) and the corrected assignment of Ref. [45] (TE). men t of the missing node, and nothing more. How ev er, in practical scenarios we ma y hav e access to the meta- data asso ciated with the missing no de. F or example, in a so cial net work we migh t know the so cial and geograph- ical indicators (age, sex, coun try , etc) of a p erson for whom we would lik e to predict unknown acquaintances. In our mo del, this translates to knowing the corresp ond- ing edges in the tag-no de graph T . In this case, we can compute the lik eliho od of the missing edges in the data graph as P ( a i | A , T , b , c ) = X b i P ( a i | A , b i , b ) P ( b i | T , b , c ) , (6) where the no de membership distribution is weigh ted b y the information av ailable in the full tag-no de graph, P ( b i | T , b , c ) = P ( b i , b | T , c ) P ( b | T , c ) (7) = P γ P ( T | b i , b , c , γ ) P ( b i , b ) P ( γ ) P b 0 i P γ P ( T | b 0 i , b , c , γ ) P ( b 0 i , b ) P ( γ ) (8) = P ( T | b i , b , c , ˆ γ ) P ( b i , b ) P ( ˆ γ ) P b 0 i P ( T | b 0 i , b , c , ˆ γ 0 ) P ( b 0 i , b ) P ( ˆ γ 0 ) , (9) where again ˆ γ and ˆ γ 0 are the only c hoices of parameters compatible with the partitions c and b . If the metadata correlates w ell with the netw ork structure, the ab o ve dis- tribution should place the missing no de with a larger lik eliho od in its correct group. In order to quantify the relativ e predictive improv emen t of the metadata infor- mation for no de i , w e compute the predictive lik eliho od ratio λ i ∈ [0 , 1] , λ i = P ( a i | A , T , b , c ) P ( a i | A , T , b , c ) + P ( a i | A , b ) , (10) whic h should tak e on v alues λ i > 1 / 2 if the metadata impro ves the prediction task, or λ i < 1 / 2 if it deterio- rates it. The latter can o ccur if the metadata misle ads the placement of the node (we discuss b elo w the circum- stances where this can occur). In order to illustrate this approac h we return to the American fo otball data, and compare the original and corrected conference assignmen ts in their capacity of pre- dicting missing nodes. W e do so b y removing a node from the netw ork, inferring the mo del on the mo dified data, and computing its lik elihoo d according to Eq. 5 and Eq. 7, whic h we use to compute the av erage pre- dictiv e likelihoo d ratio for all nodes in the net w ork, h λ i = P i λ i / N . As can be seen in Fig. 2c, including the metadata improv es the prediction significantly , and indeed w e observe that the corrected metadata notice- ably improv es the prediction when compared to the orig- inal inaccurate metadata. In short, kno wing to which conference a fo otball team b elongs, does indeed increase our c hances of predicting against whic h other teams it will pla y , and we ma y do so with a higher success rate using the current conference assignments, rather than us- ing those of a previous y ear. These are hardly surprising facts in this illustrativ e context, but the situation be- comes quick ly less intuitiv e for datasets with hundreds of thousands of no des and a comparable n umber of meta- data tags, for which only automated metho ds such as ours can b e relied up on. I II. EMPIRICAL DA T ASETS W e p erformed a surv ey of sev eral net w ork datasets with metadata (describ ed in detail in App endix B), where we remov ed a small random fraction of annotated 6 FB Penn PPI (krogan) FB T ennessee FB Berkele y FB Caltech FB Princeton PPI (isobase hs) PPI (yu) FB Stanford PGP PPI (gastric) FB Harv ard FB V assar Pol. Blogs PPI (pancreas) Flickr PPI (lung) PPI (predicted) Anobii SN IMDB Amazon Debian pkgs. DBLP Internet AS APS citations LFR bench. 0 . 3 0 . 4 0 . 5 0 . 6 0 . 7 0 . 8 0 . 9 1 . 0 A vg. likelihood ratio, h λ i Figure 3. No de prediction p erformance, measured by the av erage predictive lik eliho od ratio h λ i for a v ariet y of annotated datasets (see Appendix B for descriptions). V alues ab o ve 1 / 2 indicate that the metadata improv es the no de prediction task. On the right axis a histogram of the likelihoo d ratios is shown, with a red line marking the av erage. no des ( 1% or 100 no des, whichev er is smaller) man y times, and computed the lik elihoo d ratio λ i ab o v e for ev ery remo ved no de. The av erage v alue for eac h dataset is shown in Fig. 3. W e observe that for the ma jorit y of datasets the metadata is capable of impro ving the pre- diction of missing no des, with the quality of the improv e- men t b eing relativ ely broadly distributed. While this means that there is a positive and statistically signifi- can t correlation b et w een the metadata and the netw ork structure, for some datasets this leads only to mo derate predictiv e improv emen ts. On the other hand, there is a minorit y of cases where the inclusion of metadata wors- ens the prediction task, leading to h λ i < 1 / 2 . In such situations, the metadata seems to divide the netw ork in a manner that is largely orthogonal to the how the net- w ork itself is connected. In order to illustrate this, w e consider some artificially generated datasets as follo ws, b efore returning to the empirical datasets. A. Alignmen t b et ween data and metadata W e construct a netw ork with N nodes divided into B d equal-sized groups, that are p erfectly assortative, i.e. no des of one group are only connected to other no des of the same group. F urthermore, the E edges of the netw ork are randomly distributed among the groups, so that they ha ve on av erage the same edge density . This yields a simple structure comp osed of the union of B d disjoin t, fully random netw orks of similar density . In the metadata la y er w e ha v e the same n um b er of M = N metadata tags, whic h are themselv es also divided in to an equal n umber B t = B d = B of equal-sized groups. In order to place E m = E edges betw een data and metadata, we also consider an alternative partition { b 0 i } of the data no des in to B groups that is not equal to the original partition { b i } used to construct the netw ork. A tag in one metadata group can only connect randomly to no des of one particular data group, and vice versa. I.e. there is a one-to-one mapping b et ween tag and data groups. In total we consider three wa ys to connect the data with the metadata: 1. A ligne d with the original data partition { b i } , i.e. tag-no de edges connect to the same data groups used to place the node-no de edges; 2. Misaligne d with the data partition, i.e. tag-node edges connect to the groups of the alternative data partition { b 0 i } ; 3. R andom : The tag-no de edges are placed entirely at random, i.e. resp ecting neither the tag nor the no de partitions. W e emphasize that 2 (misaligned) and 3 (random) are differen t: the former corresp onds to structur e d metadata that is uncorrelated with the net w ork structure, and the latter corresp onds to unstructur e d metadata. In other w ords, in the misaligned case the no de-tag graph is not fully random, since it only connects sp ecific tag groups to sp ecific node groups, whereas in the random case the no de-tag edges are indeed fully random. An example of eac h t yp e of construction for B = 2 is sho wn in Fig. 4. When performing no de prediction for artificial net- w orks constructed in this manner, one observes improv ed 7 prediction with aligned metadata systematically; how- ev er with misaligned metadata a measurable degradation can b e seen, while for random metadata neutral v alues close to h λ i = 1 / 2 are observed (see Fig. 4). The degra- dation observed for misaligned metadata is due to the sub division of the data groups into B smaller subgroups, according to how they are connected to the metadata tags. This sub division, how ever, is not a meaningful wa y of capturing the pattern of the no de-no de connections, since all no des that belong to the same plan ted group are statistically indistinguishable. If the num b er of sub- groups is sufficiently large, this will inv ariably induce the incorp oration of noise in to the model via the different n umber of edges inciden t on each subgroup 4 . Since these differences result only from statistical fluctuations, they are bad predictors of unobserved data, and hence cause the degradation in predictive qualit y . W e note, how ev er, that in the limiting case where the num b er of nodes inside eac h sub division b ecomes sufficiently large, the degrada- tion v anishes, since these statistical fluctuations b ecome increasingly less relev ant (see Fig. 4, curve N/B = 10 3 ). Nev ertheless, for sufficien tly misaligned metadata the to- tal n um b er of inferred data groups can increase signif- ican tly as B d = B 0 d × B t , where B 0 d is the n um ber of data groups used to generate the net w ork. Therefore, in practical scenarios, the presence of structur e d (i.e. non- random) metadata that is strongly unc orr elate d with the net work structure can indeed deteriorate node prediction, as observ ed in a few of the empirical examples shown in Fig. 3. B. Ho w informative are individual tags? The av erage likelihoo d ratio h λ i used abov e is mea- sured by remo ving no des from the netw ork, and include the sim ultaneous contribution of all metadata tags that annotate them. Ho wev er our mo del also divides the metadata tags in to classes, which allows us to identify the predictiv eness of each tag individually according to this classification. With this, one can separate informa- tiv e from noninformativ e tags within a single dataset. W e again quantify the predictiveness of a metadata tag in its capacity to predict which other no des will connect to the one it annotates. According to our model, the probabilit y of some data no de i b eing annotated b y tag t is given by P t m ( i | t ) = d i m b i ,c t m b i m c t , (11) whic h is conditioned on the group mem b erships of b oth data and metadata no des. Analogously , the probabilit y 4 Note that this incorp oration of noise is not strictly an ov erfitting, since the sub divisions are still required to properly describ e the data-metadata edges. Metadata Data Aligned Misaligned Random 2 3 4 5 6 7 8 9 10 Number of planted groups, B 0 . 2 0 . 3 0 . 4 0 . 5 0 . 6 0 . 7 0 . 8 0 . 9 1 . 0 A v erage predicti v e likelihood ratio, h λ i Aligned Random Misaligned Misaligned ( N / B = 10 3 ) Figure 4. T op: Examples of artificial annotated net w orks, sho wing aligned, misaligned and random metadata, as de- scrib ed in the text. Bottom: No de prediction p erformance, measured by the likelihoo d ratio h λ i , av erage ov er all possi- ble single-no de remo v als, for annotated netw orks generated with B d = B t = B groups, N = M = 30 × B nodes and tags, E = E m = 5 × N no de-no de and tag-no de edges, with sp ecific netw ork construction given by the legend. One of the curves corresp onds to netw orks with misaligned metadata with a larger num ber of nodes, N = M = 10 3 × B . of some data node i b eing a neigh b or of a c hosen data no de j is given by P e ( i | j ) = k i e b i ,b j e b i e b j . (12) Hence, the probability of i b eing a neigh b or of an y node j that is annotated with tag t is given by P t ( i ) = X j P ( i | j ) P m ( j | t ) . (13) In order to compare the predictive quality of this dis- tribution, w e need to compare it to a nul l distribution where the tags connect randomly to the no des, Q ( i ) = X j P ( i | j )Π( j ) , (14) where Π( i ) = d i / M , with M = P r 1 , this is not typical ev en for highly informative tags, and w ould mean that a particu- larly unlikely set of neighbors b ecomes particularly likely once we consider the annotation. Instead, a more typical highly informative metadata annotation simply narrows do wn the predicted neighborho od to a typic al group sam- pled from q . Using the abov e criterion w e inv estigated in detail the datasets of Fig. 3, and quantified the predictiv eness of the no de annotations, as is sho wn in Fig. 5 for a selected sub- set. Ov erall, we observe that the datasets differ greatly not only in the ov erall predictiv eness of their annota- tions, but also in the internal structures. T ypically , w e find that within a single dataset the metadata predic- tiv eness is widely distributed. A go od example of this is the IMDB data, whic h describ es the connection b et ween actors and films, and includes annotations on the films corresp onding to the year and country of pro duction, the pro ducers, the pro duction company , the genres, user rat- ings as w ell as user-con tributed k eywords. In Fig. 5a w e see that the larger fraction of annotations p osses v ery low predictiv eness (whic h includes the v ast ma jority of user- con tributed k eyw ords and ratings), how ever there is still a significan t n um b er of annotations that can b e quite predictiv e. The most predictiv e t yp es of metadata are com binations of pro ducers and directors (e.g. Carto on pro ductions), follo w ed by sp ecific countries (e. g. New Zealand, Norw a y) and y ear of pro ductions. Besides k ey- w ords and ratings, film genres are among those with the lo west predictiveness. A somewhat narrow er v ariabilit y is observed for the APS citation data in Fig. 5b, where the three types of annotations are clearly distinct. The P ACS n umbers are the most informative on av erage, fol- lo wed by the date of publication (with older dates b eing more predictiv e then new ones — presumably due to the increasing publication volume and diversification ov er the y ears), and lastly the journal. One prominen t exception is the most predictive metadata group that corresp onds to the now-extinct “Physical Review (Series I)” journal, and its publication dates ranging from 1893 to 1913. F or the Amazon dataset of Fig. 5c, the metadata also exhibits significan t predictive v ariance, but there are no groups of tags that p ossess v ery low v alues, indicating that most pro duct categories are indeed strong indications of co- purc hases. This is similar to what is observed for the In- ternet AS, with most countries b eing goo d predictors of the netw ork structure. The least predictiv e annotations happ en to b e a group of ten coun tries that include the US as the most frequent one. A muc h wider v ariance is observ ed in the DBLP collab oration net work, where the publication ven ues seem to be divided in tw o branches: v ery frequen t and popular ones with low to mo derate predictiv eness, and many very infrequent ones with high to v ery high predictiveness. F or other datasets a wide v ariance in predictiveness is not observed. In particular for most F aceb ook net w orks as w ell as protein-protein in teraction netw orks, the av ailable metadata seems to b e only tenuously correlated with the net w ork structure, with narrowly-distributed v alues of lo w predictiv eness, in accordance with their relatively low placement in Fig. 3. IV. PREDICTION OF MISSING MET ADA T A Since we hav e defined a full join t mo del for data and metadata, our framew ork is not restricted to prediction of missing nodes, but can also predict missing edges b oth in the data and metadata lay ers. The latter can b e used to predict incomplete metadata information, whic h cor- resp onds to missing edges b et w een data nodes and meta- data tags, as follows. Supp ose the tag la y er is decom- p osed as the union of tw o edge sets, δ T ∪ T , where T is a set of observ ed data-metadata edges, and δ T is a set of missing edges of the same type. Under our mo del, we can write the marginal posterior likelihoo d for δ T as P ( δ T | T , b, c ) = P ( δ T ∪ T | T , b, c ) P ( T | b, c ) , (19) where P ( T | b, c ) = P δ T P ( δ T ∪ T | b, c ) is a normalization constan t. If we ha ve our set of missing edges coming from 9 10 0 10 1 10 2 10 3 10 4 Metadata group size, n r 0 . 0 0 . 2 0 . 4 0 . 6 0 . 8 1 . 0 1 . 2 Metadata group predicti v eness, µ r K e ywords Producers Directors Ratings Country Genre Production Y ear (a) IMDB 10 0 10 1 10 2 Metadata group size, n r 0 . 0 0 . 2 0 . 4 0 . 6 0 . 8 1 . 0 Metadata group predicti v eness, µ r Journal P A CS Date (b) APS citations 10 1 10 2 10 3 10 4 Metadata group size, n r 0 . 0 0 . 2 0 . 4 0 . 6 0 . 8 1 . 0 Metadata group predicti v eness, µ r Cate gories (c) Amazon 10 0 10 1 10 2 Metadata group size, n r 0 . 0 0 . 2 0 . 4 0 . 6 0 . 8 1 . 0 1 . 2 1 . 4 Metadata group predicti v eness, µ r Publication v enues (d) DBLP 10 0 10 1 Metadata group size, n r 0 . 0 0 . 2 0 . 4 0 . 6 0 . 8 1 . 0 Metadata group predicti v eness, µ r T ags (e) Debian pac k ages 10 0 10 1 Metadata group size, n r 0 . 0 0 . 2 0 . 4 0 . 6 0 . 8 1 . 0 Metadata group predicti v eness, µ r Country (f ) In ternet AS 10 0 10 1 10 2 10 3 Metadata group size, n r 0 . 0 0 . 2 0 . 4 0 . 6 0 . 8 1 . 0 Metadata group predicti v eness, µ r Dorm Gender High School Major Y ear (g) FB P enn 10 0 10 1 10 2 10 3 Metadata group size, n r 0 . 0 0 . 2 0 . 4 0 . 6 0 . 8 1 . 0 Metadata group predicti v eness, µ r Dorm Gender High School Major Y ear (h) FB Harv ard 10 1 10 2 Metadata group size, n r 0 . 0 0 . 2 0 . 4 0 . 6 0 . 8 1 . 0 Metadata group predicti v eness, µ r Gene ontologies (i) PPI (Krogan) Figure 5. Metadata predictiveness for several empirical datasets. The figures show the predictiveness of metadata groups µ r (Eq. 18) vs. metadata group sizes, n r .The sizes of the symbols indicate the metadata frequency . The symbols correspond to the most frequent types of tags in each group (which may con tain tags of different types). On the axis of each figure are shown marginal histograms, weigh ted according to the tag frequencies. A red horizontal line marks the av erage predictiv eness. a restricted set of p ossibilities, δ T ∈ { δ T 1 , δ T 2 , . . . } , w e ma y write the predictive likelihoo d ratio λ i = P ( δ T i | T , b, c ) P j P ( δ T j | T , b, c ) = P ( δ T i ∪ T | b, c ) P j P ( δ T j ∪ T | b, c ) , (20) 10 9 - Southeastern 3 - Big T welv e 2 - Big T en 6 - Mid-American 8 - P acific T en 0 - Atlantic Coast 10 - W estern Athletic 5 - Big W est 7 - Mountain W est 1 - Big East 4 - Conference USA 11 - NotreDame 12 - Na vy 13 - Connecticut 14 - CentralFlorida 15 - Middle T ennessee State 16 - LouisianaT ech 17 - LouisianaMonroe 18 - LouisianaLafayette 0 . 0 0 . 1 0 . 2 0 . 3 0 . 4 0 . 5 0 . 6 0 . 7 0 . 8 h λ i Figure 6. A verage predictive likelihoo d ratio h λ i of missing metadata tags (conferences) for the American fo otball data, using the annotations giv en in Ref. [46]. T ags 11 to 18 are “indep enden ts”, i.e. teams that do not b elong to any confer- ence. The dashed line marks the v alue 1 / 19 , corresp onding to a uniform likelihoo d b etw een all tags. where the normalization constan t of Eq. 19 no longer pla ys a role. Hence, if we wan t to compare the likelihoo d of a given set of alternativ e node annotations, all w e need to do is to infer the parameters b and c of the mo del given the observ ed net w ork, { ˆ b, ˆ c } = argmax { b,c } P ( T | b, c ) P ( b ) P ( c ) , (21) and then add the missing edges δ T i to the lik eliho od using this p arameter estimate to compute the likelihoo d ratio of Eq. 20. W e illustrate the application of our metho d again with the American college fo otball data. F or each data no de (team), we remov e the single metadata tag asso ciated with it (i.e. the team’s conference), perform the model inference, and compute the predictive lik elihoo d ratio of Eq. 20 for the remov ed tag, with respect to all other p ossible tags. The av erages ov er all teams that b elong to a given conference are shown in Fig. 6. The metho d succeeds in predicting the correct conference assignment with the highest lik eliho od in all cases, except for the “indep enden t” teams. These teams do not b elong to any conference, and are therefore assigned a unique confer- ence tag. When this assignment is remov ed, it leav es an indep enden t tag without any connection to the graph, and hence out mo del is not able to predict its placement. But since there is no additional information in the data once this sole assignment is remov ed, it is simply imp os- sible to mak e an informative guess. In the cases where it is p ossible, our approach seems able to leverage the a v ail- able information and increases the changes of successful metadata prediction. V. CONCLUSION W e presented a general mo del for the large-scale struc- ture of annotated net works that do es not in trinsically as- sume that there is a direct corresp ondence b et ween meta- data tags and the division of net work in to groups, or com- m unities. Instead, w e assume that the data-metadata correlation is itself generated by an underlying pro cess, with parameters that are unkno wn a priori . W e pre- sen ted a Bay esian framework to infer the mo del param- eters from data, which is capable of uncov ering — in addition to the netw ork structure — the connection b e- t ween netw ork structure and annotations, if there is one to b e found. W e show ed ho w this information can be used to predict missing no des in the netw ork when only the annotations are known. When applying the metho d for a v ariety of anno- tated datasets, we found that their annotations lie in a broad range with resp ect to their correlation with net- w ork structure. F or most datasets considered, there is evidence for statistically significan t correlations betw een the annotations and the netw ork structure, in a man- ner that can b e detected b y our metho d, and exploited for the task of no de prediction. F or a few datasets, how- ev er, w e found evidence of metadata which is not trivially structured, but seems to b e largely uncorrelated with the actual net w ork structure. The predictiveness v ariance of metadata observed across differen t datasets is also often found inside individ- ual datasets. T ypically , single datasets p ossess a wealth of annotations, most of which are not very informative on the net w ork structure, but a smaller fraction clearly is. Our metho d is capable of separating groups of annota- tions with resp ect to their predictiveness, and hence can b e used to prune such datasets from “metadata noise”, by excluding lo w-p erforming tags from further analysis. As is alwa ys true when doing statistical inference, re- sults obtained are conditioned on the v alidit y of the mo del formulation, whic h in v ariably includes assump- tions ab out the data-generating pro cess. In our case, this means that the data-metadata la yer can be represen ted as a graph, and that it is well mo delled by a SBM. Natu- rally , this is only one of many possibilities, and it remains an op en problem to determine which alternatives w ork b est for any giv en annotated netw ork. This is particu- larly true for annotations that corresp ond to con tin uous v alues (e.g. time and space), whic h w ould need either to b e discretized b efore the application of our metho d, or preferably , would require a differen t mo delling ansatz (see e.g. Ref. [20]). Nev ertheless, w e argue that the present approac h is an appropriate starting point, that provides an imp ortan t but ov erlooked p erspective in the context of communit y detection v alidation. In a recent study [7] a systematic comparison b et ween v arious comm unity detection meth- o ds and no de annotations was p erformed, where for most of them strong discrepancies w ere observed. If we tem- p orarily (and unjustifiably) assume a direct agreement 11 with av ailable annotations as the “gold standard”, this discrepancy can be interpreted in a few wa ys. Firstly , the methods might b e designed to find structures that fit the data p oorly , and hence cannot capture their most essen tial features. Secondly , ev en if the general ansatz is sound, a giv en algorithm might still fail for more tech- nical and subtle reasons. F or example, most metho ds considered in Ref. [7] do not attempt to gauge the sta- tistical significance of their results, and hence are sub- ject to ov erfitting [47, 48]. This incorporation of sta- tistical noise will result in largely meaningless division of the netw orks, which would b e p oorly correlated with the “true” division. Additionally , recen tly Newman and Clauset [20] suggested that while the b est-fitting division of the netw ork can b e p oorly correlated with the meta- data, the net work may still admit alternative divisions that are also statistically significant, but happ en to b e w ell correlated with the annotations. On the other hand, the metadata heterogeneit y we found with our metho d giv es a strong indication that no de annotations should not b e used in direct compar- isons to comm unity detection metho ds in the first place — at least not indiscriminately . In most net works we an- alyzed, even when the metadata is strongly predictiv e of the netw ork structure, the agreemen t b et ween the anno- tations and the net work division tends to be complex, and v ery different from the one-to-one mapping that is more commonly assumed. F urthermore, almost all datasets con tain considerable noise in their annotations, corre- sp onding to metadata tags that are essentially random. F rom this, we argue that data annotations should not b e used as a panacea in the v alidation of communit y detec- tion metho ds. Instead, one should fo cus on v alidation metho ds that are grounded in statistical principles, and use the metadata as source of additional evidence — it- self p ossessing its own internal structures and also sub ject to noise, errors and omissions — rather than a form of absolute truth. A CKNOWLEDGMENTS W e ac knowledge the computational resources provided b y the Aalto Science-IT pro ject. D. H. and S.F. grate- fully ackno wledge MUL TIPLEX, gran t num ber 317532 of the Europ ean Commission. T.P .P ac kno wledges supp ort from the Universit y of Bremen under funding program ZF04. App endix A: Mo del lik eliho od and priors As men tioned in the text, the micr o c anonic al degree- corrected SBM log-likelihoo d is given by [35] ln P ( A | b , θ ) ≈ − E − 1 2 X rs e rs ln e rs e r e s − X i ln k i ! , (A1) (if Stirling’s factorial appro ximation is used) and likewise for ln P ( T | c , γ ) , where one replaces e rs b y m rs and k i b y d i , ln P ( T | c , γ ) ≈ − M − 1 2 X rs m rs ln m rs m r m s − X i ln d i ! , (A2) where E = P rs e rs / 2 and M = P rs m rs / 2 . This assumes that the graph is sufficiently sparse, other- wise corrections need to b e introduced, as describ ed in Ref. [35, 36]. In order to compute the full join t lik eliho od, w e need priors for the parameters { b i } , { c i } , { k i } , { d i } , { e rs } and { m rs } . F or the no de partitions, we use a tw o-lev el Bay esian hierarc hy as done in Ref. [33], where one first samples the group sizes from a random histogram, and then the no de partition randomly conditioned on the group sizes. The nonparametric lik eliho od is giv en b y P ( { b i } ) = e −L p , with L p = ln B N + ln N ! − X r ln n r ! , (A3) where n m = n + m − 1 m is the total num b er of m - com binations with rep etitions from a set of size n . The prior P ( { c i } ) is analogous. F or the degree sequences, we pro ceed in the same fash- ion [36], by sampling the degrees conditioned on the total n umber of edges incident on eac h group, b y first sampling a random degree histogram with a fixed a v erage, and fi- nally the degree sequence conditioned on this distribu- tion. This leads to a likelihoo d P ( { k i }|{ e rs } , { b i } ) = e −L κ , with L κ = X r ln Ξ r + ln n r ! − X k ln n r k ! , (A4) where ln Ξ r ' 2 p ζ (2) e r . Again, the likelihoo d for P ( { d i }|{ m rs } , { c i } ) is entirely analogous. F or the matrix of edge counts { e rs } w e use the hier- arc hical prior prop osed in Ref. [33]. Here w e view this matrix as the adjacency matrix of a multigraph with B d no des and E d = P rs e rs / 2 edges. W e sample this multi- graph from another SBM with a n umber of groups B 1 d , whic h itself is sampled from another SBM with B 2 d groups and so on, until B L d = 1 for some depth L . The whole nonparametric lik eliho od is then P ( { e rs } ) = e − Σ , with Σ = L X l =1 S m ( { e l rs } , { n l r } ) + L l − 1 t , (A5) with { e l rs } , { n l r } describing the blo ck model at level l , and S m = X r>s ln n r n s e rs + X r ln ( ( n r 2 ) ) e rr / 2 (A6) is the entrop y of the corresp onding multigraph ensemble and L l t = ln B l B l − 1 + ln B l − 1 ! − X r ln n l r ! . (A7) 12 Dataset N d E d N t E t B d B t LFR 1,000 9,839 40 1,000 29 29 PPI (Krogan) 5,247 45,899 4,896 5,4904 62 55 PPI (Y u) 964 1,487 2,119 10,304 16 17 PPI (isobase-hs) 8,580 34,250 1,972 20,633 40 15 PPI (gastric) 4,763 26,131 10,445 94,035 50 50 PPI (lung) 4,843 27,459 10,948 100,492 55 50 PPI (pancreas) 4,759 25,978 10,444 93,686 49 46 PPI (predicted) 7,606 23,446 12,337 143,847 69 68 FB Caltech 762 16,651 591 4,145 22 5 FB Penn 41,536 1,362,220 4,805 216,349 365 29 FB Harv ard 15,086 824,595 3,942 74,293 192 15 FB Stanford 11,586 568,309 3,337 57,940 182 12 FB Berkeley 22,900 852,419 2,906 116,556 267 16 FB Princeton 6,575 293,307 2,396 32,901 110 10 FB T ennessee 16,977 770,658 2,660 89,458 271 20 FB V assar 3,068 119,161 1,620 16,859 69 12 Pol. blogs 1,222 16,714 2 1,222 12 2 DPD 35,029 161,313 580 115,999 253 59 PGP 39,796 197,150 35,370 148,966 485 380 Internet AS 46,676 262,953 225 45,987 224 59 aNobii 140,687 869,448 8,003 926,403 194 70 Amazon 366,997 987,942 43,807 1,775,085 4,477 255 DBLP 317,080 1,049,866 13,477 719,820 4,667 1,746 IMDB 372,787 1,812,657 139,025 3,030,003 843 328 APS citations 437,914 4,596,335 22,530 1,916,281 5,681 954 Flickr 1,624,992 15,476,836 99,270 8,493,666 779 158 T able I. Summary of the basic statistics of the datasets used in this w ork. N d and E d are the num ber of data no des and data- data edges, respectively , whereas N t and E t are the num ber of metadata tags and no de-tag edges, resp ectiv ely . B d and B t are the num b er of data and metadata groups inferred with our metho d. is the description length of the no de partition at level l > 0 . The pro cedure is exactly the same for the prior P ( { m rs } ) . App endix B: Datasets Belo w we list descriptions of the annotated datasets used in this work. Basic statistics are given in T able I. a. LFR. Lancic hinetti-F ortunato-Radicc hi b enc h- mark graph with N = 1000 vertices and comm unity sizes b et w een 10 and 50 , with mixing parameter µ = 0 . 5 [49]. The remaining parameters are the same as in Ref. [49]. This mo del corresp onds to a sp ecific parametrization of the degree-corrected SBM [34], and is often used to test and optimize most curren t algorithms, and th us serves as a baseline reference for a net work with kno wn and de- tectable structure. The netw ork was created with stan- dard LFR code av ailable at https://sites.google. com/site/santofortunato/inthepress2 . b. PPI networks. In these net works no des are in- dividual proteins, and there is a link b et ween them if there is a confirmed in teraction. Protein labels from Gene On tology pro ject (GO) 5 are used as node anno- tations. The netw orks themselv es corresp ond to several 5 Retrieved from http://geneontology.org/. differen t sources: Kr o gan and Y u correspond to y east (Sacc haromyces Cerevisiae), from t w o different publica- tions: Krogan [50] and Y u [51]; isob ase-hs corresp onds to h uman proteins, as collected b y the Isobase pro ject [52]; Pr e dicte d include predicted and exp erimentally deter- mined protein-protein in teractions for humans, from the PrePPI pro ject [53] (h uman interactions that are in the HC reference set predicted by structural modeling but not non-structu ral clues); Gastric, p ancr e as, lung are ob- tained by splitting the PrePPI netw ork [53] b y the tissue where eac h protein is expressed. c. F ac eb o ok networks (FB). Netw orks of so cial connections on the facebook.com online social netw ork, obtained in 2005, corresponding to studen ts of different univ ersities [54]. All friendships are presen t as undirected links, as well as six t yp es of annotation: Dorm (residence hall), ma jor, second ma jor, graduation year, former high sc ho ol, and gender. d. Internet AS. Netw ork of the Internet at the lev el of Autonomous Systems (AS). Nodes represent au- tonomous systems, i.e. systems of connected routers un- der the con trol of one or more net w ork op erators with a common routing p olicy . Links represent observed paths of In ternet Protocol traffic directly from one AS to an- other. The no de annotations are countries of registration of each AS. The data w ere obtained from the CAID A pro ject 6 . e. DBLP. Net work of collaboration of computer scien tists. T wo scientists are connected if they hav e coau- thored at least one pap er [55]. No de annotations are publication v enues (scientific conferences). Data is do wn- loaded from SNAP 7 [4]. f. aNobii. This is an online so cial netw ork for shar- ing b ook recommendations, p opular in Italy . Nodes are user profiles, and there can b e tw o types of directed re- lationships b etw een them, which we used as undirected links (“friends” and “neighbors”). Data w ere pro vided b y Luca Aiello [56, 57]. W e used all presen t no de metadata, of which there are four kinds: Age, lo cation, coun try , and mem b ership. g. PGP. The “W eb of trust” of PGP (Pretty Go o d Priv acy) key signings, representing an indication of trust of the iden tity of one p erson (signee) by another (signer). A node represents one key , usually but not alwa ys cor- resp onding to a real p erson or organization. Links are signatures, which b y conv en tion are intended to only b e made if the tw o parties are physically present, hav e veri- fied each others’ identities, and hav e verified the k ey fin- gerprin ts. Data is taken from a 2009 snapshot of public SKS k eyserv ers [58]. h. Flickr. Picture sharing web site and so cial net- w ork, as crawled by Mislov e et al [59]. No des are users and edges exist if one user “follows” another. The no de 6 http://www.caida.org/ 7 Retrieved from http://snap.stanford.edu/data/com- DBLP. html 13 annotations are user groups centered around a certain t yp e of conten t, such as “nature” or “Finland”. i. Politic al Blo gs. A directed netw ork of h yp er- links b et w een weblogs on US politics, recorded in 2005 b y Adamic and Glance [60]. Links are all front-page h y- p erlinks at the time of the crawl. No de annotations are “lib eral” or “conserv ativ e” as assigned by either blog di- rectories or o ccasional self-ev aluation. j. Debian p ackages. Softw are dep endencies within the Debian GNU/Lin ux op erating sys- tem 8 . Nodes are unique softw are pack ages, suc h as linux-image-2.6-amd64 , libreoffice-gtk , or python-scipy . Links are the “depends”, “recommends”, and “suggests” relationships, whic h are a feature of Debian’s APT pack age management system designed for tracking dep endencies. Node annotations are tag memberships from the DebT ags pro ject 9 , suc h as devel::lang:python or web::browser [61]. The net work was generated from pack age files in Debian 7.1 Wheezy as of 2013-07-15, “main” area only . Similar files are freely av ailable in ev ery Debian-based OS. T ags can b e found in the *_Packages files in the /var/lib/apt/ directory in an installed system or on mirrors, for ex- ample ftp://ftp.debian.org/debian/dists/wheezy/ main/binary- amd64/ . k. amazon. Net work of pro duct copurc hases on on- line retailer amazon.com . No des represent pro ducts, and edges are said to represent copurchases by other customers presen ted on the product page [62]. The true meaning of links is unkno wn and is some func- tion of Amazon’s recommendation algorithm. Data w as scrap ed in mid-2006 and downloaded from http: //snap.stanford.edu/data/amazon- meta.html . W e used copurchasing relationships as undirected edges. Pro duct categories were used as no de annotations. Al- though pro duct categories are hierarc hical b y nature, we used only the endpoints (or “lea v es”) of the hierarc hy: Books/Fiction/Fantasy/Epic and Books/Nonfiction are t w o differen t metadata lab els. l. IMDB. This netw ork is compiled b y extracting information av ailable in the In ternet Movie Database (IMDB) 10 , and it con tains eac h cast member and film as distinct no des, and an undirected edge exists b etw een a film and each of its cast mem bers. The netw ork used here corresp onds to a snapshot made in 2012 [40]. The no de annotations are the following information av ailable on the films: Coun try and year of pro duction, pro duction compan y , pro ducers, directors, genre, user-contributed k eywords and genres. m. APS citations. This net work corresp onds to directed citations b et w een pap ers published in journals of the American Ph ysical Society for a p eriod of o v er 100 years 11 . The node annotations corresp ond to P ACS classification tags, journal and publication date. [1] San to F ortunato, “ Communit y detection in graphs,” Ph ysics Rep orts 486 , 75–174 (2010). [2] Mason A P orter, Jukk a-Pekk a Onnela, and Peter J Muc ha, “ Communities in Netw orks,” 0902.3788 (2009), notices of the American Mathematical So ciet y , V ol. 56, No. 9: 1082-1097, 1164-1166, 2009. [3] M. E. J. Newman, “ Communities, mo dules and large- scale structure in netw orks,” Nat Phys 8 , 25–31 (2011). [4] Jaew on Y ang and Jure Lesk ov ec, “ Defining and ev alu- ating netw ork communities based on ground-truth,” in Pr o c e e dings of the ACM SIGKDD W orkshop on Mining Data Semantics , MDS ’12 (ACM, New Y ork, NY, USA, 2012) pp. 3:1–3:8. [5] Jaew on Y ang and J. Lesk o v ec, “ Comm unity-Affiliation Graph Model for Overlapping Net work Communit y De- tection,” in 2012 IEEE 12th International Confer enc e on Data Mining (ICDM) (2012) pp. 1170–1175. [6] Jaew on Y ang and Jure Lesk ov ec, “ Structure and Overlaps of Communities in Netw orks,” arXiv:1205.6228 [physics] (2012), arXiv: 1205.6228. [7] Dark o Hric, Ric hard K. Darst, and Santo F ortunato, “ Comm unity detection in netw orks: structural clusters v ersus ground truth,” arXiv:1406.0146 [physics, q-bio] (2014), arXiv: 1406.0146. 8 http://www.debian.org 9 https://wiki.debian.org/Debtags 10 http://www.imdb.com 11 Retrieved from http://publish.aps.org/dataset [8] Tiago P . Peixoto, “ Inferring the mesoscale structure of la yered, edge-v alued, and time-v arying net works,” Phys. Rev. E 92 , 042807 (2015). [9] Natalie Stanley , Saray Shai, Dane T aylor, and P eter J. Muc ha, “ Clustering Netw ork Lay ers With the Strata Multila yer Sto chastic Blo c k Model,” [ph ysics, stat] (2015), arXiv: 1507.01826. [10] Christopher Aicher, Abigail Z. Jacobs, and Aaron Clauset, “ Learning latent blo c k structure in weigh ted net- w orks,” jcomplexnet w 3 , 221–248 (2015). [11] T oni V allès-Català, F rancesco A. Massucci, Roger Guimerà, and Marta Sales-Pardo, “ Multilay er Stochastic Blo c k Mo dels Reveal the Multila yer Structure of Com- plex Netw orks,” Phys. Rev. X 6 , 011036 (2016). [12] Cristopher Moore, Xiaoran Y an, Y ao jia Zhu, Jean- Baptiste Rouquier, and T erran Lane, “ Activ e learning for no de classification in assortative and disassortative net works,” in Pr o ce e dings of the 17th ACM SIGKDD in- ternational c onfer enc e on Know le dge disc overy and data mining , KDD ’11 (ACM, New Y ork, NY, USA, 2011) pp. 841–849. [13] Mingw ei Leng, Y uk ai Y ao, Jianjun Cheng, W eiming Lv, and Xiao yun Chen, “ Activ e Semi-supervised Comm u- nit y Detection Algorithm with Label Propagation,” in Datab ase Systems for A dvanc e d Applic ations , Lecture Notes in Computer Science No. 7826, edited b y W eiyi Meng, Ling F eng, Stéphane Bressan, W erner Winiwarter, and W ei Song (Springer Berlin Heidelb erg, 2013) pp. 324– 338, dOI: 10.1007/978-3-642-37450-0_25. 14 [14] Leto P eel, “ Activ e discov ery of netw ork roles for predict- ing the classes of netw ork no des,” jcomplexnetw 3 , 431– 449 (2015). [15] Jaew on Y ang, J. McAuley , and J. Lesk ov ec, “ Commu- nit y Detection in Netw orks with No de A ttributes,” in 2013 IEEE 13th International Confer enc e on Data Min- ing (ICDM) (2013) pp. 1151–1156. [16] Cecile Bothorel, Juan David Cruz, Matteo Magnani, and Barb ora Micenk ov a, “ Clustering attributed graphs: mo d- els, measures and methods,” arXiv:1501.01676 [physics] (2015), arXiv: 1501.01676. [17] P an Zhang, Cristopher Moore, and Lenk a Zdeborov á, “ Phase transitions in semisup ervised clustering of sparse net works,” Ph ys. Rev. E 90 , 052802 (2014). [18] Zhong-Y uan Zhang, “ Communit y structure detection in complex net works with partial background information,” EPL 101 , 48005 (2013). [19] An tonino F reno, Gemma Garriga, and Mik aela Keller, “ Learning to Recommend Links using Graph Structure and No de Conten t,” (2011). [20] M. E. J. Newman an d Aaron Clauset, “ Structure and inference in annotated netw orks,” Nat Comm un 7 , 11863 (2016). [21] Da vid Lib en-No w ell and Jon Kleinberg, “ The link- prediction problem for social netw orks,” Journal of the American So ciet y for Information Science and T echnol- ogy 58 , 1019–1031 (2007). [22] Aaron Clauset, Cristopher Moore, and M. E. J. New- man, “ Hierarchical structure and the prediction of miss- ing links in netw orks,” Nature 453 , 98–101 (2008). [23] Roger Guimerà and Marta Sales-Pardo, “ Missing and spurious interactions and the reconstruction of complex net works,” Pro ceedings of the National Academ y of Sci- ences 106 , 22073 –22078 (2009). [24] Roger Guimerà and Marta Sales-P ardo, “ A Netw ork In- ference Metho d for Large-Scale Unsupervised Iden tifica- tion of No vel Drug-Drug In teractions,” PLOS Comput Biol 9 , e1003374 (2013). [25] Núria Ro vira-Asenjo, Tània Gumí, Marta Sales-P ardo, and Roger Guimerà, “ Predicting future conflict betw een team-mem b ers with parameter-free mo dels of so cial net- w orks,” Sci. Rep. 3 (2013), 10.1038/srep01999. [26] Nicolò Musmeci, Stefano Battiston, Guido Caldarelli, Mic helangelo Puliga, and Andrea Gabrielli, “ Bo otstrap- ping T op ological Prop erties and Systemic Risk of Com- plex Net w orks Using the Fitness Mo del,” J Stat Ph ys 151 , 720–734 (2013). [27] Giulio Cimini, Tiziano Squartini, Andrea Gabrielli, and Diego Garlaschelli, “ Estimating top ological prop erties of w eighted net works from limited information,” Ph ys. Rev. E 92 , 040802 (2015). [28] Ry an A. Rossi, Luke K. McDow ell, Da vid W. Aha, and Jennifer Neville, “ T ransforming Graph Data for Statisti- cal Relational Learning,” J. Artif. In t. Res. 45 , 363–441 (2012). [29] B. Bringmann, M. Berlingerio, F. Bonchi, and A. Gionis, “ Learning and Predicting the Ev olution of So cial Net- w orks,” IEEE Intelligen t Systems 25 , 26–35 (2010). [30] M. Kim and J. Lesko vec, “ The Net w ork Completion Problem: Inferring Missing No des and Edges in Net- w orks,” in Pr o c e e dings of the 2011 SIAM International Confer enc e on Data Mining , Proceedings (Society for In- dustrial and Applied Mathematics, 2011) pp. 47–58. [31] Mikk o Kivelä, Alex Arenas, Marc Barthelemy , James P . Gleeson, Y amir Moreno, and Mason A. P orter, “ Multi- la yer netw orks,” jcomplexnetw 2 , 203–271 (2014). [32] Manlio De Domenico, Alb ert Solé-Ribalta, Eman uele Cozzo, Mikk o Kivelä, Y amir Moreno, Mason A. Porter, Sergio Gómez, and Alex Arenas, “ Mathematical F ormu- lation of Multilay er Netw orks,” Phys. Rev. X 3 , 041022 (2013). [33] Tiago P . P eixoto, “ Hierarc hical Blo c k Structures and High-Resolution Model Selection in Large Netw orks,” Ph ys. Rev. X 4 , 011047 (2014). [34] Brian Karrer and M. E. J. Newman, “ Sto c hastic blo ck- mo dels and comm unit y structure in net w orks,” Phys. Rev. E 83 , 016107 (2011). [35] Tiago P . P eixoto, “ En tropy of sto chastic blo c kmo del en- sem bles,” Ph ys. Rev. E 85 , 056122 (2012). [36] Tiago P . P eixoto, “ Mo del Selection and Hyp othesis T est- ing for Large-Scale Net work Models with Overlapping Groups,” Phys. Rev. X 5 , 011033 (2015). [37] P eter D. Grün wald, The Minimum Description L ength Principle (The MIT Press, 2007). [38] Martin Rosv all and Carl T. Bergstrom, “ An information- theoretic framework for resolving comm unit y structure in complex netw orks,” PNAS 104 , 7327–7331 (2007). [39] E. T. Jaynes, Prob ability The ory: The L o gic of Scienc e , edited by G. Larry Bretthorst (Cam bridge Universit y Press, Cambridge, UK ; New Y ork, NY, 2003). [40] Tiago P . P eixoto, “ Parsimonious Mo dule Inference in Large Netw orks,” Phys. Rev. Lett. 110 , 148701 (2013). [41] Aurelien Decelle, Florent Krzak ala, Cristopher Moore, and Lenk a Zdeb oro v á, “ Asymptotic analysis of the sto c hastic blo c k mo del for mo dular netw orks and its al- gorithmic applications,” Phys. Rev. E 84 , 066106 (2011). [42] Tiago P . P eixoto, “ Efficien t Mon te Carlo and greedy heuristic for the inference of stochastic blo c k models,” Ph ys. Rev. E 89 , 012804 (2014). [43] Tiago P . Peixoto, “ The graph-to ol python library ,” figshare (2014), 10.6084/m9.figshare.1164194. [44] M. Girv an and M. E. J. Newman, “ Communit y structure in social and biological netw orks,” Pro ceedings of the Na- tional Academ y of Sciences 99 , 7821 –7826 (2002). [45] T S Ev ans, “ Clique graphs and ov erlapping comm uni- ties,” Journal of Statistical Mechanics: Theory and Ex- p erimen t 2010 , P12037 (2010). [46] T S Ev ans, “ American College F o otball Netw ork Files,” FigShare (2012), 10.6084/m9.figshare.93179. [47] Roger Guimerà, Marta Sales-Pardo, and Luís A. Nunes Amaral, “ Modularity from fluctuations in random graphs and complex netw orks,” Ph ys. Rev. E 70 , 025101 (2004). [48] Benjamin H. Goo d, Y v es-Alexandre de Montjo y e, and Aaron Clauset, “ Performance of modularity maximiza- tion in practical contexts,” Ph ys. Rev. E 81 , 046106 (2010). [49] Andrea Lancic hinetti, San to F ortunato, and Filipp o Radicc hi, “ Benchmark graphs for testing communit y de- tection algorithms,” Phys. Rev. E 78 , 046110 (2008). [50] Sean R. Collins, Patric k Kemmeren, Xue-Chu Zhao, Jac k F. Green blatt, F orrest Spencer, F rank C. P . Hol- stege, Jonathan S. W eissman, and Nev an J. Krogan, “ T o ward a comprehensive atlas of the physical interac- tome of Saccharom yces cerevisiae,” Mol. Cell Proteomics 6 , 439–450 (2007). [51] Haiyuan Y u, Pascal Braun, Muhammed A. Yildirim, Irma Lemmens, Kavitha V enk atesan, Julie Sahalie, 15 T omok o Hirozane-Kishik a wa, F ana Gebreab, Na Li, Nico- las Simonis, T ong Hao, Jean-F rançois Rual, Amélie Dri- cot, Alexei V azquez, Ryan R. Murray , Christophe Simon, Leah T ardivo, Stanley T am, Nenad Svrzik apa, Changyu F an, Anne-Sophie de Smet, Adriana Mot yl, Michael E. Hudson, Juyong Park, Xiaofeng Xin, Michael E. Cusick, T ro y Moore, Charlie Bo one, Michael Snyder, F rederick P . Roth, Alb ert-László Barabási, Jan T av ernier, David E. Hill, and Marc Vidal, “ High-qualit y binary protein in- teraction map of the yeast interactome netw ork,” Science 322 , 104–110 (2008). [52] Daniel Park, Rohit Singh, Michael Ba ym, Chung-Shou Liao, and Bonnie Berger, “ IsoBase: a database of func- tionally related proteins across PPI netw orks,” Nucleic A cids Res. 39 , D295–300 (2011). [53] Qiangfeng Cliff Zhang, Donald P etrey , José Ignacio Garzón, Lei Deng, and Barry Honig, “ PrePPI: a structure-informed database of protein-protein interac- tions,” Nucleic Acids Res. 41 , D828–833 (2013). [54] Amanda L. T raud, Peter J. Mucha, and Mason A. P orter, “ So cial structure of F aceb ook netw orks,” Ph ys- ica A: Statistical Mec hanics and its Applications 391 , 4165–4180 (2012). [55] Lars Backstrom, Dan Huttenlo c her, Jon Klein b erg, and Xiangy ang Lan, “ Group F ormation in Large So cial Net- w orks: Membership, Growth, and Ev olution,” in Pr o- c e e dings of the 12th ACM SIGKDD International Con- fer enc e on Know le dge Disc overy and Data Mining , KDD ’06 (ACM, New Y ork, NY, USA, 2006) pp. 44–54. [56] Luca Maria Aiello, Martina Deplano, Rossano Schi- fanella, and Giancarlo Ruffo, “ People Are Strange When Y ou’re a Stranger: Impact and Influence of Bots on So- cial Net w orks,” in Sixth International AAAI Conferenc e on W eblogs and So cial Me dia (2012). [57] Luca Maria Aiello, Alain Barrat, Ciro Cattuto, Gian- carlo Ruffo, and Rossano Schifanella, “ Link Creation and Profile Alignment in the aNobii So cial Netw ork,” in 2010 IEEE Se c ond International Confer enc e on So cial Computing (So cialCom) (2010) pp. 249–256. [58] Oliv er Rich ters and Tiago P . Peixoto, “ T rust T ransitivity in So cial Netw orks,” PLoS ONE 6 , e18384 (2011). [59] Alan Mislov e, Massimiliano Marcon, Krishna P . Gum- madi, Peter Druschel, and Bobby Bhattacharjee, “ Mea- suremen t and Analysis of Online Social Netw orks,” in Pr o c e e dings of the 7th A CM SIGCOMM Confer enc e on Internet Me asur ement , IMC ’07 (A CM, New Y ork, NY, USA, 2007) pp. 29–42. [60] Lada A. Adamic and Natalie Glance, “ The p olitical blo- gosphere and the 2004 U.S. election: divided they blog,” in Pr o c e e dings of the 3r d international workshop on Link disc overy , LinkKDD ’05 (A CM, New Y ork, NY, USA, 2005) pp. 36–43. [61] Enrico Zini, “ A cute introduction to Debtags,” in Pr o- c e e dings of the 5th annual Debian Confer enc e (2005) pp. 59–74. [62] Jure Lesko vec, Lada A. Adamic, and Bernardo A. Hub erman, “ The Dynamics of Viral Mark eting,” ACM T rans. W eb 1 (2007), 10.1145/1232722.1232727.
Original Paper
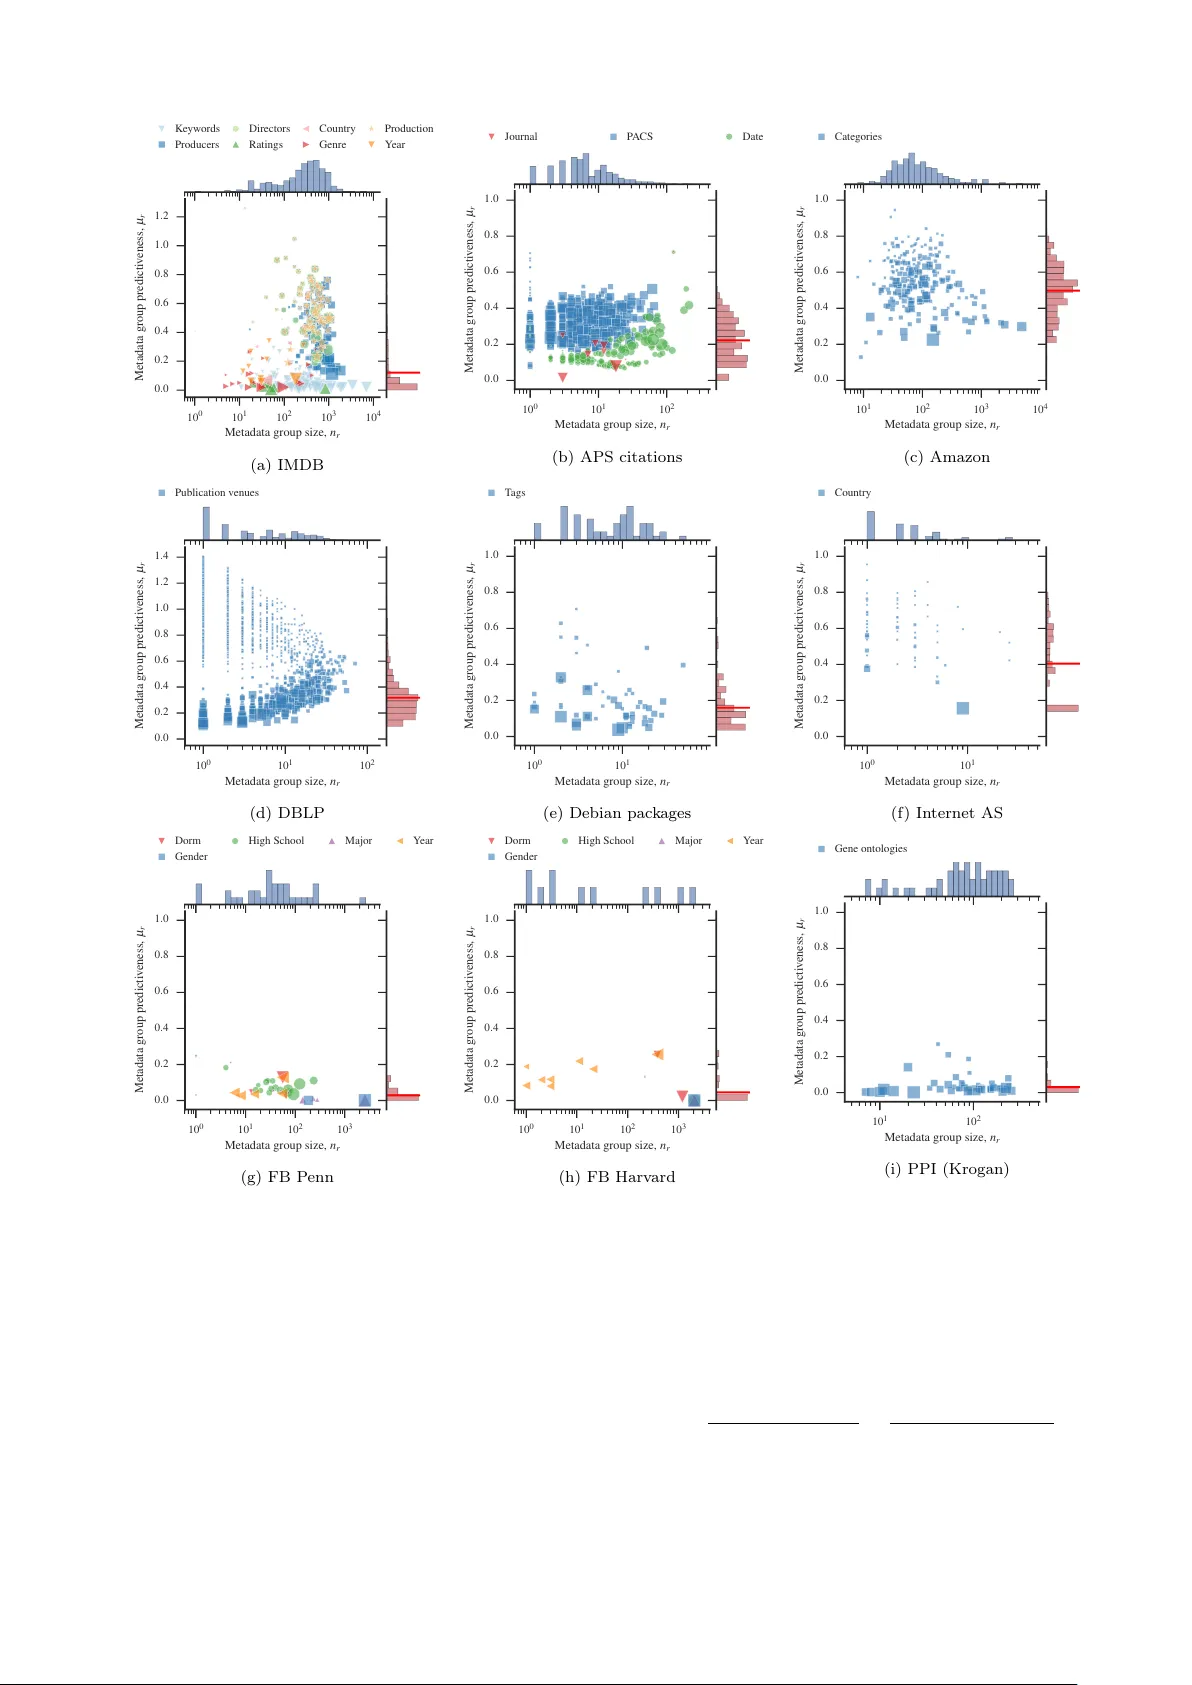
Loading high-quality paper...
Comments & Academic Discussion
Loading comments...
Leave a Comment