Knudsen Diffusion in Silicon Nanochannels
Measurements on helium and argon gas flow through an array of parallel, linear channels of 12 nm diameter and 200 micrometer length in a single crystalline silicon membrane reveal a Knudsen diffusion type transport from 10^2 to 10^7 in Knudsen number…
Authors: Simon Gruener, Patrick Huber
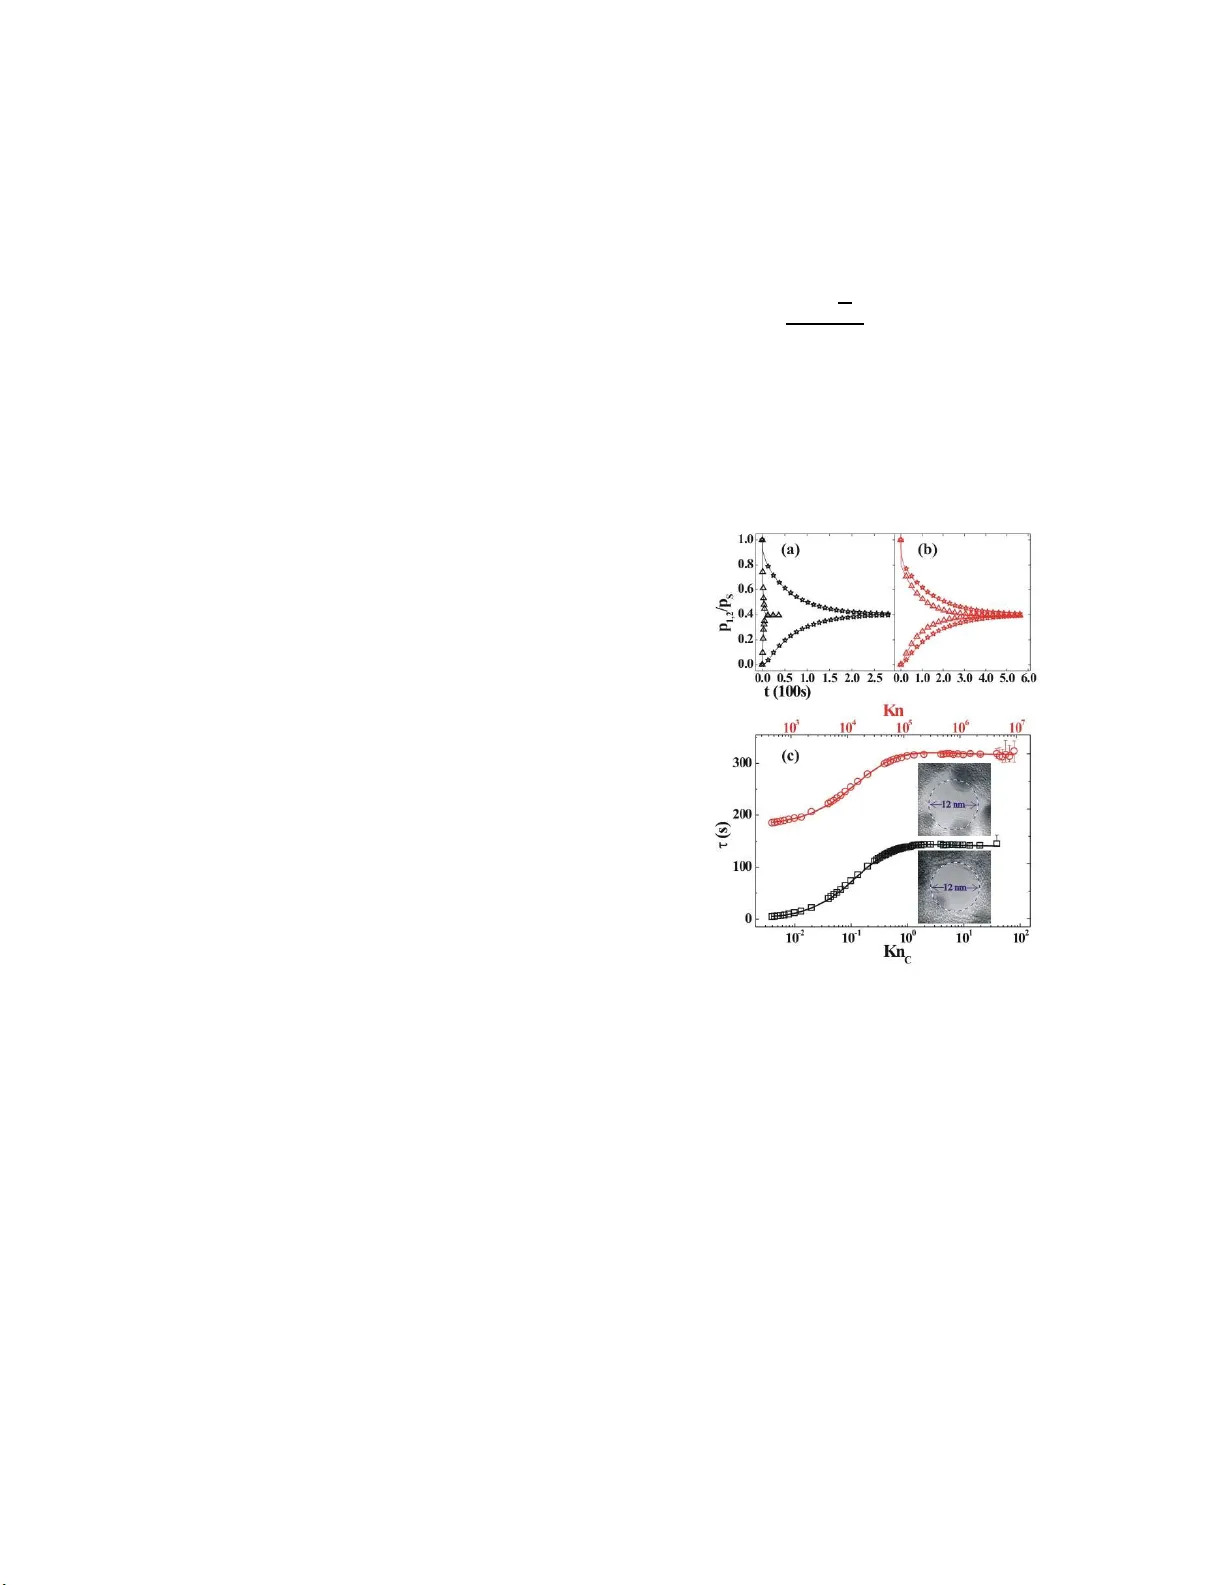
Kn udsen Diffusion in Silicon Nano c hannels Simon Gruener and P atrick Hub er ∗ F aculty of Physics and Me chatr onics Engine ering, Saarland University, D-66041 Saarbr¨ ucken, Germany Measuremen ts on helium and argon gas fl o w through an array of p arallel, linear c hannels of 12 nm diameter and 200 µ m length in a single crystalline silicon mem brane reve al a Knudsen diffusion typ e transp ort from 10 2 to 10 7 in Knudsen num ber Kn. The classic scaling prediction for the t ransport diffusion coefficient on temp erature and m ass of diffusing species, D He ∝ √ T is confirmed ov er a T -range from 40 K to 300 K for He and for th e ratio of D He /D Ar ∝ p m Ar /m He . Deviations of the channels from a cylindrical form, resolv ed with electron microscopy down to subnanometer scales, quantitativ ely account for a reduced diffusivity as compared to Knudsen diffusion in id eal tubular channels. The membrane p ermeation exp eriments are describ ed ov er 10 orders of magnitude in Kn, encompassing the transition flow regime, by the un ifi ed fl o w mod el of Beskok and Karniadakis. P ACS num bers : 47.45.n, 47.61.-k, 47.56.+r Knudsen diffusion (KD) refers to a gas transp ort regime whe r e the mean free path b et ween particle- particle collisions λ is significantly la rger than at least one characteristic spatial dimensio n d of the system con- sidered [1]. By virtue of the neg ligible mutual pa rticle collisions transp ort in such s ystems takes place via a se- ries of free flights a nd statistical flight direction changes after collis ions with the c onfining walls. Because of the depe ndency of λ on pressure p and temp erature T given by the kinetic theory of gases, λ ∝ T /p , this transp ort regime is o nly observ a ble in macrosco pic systems at v ery low p or elev a ted T . By contrast, for transp ort in spa- tially na no c o nfined systems with d = O (10 nm), the Knudsen n umber K n = λ/d , which qua n tifies the ga s rarefactio n, is larger than 1 even for am bient pr essures and tempera tures, e.g. λ (He) = 118 nm at p = 1 bar and T = 2 97 K. Thus, for man y pro cesses involving gas tra nspo r t in restricted g eometries, e .g. gas catalysis and storage [2] or equilibratio n phenomena via ga s flow in meso- and nanop ores[3, 4], K D plays a c rucial ro le . Albeit the phenomenon of KD has bee n known for al- most a h undred years, details on its microscopic mecha- nisms ar e still at debate, in particular how wall rough- ness down to atomic scales and particle-wall interaction parameters affect the statistics of the diffusion pro ces s and thus the v alue of the KD tr a nspo rt co e fficien t D [5]. In the pa s t, a co mparison b etw een theory and exp eri- men t has often been hamp ered by complex p ore net work top ologies, tortuous tr ansp o rt paths and p o orly charac- terized po re wall s tr uctures in av ailable nanop orous ma- trices. Nowada ys, mem branes with b etter defined geome- tries, such as carb on nanotub e bundles[6, 7], po rous alu- mina [8], and tailo red p ores in mesop orous silicon [3, 9], allow us to addr ess such fundamen tal questions in more detail. A b etter under standing o f, and more in-depth in- formation on, tra nspo rt in suc h systems is not only of academic interest, but also of impor tance fo r the archi- tecture and functionalit y in the emerging field of nano- electromechanical and nanofluidic systems [10, 11]. FIG. 1: (color online) He pressure relaxations in R1 and R2 at T = 297 K for sta rting pressures p s = 0 . 1 m bar (stars) and 100 mbar (triangles) without (a) and with SiN C mem- brane ( b ). (c) Pressure relaxation time τ as d etermined from measuremen ts without (squares) and w ith SiNC membrane (circles) vers us Knudsen num ber in the capillaries K n c (b ot- tom axis) and in the S iNCs K n (top axis). The lines in (a), (b) and (c) represent cal culated p ( t ) and τ ( K n ) v alues. Insets in (c): TEM cross section views of tw o SiNCs in comparison with circular p erimeters of 12 nm diameter (d ashed lines). In this Letter, we rep ort the first r igorous exp erimen- tal study o n transp ort of simple rare gases, i.e. He and Ar thr ough an array o f para llel aligned, linear channels with ∼ 12 nm diameter and 200 µ m length in single cr ys- talline Si ov er a wide temp erature (40 K < T < 30 0 K) and K n -r ange (10 2 < K n < 10 7 ). W e e x plore the clas- sical scaling predictions given b y Knudsen for D on T , mass of diffusing sp ecies, m , and explo re its dep endency on K n . At tention shall also b e pa id to the morpholo gy of the channel walls, resolved with tra nsmission electro n microscopy (TEM), and how it affects the diffusion. Linear, non-interconnected c hannels or ien ted along the h 100 i Si crys tallographic direction (SiNCs) are electro- chemically etched into the surface of a Si (10 0) wafer [12]. After the channels reach the desired length L o f 200 ± 5 µ m, the ano dization current is increased by a factor o f 10 with the result that the SiNC a rray is de- tached from the bulk wafer [13]. The cr ystalline Si walls call for irr egular channel p erimeters as o ne can see in the TE M pictures of Fig. 1 (c), recorded fro m a mem- brane part Ar ion milled to ∼ 5 nm thic kness. In fir st approximation, howev er, the SiNC’s c r oss-section can be describ ed as circular with a diameter of ∼ 12 nm, in ac- cordance with the a nalysis of a n Ar s orption exp eriment at T = 86 K , which yields a dditionally a SiNCs density of Φ = (1 . 5 ± 0 . 1) · 10 11 cm − 2 . Our exp erimental setup consis ts o f a co pper cell with an inlet and outlet op ening [14]. Inlet and outlet ar e connected via stainless s teel capillarie s of radius r c = 0 . 7 mm and length l c = 70 cm with t wo g as rese rvoirs, R1 and R2, of an all-metal gas handling. Additionally t wo pneumatic v alves V1 and V2 are used to op en and close the connections b etw een the sa mple cell and R1 and the sample cell and R2. F our thermostatted capacitiv e pressure g auges allow us to measure the gas pr e s sures in R1 and R2, p 1 and p 2 , re sp., ov er a wide pre ssure range (5 · 1 0 − 3 m bar < p < 1 bar ) with an ac curacy of 10 − 3 m bar. The cell is mounted in a closed-cycle He cryostat to control the temp erature b et ween 4 0 K and 300 K with an accuracy of 1 mK. Our goa l of studying ga s transp ort dynamics over a large K n range nece s sitates a thorough understa nding of the intrinsic flow characteristics of our apparatus. Ther e- fore, w e sta rt with measurements on He flow through the macros copic capillaries and the empty s a mple cell at ro om tempe r ature T = 29 7 K. W e record the equilibra- tion o f p 1 ( t ) and p 2 ( t ) tow ards a pressur e p eq as a function of time t a fter initial conditions, p 1 = p s > p 2 = 0 mbar at t = 0 s. In Fig. 1 (a) p 1 ( t ) /p s and p 2 ( t ) /p s are plotted for starting pressures of p s = 0 . 1 and 1 00 mbar. W e ob- serve pr essure equilibra tions tow ards p eq = 0 . 4 · p s . The v alue 0.4 is dictated b y the v olume r atio of R1 to R2. F rom the p ( t )-curves we derive character istic relax ation times τ accor ding to the r ecipe p 1 ( t = τ ) − p 2 ( t = τ ) ≡ 1 / 10 · p s . It is understo o d that p is monotonica lly decre a s- ing downstream from R1 to R2. In order to quantif y the gas rare fa ction we resor t, therefore, to a calculatio n of a mean Knudsen num b er K n c = λ ( p ) /r c in the capillaries assuming a mean pres sure, p = p eq . This simplification is justified b y the analysis provided b elow and by theo- retical studies which indicate differ ences of less than 1 % betw een flow rates c a lculated with an exact and an av- eraged trea tmen t for K n [1 0, 15]. In Fig. 1 (c) we plot measured τ v a lues versus K n c corres p onding to a p s v ar i- ation from 0 . 0 1 to 100 mbar. F or K n c < 0 . 1 , τ increases with increa sing K n c . In an in termediate K n c range, 0 . 1 < K n c < 0 . 6, w e observe a cross - ov er regime towards a sa turation plateau with τ ∼ 140 s that extends to the largest K n c studied. These changes in the p rela xation and hence flow dynamics a re reminisce nt o f the three distinct transp ort regimes known to o ccur for gas es as a function of their ra refaction [10, 16]: F or K n c < 0 . 1 the nu mber of interparticle co llisions still predo minates over the num ber of particle-wall collisions. Hagen-Poiseuille’s law is v alid and pr edicts a decreasing flow ra te a nd hence increasing τ due to the 1 /K n - scaling of the particle num- ber density in ga s flows. F or K n c > 1 we enter the pure KD regime[1], where theory predicts a He KD tra ns por t co efficient D He c depe ndent, how ever a K n c independent particle flow rate, ˙ n Kn = π r 2 c l c p o − p i k B T D He c , (1) which is resp o nsible for the plateau in τ for the larger K n c inv estigated. In Eq. 1 p i , p o refers to the inlet and o utlet pr essure of the capillar y considere d, resp., and k B to the Boltzmann factor. In the intermediate K n -rang e, the in terparticle collisions o ccur as often as particle-wall collisio ns whic h gives rise to the cro ss-ov er behavior found for τ . W e elucidate this b ehavior in more detail by divid- ing the flow pa th within our appa r atus in to tw o flow segments (up- and downstream capillar y) and ca lc ulate the par ticle num ber changes alo ng the flow path and the r esulting p 1 ( t ), p 2 ( t ) with a 1 ms resolution using the unifie d flow mo del o f Beskok and Kar niadakis (BK- mo del)[10, 17, 18] and a lo cal K n -num b er for each flow segment, K n l = K n (( p i + p o ) / 2): ˙ n BK = π r 4 c ( p 2 o − p 2 i ) 16 l c k B T 1 + α K n l µ ( T ) 1 + 4 K n l 1 − b K n l . (2) Eq. 2 compris es a Hagen-Poiseuille term, a term which treats the transition of the tra nspo rt co efficien t from contin uum-lik e, i.e. the bare dynamic vis c osity µ ( T ), to the KD transp ort co efficient, D He c with α = 2 . 716 / π tan − 1 ( α 1 K n β ), and a g eneralized velo city slip term, whic h is second-o rder accurate in K n in the slip and early transition flow regimes ( K n < 0 . 5). The mo del captures for K n → 0 the no-slip Hage n- Poiseuille limit, whereas it tra nsforms to Eq. 1 for K n ≫ 1. As v eri- fied b y compariso n of the BK-mo del with Direct Sim ula- tion Monte Carlo and solutions o f the B oltzmann equa- tion, a c hoice of b = − 1 for the s lip parameter res ults in the cor rect velo city pro file and flowrate, as w ell as a prop er pre ssure and shear s tress distributio n in a wide K n -rang e, including the transition flow reg ime. After optimizing the free para meters in Eq. 2, α 1 and β , we a r- rive at the p ( t )- and τ ( K n c )-curves depicted in Fig. 1 (a) and (c), res p. The g o od agre e ment o f the BK-mo del pre- dictions with our measurements is evident a nd the ex- tracted para meters α 1 = 10 ± 0 . 2 and β = 0 . 5 ± 0 . 05 ( D He c = 0 . 4 12 ± 0 . 06 m 2 /s) ag ree with BK-mo delling of He gas flow a s a function of rarefaction [10, 1 9]. An anal- ogous analysis for Ar ga s flow yields α 1 = 1 . 5 5 ± 0 . 0 5 and β = 0 . 1 ± 0 . 02 ( D Ar c = 0 . 1 3 4 ± 0 . 02 m 2 /s). FIG. 2: (color online) Pressure relaxation time τ for He (cir- cles) and Ar (triangles) measured with built-in SiNC mem- brane at T = 297 K versus Knudsen number in the SiNCs K n (b ottom axis) and in th e capillaries K n c (top axis). The lines represent calculated τ ( K n )-curves. Inset: T EM cross section of a SiN C in comparison with a circular c hannel p erimeter of 12 nm diameter (dashed line). The SiNC’s p erimeter is highligh ted by a line. Having achiev ed a detailed understanding of the in trin- sic flow characteristics o f our apparatus, we can now turn to mea surements with the SiNC mem brane. The mem- brane is ep oxy-sealed in a copp er ring [14] and sp ecial at- ten tion is paid to a careful deter mination o f the a ccessible mem brane area , A = 0 . 79 ± 0 . 0 16 cm 2 in order to allow for a reliable deter mination o f the num ber of SiNCs in- serted into the flow path, N = Φ · A = (1 1 . 8 ± 1) · 10 10 . As exp ected the pressure equilibration is significantly slow ed down after insta lling the mem brane - co mpa re pa nel (a ) and (b) in Fig. 1. Cho osing selected p s within the rang e 0.005 mb ar to 100 mbar, which corres p onds to a v ariation of K n in the SiNCs from 1 0 2 to 1 0 7 , we find an increa s e in τ of ∼ 17 0 s, when compared to the empty cell mea- surements - see Fig. 1 (c). F rom the ba re offset in τ for K n c > 1, w e could ca lculate D He in the SiNCs. W e are, how ev er, interested in the D He behavior in a wide K n - range, therefo r e w e modify our flow mo del b y inserting a segment with KD transp ort mechanism characteristic of N tubular channels with d = 12 nm and L = 200 µ m in betw een the ca pillary flo w segments. Adjusting the single fr ee para meter in our simulation, the v a lue of the He diffusion co efficien t D He in a s ingle SiNC, we ar rive at the p ( t )- and τ ( K n )-curves presented as solid lines in Fig. 1 (b) a nd (c), resp. The a greement with our mea- surement is excellent and the mo del yields a K n inde- pendent D He = 3 . 76 ± 0 . 8 mm 2 /s. It is worth while to compare this v a lue with Knudsen’s prediction for D . In his seminal pa per he derives a n ex- pression for D with tw o contributions, a factor G , charac- teristic of the KD effectivity of the channel’s shap e, and a factor solely determined by the mean therma l velocity of the pa rticles v given by the kinetic theory of gase s , D = 1 3 G v = 1 3 G r 8 k B T π m . (3) Int erestingly , by an ana lysis of the num ber of particles crossing a given section of a c hannel in unit time a fter completely diffuse reflection fro m an arbitrar y element of wall surfa c e and while assuming an equal c o llision a cces- sibility o f a ll surface e lemen ts, K nudsen derived an ana- lytical expression for G for a channel of arbitr ary shape. Knudsen’s second assumption is, how ever, only strictly v alid for circ ula r channel cross -sections, as p oint ed out by v. Smolucho wski [1] and elab orated for fracta l por e wall mor pho logies b y Co ppens and F romen t [5]. Given the roughly cir cular SiNCs’ cross section sha pes, we nev- ertheless resort to Knudsen’s formula, here quo ted nor- malized to the KD for m factor for a p erfect cy linder: 1 G = 1 4 L Z L 0 o ( l ) A ( l ) dl . (4) The integral in E q. 4 depends on the r atio of per imeter length o ( l ) a nd cro ss sectional are a A ( l ) along the chan- nel’s long axis dire c tion l , only . This ratio is optimized by a circle, acco rdingly the most effective KD c hannel shap e is a cylinder, provided one calls for a fixed A along the channel. E q . 4 yields due to our nor malization just G = d and we would ex pect a D He of 5 mm 2 /s for He KD in a SiNC, if it were a cylindrical channel of d = 12 nm. A v alue which is ∼ 30% la rger than our mea sured one. If one recalls the TEM pictures, which clearly indicate non-circular cross- sections this finding is no t surprising. In fact these pictures deliver pr ecisely the information needed for an estimation of the influence of the SiNC’s irregula r ities on the KD dynamics . W e determine the ra- tio o/ A o f 20 SiNC cross sections , a nd therefrom v alues of G . The v alues of the SiNC in Fig. 1 (top), (bo ttom) and Fig. 2 corresp onds to G s of 9.1 nm, 10.3 nm, and 10.6 nm, resp. T acitly assuming that the irregularities exhibited on the p erimeter are of similar t ype as a long the c hannel’s long axis we take an ensem ble average ov er the 20 G v alues a nd ar rive a t a mean G o f 9 .9 nm, which yields a D He of 4 . 1 mm 2 /s, a v alue which ag rees within the error ma rgins with our measured o ne. T o further e x plore the KD transp ort dynamics in the SiNCs we now fo cus on the m a nd T depe ndenc y of D . In Fig. 2 the τ ( K n ) curve r e corded for Ar and He at T = 2 97 K a r e pr esent ed. Bo th exhibit a simila r form, the o ne of Ar is, how ever, shifted up ma rkedly tow ards larger τ . Our co mputer mo del can quantita- tively account for this slow ed-down dynamics by a fac- tor 2 . 97 ± 0 . 25 de c r ease in D as compar ed to the He measurements, which confir ms the prediction of Eq. 3, D He /D Ar = p m Ar /m He = 3 . 16 . F or the explo ration o f the T b ehavior we c ho ose aga in He as working fluid due to its negligible physisorption tendency , even at low T . W e per form mea surements a t selected T s from 297 K down to 40 K, shown in Fig. 3. W e a g ain p erfor m computer ca lc u- lations assuming KD in the SiNC a rray sup erimpo sed to the transp ort in the s upply capillaries, presented as lines in Fig. 3, and optimize the s ingle free pa rameter D ( T ) in order to matc h the observed τ ( K n, T ) b ehavior. Despite unresolv able devia tions a t la rger K n c and decreas ing T , which we attribute to thermal creep effects, c hara cteristic of T gr adient s a long the flow path [10], we find, in ag ree- men t with the exp eriment, increa singly fas ter dynamics with decreasing T . Note, this counter-in tuitiv e finding for a diffusion pro cess r esults from the 1 /T scaling in Eq. 1, which reflects the T - dependency o f the particle nu mber density in gas flows. By contrast, the D He ( T ), determined by our s imulations, scales in ex cellen t agree- men t with √ T , see ins et in Fig. 3, c onfirming Knudsen’s classic result down to the low est T inv estigated. FIG. 3: (color online) Pressure relaxation time τ for He gas flow through SiNC membrane ( sym b ols) an d sim ulated τ (Kn) (lines) versus Knudsen num b er in the SiNC mem brane K n (b ottom axis) and in the supply capillari es K n c (top axis) at selected temp eratures T . Inset: He diffusion coefficient D He in SiNCs in comparison with th e √ T prediction of Eq. 3 (line) plotted versus √ T . W e find no hints of ano malous fas t KD her e, as was r e- cently rep orted for a bundle o f linear carb on nanotub es [7] and explained b y an highly increased fra ction of sp ec- ularly r eflected par ticles up on wall collisions [1]. The a l- tered collisio n statistics was attributed to the crysta lline structure a nd the a to mical smo othness of the nanotub e walls. The SiNC walls are als o crystalline, howev er, not atomical flat, as ca n b e seen from our T E M analys is . Along with the for mation of a native oxide lay er, t ypical of Si sur faces, which renders the near surface structure amorphous, silica like, this, pre sumably , acco unts for the normal KD obser v ed her e c o n trasting the one found for the graphitic walls of carb on nanotub es. W e pr esented here the first deta ile d study of ga s trans- po rt in linear SiNCs. Our co nclusions are dr awn from a correct treatment of gas flow over 10 o rders of magnitude in gas ra refaction, which is, to the best o f our knowledge, the larg est K n range ever explored exp erimentally . The characteristic properties of KD, a n indep endency o f D on K n , its scaling pr edictions on m , T , a nd on details of the channel’s s tructure, r esolved with sub-nm resolution, are clea rly exhibited b y our measurements. W e thank A. Beskok for helpful discussions and the German Resea rch F oundation (DF G) for suppo rt within the priority progr am 1164, Nano- & Micr ofluidics (Hu 850/2 ). ∗ E-mail: p .h ub er@physik.uni-saarland.de [1] M. K n udsen, A nn. Phys. (Leipzig) 333 , 75 (1909), M. v. Smolucho wski, ibid. 338 , 1559 (1910). [2] J. K ¨ arger and D. Ruthven, Diffusion in Ze olites and Mi- cr op or ous Solids (Wiley & Sons, New Y ork , 1992), S. M. Auerbach, Int. Rev. Phys. Chem. 19 , 155 (2000). [3] D. W allac her et al. , Phys. R ev. Lett. 92 , 195704 (2004). [4] P . Hub er and K. Kn orr, Ph ys. Rev. B 60 , 12657 (1999); R. P aul and H. Rieger, J. Chem. Phys. 123 , 024708 (2005); R. V aliullin et al. , Natu re 443 , 965 (2006). [5] M. O. Coppen s and G. F. F roment, F ractals 3 , 807 (1995); A.I. Skoulidas et al. , Phys. Rev . Lett. 89 , 185901 (2002); G. Arya, H .C. Chang, and E.J. Maginn, ibid. 91 , 026102 (2003); S. Russ et al. , Phys. Rev. E 72 , 030101(R) (2005). [6] B. J. Hinds et al. , Science 303 , 62 (2004). [7] J. K. Holt et al. , Science 312 , 1034 (2006). [8] S. Roy et al. , J. Appl. Phys. 93 , 4870 (2003); K.J. Alvine et al. . Phys. Rev. Lett. 97 , 175503 (2006). [9] C.C. Striemer et al. , Nature 445 , 749 (2007). [10] G. Karniadakis, A. Beskok, and N. Aluru, Micr oflows and Nanoflows (S pringer, 2005). [11] H.A. Stone, A.D. S troo ck, an d A. A jdari, An n . Rev. Fluid Mech. 36 , 381 (2004); P . Hub er et al. , Eu r. Phys. J. Sp ec. T op. 141 , 101 (2007); M. Whitby and N. Quirke, Nature Nanotechnology 2 , 87 (2007). [12] V. Lehmann and U. G¨ osele, Appl. Phys. Lett. 58 , 856 (1991); V. Lehmann, R . Sten gl, and A. Luigart, Mat. Sc. Eng. B 69-70 , 11 (2000). [13] A. Henschel et al. , Phys. Rev . E 75 , 021607 (2007); P . Kumar et al. , J. Appl. Phys. 103 , 024303 (2008). [14] See EP APS Do cument No. E-PRL T AO-100-019 807 for a raytracing illustration of t he gas flow appa- ratus emplo yed for the membrane p ermeation mea- surements. F or more information on EP APS, see http://w ww.aip.org/pubservs/epaps.h tml . [15] F. M. Sharip ov and V. D. Seleznev, J. V ac. Sc. T ec hnol. A 12 , 2933 (1994). [16] P . T ab eling Intr o duction to Micr ofluidi cs (O xford Uni- versi ty Press, New Y ork, 2005). [17] A. Beskok and G. Karniadakis, Nanosc. Microsc. Ther- mophys. Eng. 3 , 43 (1999). [18] S. Gr¨ uner, Diploma th esis, Saarland Universit y (2006). [19] S. Tison, V acuum 44 , 1171 (1993).
Original Paper
Loading high-quality paper...
Comments & Academic Discussion
Loading comments...
Leave a Comment