"Why Should I Trust You?": Explaining the Predictions of Any Classifier
Despite widespread adoption, machine learning models remain mostly black boxes. Understanding the reasons behind predictions is, however, quite important in assessing trust, which is fundamental if one plans to take action based on a prediction, or w…
Authors: Marco Tulio Ribeiro, Sameer Singh, Carlos Guestrin
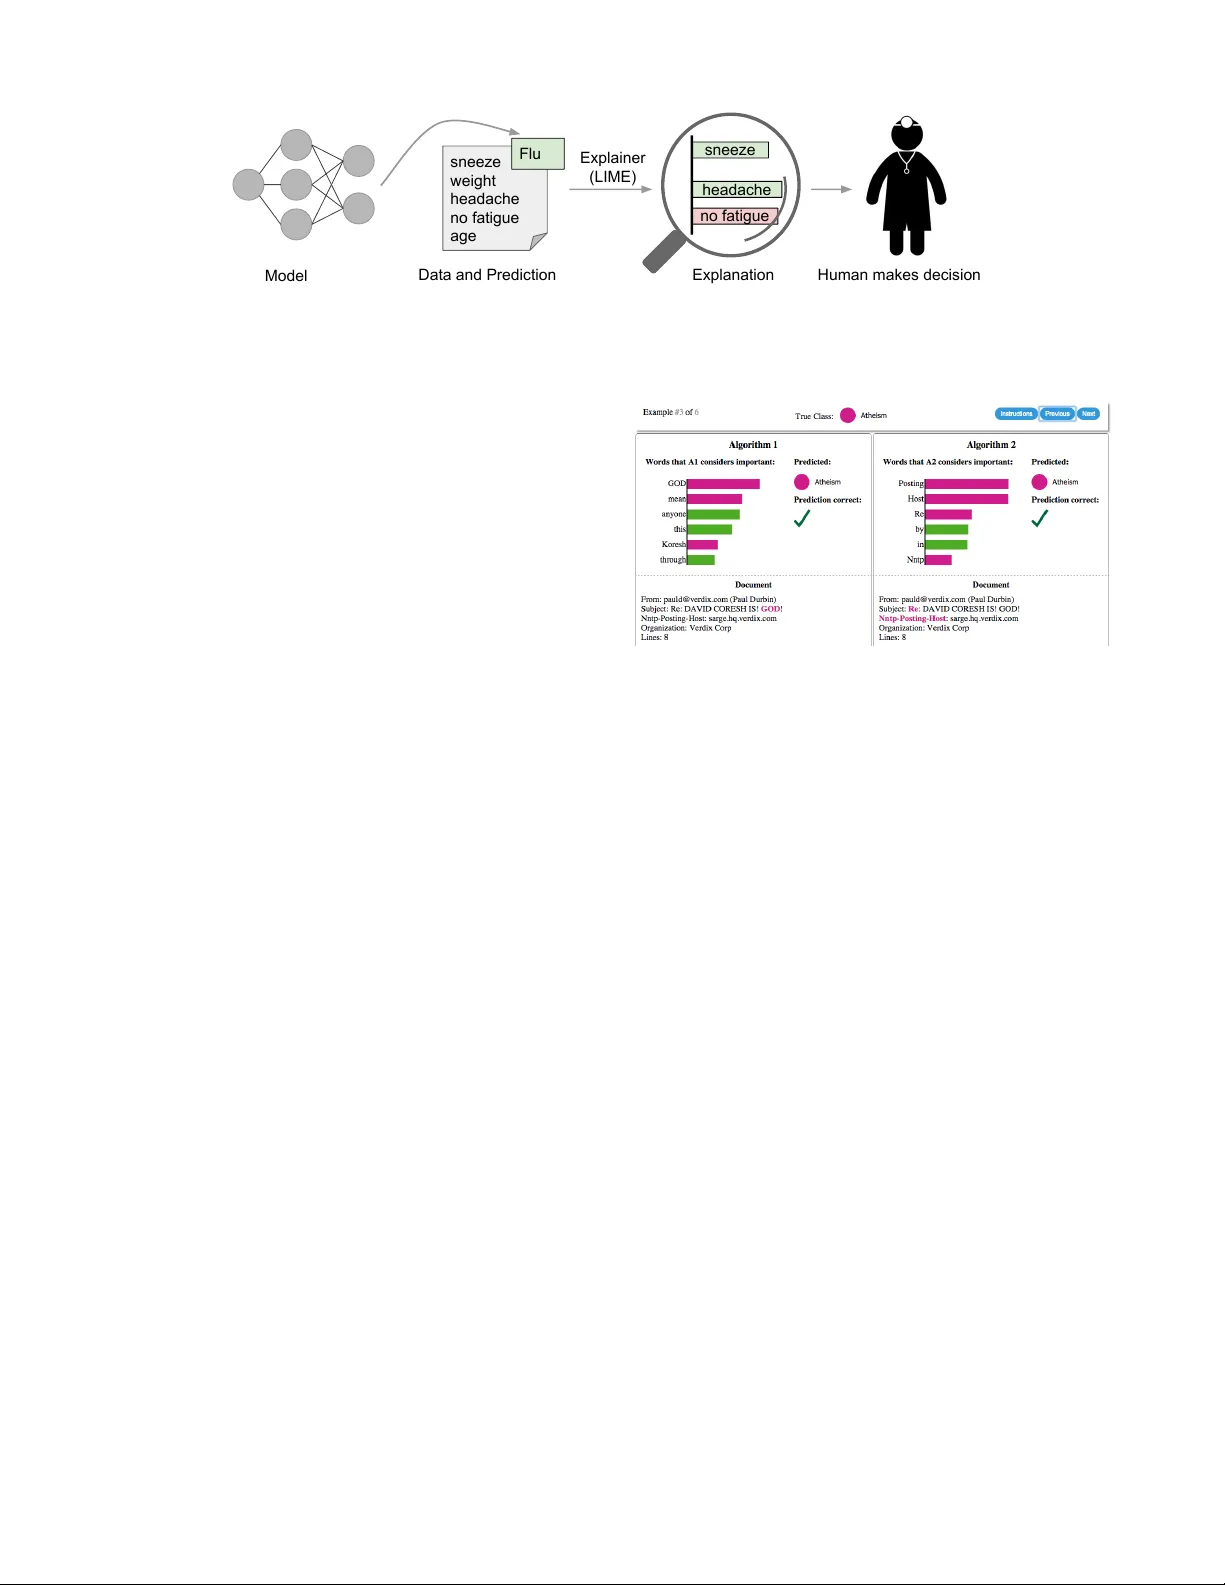
“Wh y Should I T rust Y ou?” Explaining the Predictions of An y Classifier Marco T ulio Ribeiro University of Washington Seattle, W A 98105, USA marcotcr@cs.uw .edu Sameer Singh University of Washington Seattle, W A 98105, USA sameer@cs.uw .edu Carlos Guestr in University of Washington Seattle, W A 98105, USA guestrin@cs.uw .edu ABSTRA CT Despite widespread adoption, mac hine learning mo dels re- main mostly black b o xes. Understanding the reasons b ehind predictions is, how ever, quite imp ortan t in assessing trust , whic h is fundamental if one plans to tak e action based on a prediction, or when c ho osing whether to deploy a new model. Suc h understanding also provid es insigh ts int o the mo del, whic h can b e used to transform an un trustw orth y mo del or prediction into a trust w orthy one. In this work, w e prop ose LIME, a no v el explanation tech- nique that explains the predictions of any classifier in an in- terpretable and faithful manner, b y learning an in terpretable model lo cally around the prediction. W e also prop ose a method to explain mo dels by presen ting representativ e indi- vidual predictions and their explanations in a non-redundan t w ay , framing the task as a submodular optimization prob- lem. W e demonstrate the flexibility of these metho ds b y explaining different mo dels for text (e.g. random forests) and image classification (e.g. neural net works). W e sho w the utilit y of explanations via nov el experiments, both simulated and with human sub jects, on v arious scenarios that require trust: deciding if one should trust a prediction, choosing betw een mo dels, improving an un trust worth y classifier, and iden tifying why a classifier should not b e trusted. 1. INTR ODUCTION Mac hine learning is at the core of many recen t adv ances in science and technology . Unfortunately , the imp ortant role of humans is an oft-o verlooked aspect in the field. Whether h umans are directly using mac hine learning class ifiers a s tools, or are deplo ying models within other pro ducts, a vital concern remains: if the users do not trust a mo del or a pr e diction, they wil l not use it . It is imp ortan t to differentiate betw een t wo differen t (but related) definitions of trust: (1) trusting a pr e diction , i.e. whether a user trusts an individual prediction sufficien tly to tak e some action based on it, and (2) trusting a mo del , i.e. whether the user trusts a mo del to b eha ve in reasonable wa ys if deploy ed. Both are directly impacted by Permission to make digital or hard copies of all or part of this work for personal or classroom use is granted without fee provided that copies are not made or distributed for profit or commercial advantage and that copies bear this notice and the full citation on the first page. Copyrights for components of this work owned by others than the author(s) must be honored. Abstracting with credit is permitted. T o copy otherwise, or republish, to post on servers or to redistribute to lists, requires prior specific permission and /or a fee. Request permissions from permissions@acm.org. KDD 2016 San F rancisco, CA, USA c 2016 Copyright held by the owner/author(s). Publication rights licensed to A CM. ISBN 978-1-4503-4232-2/16/08. . . $15.00 DOI: http://dx .doi.org/10.1145/2939672.2939778 ho w muc h the h uman understands a mo del’s b eha viour, as opposed to seeing it as a blac k b o x. Determining trust in individual predictions is an important problem when the model is used for decision making. When using machine learning for medical diagnosis [ 6 ] or terrorism detection, for example, predictions cannot b e acted up on on blind faith, as the consequences ma y b e catastrophic. Apart from trusting individual predictions, there is also a need to ev aluate the model as a whole before deplo ying it “in the wild” . T o mak e this decision, users need to be confiden t that the mo del will perform w ell on real-w orld data, according to the metrics of interest. Curren tly , mo dels are ev aluated using accuracy metrics on an av ailable v alidation dataset. Ho wev er, real-w orld data is often significantly differen t, and further, the ev aluation metric may not b e indicativ e of the product’s goal. Insp ecting individual predictions and their explanations is a worth while solution, in addition to suc h metrics. In thi s case, it is importan t to aid users by suggesting whic h instances to inspect, esp ecially for large datasets. In this pap er, we propose providing explanations for indi- vidual predictions as a solution to the “trusting a prediction” problem, and selecting m ultiple such predictions (and expla- nations) as a solution to the “trusting the mo del” problem. Our main contributions are summarized as follows. • LIME, an algorithm that can explain the predictions of any classifier or regressor in a faithful w ay , by appro ximating it lo cally with an interpretable model. • SP-LIME, a metho d that selects a set of represen tative instances with explanations to address the “trusting the model” problem, via submodular optimization. • Comprehensiv e ev aluation with simu lated and h uman sub- jects, where we measure the impact of explanations on trust and asso ciated tasks. In our experiments, non-experts using LIME are able to pic k which classifier from a pair generalizes better in the real world. F urther, they are able to greatly improv e an untrust worth y classifier trained on 20 newsgroups, by doing feature engineering using LIME. W e also sho w how understanding the predictions of a neu- ral netw ork on images helps practitioners know when and wh y they should not trust a mo del. 2. THE CASE FOR EXPLANA TIONS By “explaining a prediction” , w e mean presen ting textual or visual artifacts that pro vide qualitative understanding of the relationship b et ween the instance’s comp onents (e.g. wo rds in text, patches in an image) and the model’s prediction. W e argue that explaining predictions is an important aspect in sneeze weight headache no fatigue age Flu sneeze headache Model Data and Prediction Explainer (LIME) Explanation Explainer (LIME) Human makes decision Explanation no fatigue sneeze headache active Human makes decision Figure 1: Explaining individual predictions. A model predicts that a patien t has the flu, and LIME highligh ts the symptoms in the patient’s history that led to the prediction. Sneeze and headache are p ortra yed as con tributing to the “flu” prediction, while “no fatigue” is evidence against it. With these, a do ctor can make an informed decision ab out whether to trust the mo del’s prediction. getting h umans to trust and use mac hine learning effectively , if the explanations are faithful and in telligible. The pro cess of explaining individual predictions is illus- trated in Figure 1. It is clear that a do ctor is muc h b etter positioned to make a decision with the help of a mo del if in telligible explanations are provided. In this case, an ex- planation is a small list of symptoms with relativ e weigh ts – symptoms that either con tribute to the prediction (in green) or are evidence against it (in red). Humans usually hav e prior kno wledge about the application domain, which they can use to accept (trust) or reject a prediction if they understand the reasoning b ehind it. It has been observ ed, for example, that pro viding explanations can increase the acceptance of mo vie recommendations [12] and other automated systems [8]. Ev ery machine learning application also requires a certain measure of ov erall trust in the model. Dev elopment and ev aluation of a classification mo del often consists of collect- ing annotated data, of which a held-out subset is used for automated ev aluation. Although this is a useful pip eline for man y applications, ev aluation on v alidation data ma y not correspond to p erformance “in the wild” , as practitioners often ov erestimate the accuracy of their mo dels [ 20 ], and th us trust cannot rely solely on it. Looking at examples offers an alternative method to assess truth in the mo del, especially if the examples are explained. W e thus prop ose explaining several represen tative individual predictions of a model as a wa y to provi de a global understanding. There are several wa ys a model or its ev aluation can go wrong. Data leak age, for example, defined as the uninten- tional leak age of signal into the training (and v alidation) data that would not app ear when deploy ed [ 14 ], p oten tially increases accuracy . A challenging example cited by Kauf- man et al. [14] is one where the patien t ID was found to b e hea vily correlated with the target class in the training and v alidation data. This issue w ould b e incredibly challengin g to identify just by observing the predictions and the ra w data, but muc h easier if explanations such as the one in Figure 1 are provided, as patient ID would be listed as an explanation for predictions. Another particularly hard to detect problem is dataset shift [ 5 ], where training data is differen t than test data (we giv e an example in the famous 20 newsgroups dataset later on). The insights given b y expla- nations are particularly helpful in iden tifying what must b e done to conv ert an un trustw orthy model into a trustw orthy one – for example, removin g leaked data or c hanging the training data to av oid dataset shift. Mac hine learning practitioners often ha ve to select a model from a num b er of alternatives, requiring them to assess the relative trust b et ween tw o or more mo dels. In Figure Figure 2: Explaining individual predictions of com- p eting classifiers trying to determine if a do cumen t is ab out “Christianity” or “Atheis m” . The bar c hart represen ts the imp ortance given to the most rele- v an t wor ds, also highligh ted in the text. Color indi- cates whic h class the word contributes to (green for “Christianit y” , magen ta for “Atheism” ). 2, we show ho w individual prediction explanations can be used to select b et ween models, in conjunction with accuracy . In this case, the algorithm with higher accuracy on the v alidation set is actually muc h w orse, a fact that is easy to see when explanations are provided (again, due to human prior kno wledge), but hard otherwise. F urther, there is frequently a mismatc h b et ween the metrics that w e can compute and optimize (e.g. accuracy) and the actual metrics of in terest suc h as user engagement and reten tion. While we ma y not be able to measure such metrics, w e ha ve kno wledge ab out ho w certain mo del b ehaviors can influence them. Therefore, a practitioner may wish to choose a less accurate model for con tent recommendation that does not place high importance in features related to “clickbait” articles (which may hurt user retention), even if exploiting such features increases the accuracy of the mo del in cross v alidation. W e note that explanations are particularly useful in these (and other) scenarios if a metho d can pro duce them for any mo del, so that a v ariety of mo dels can b e compared. Desir ed Characteristics for Explainers W e now outline a num b er of desired characteri stics from explanation methods. An essential criterion for explanations is that they m ust be in terpretable , i.e., provide qualitative understanding betw een the input v ariables and the resp onse. W e note that in terpretability must tak e into accoun t the user’s limitations. Th us, a linear model [ 24 ], a gradient vector [ 2 ] or an additiv e model [ 6 ] may or ma y not b e interpretable. F or example, if h undreds or thousands of features significantly con tribute to a prediction, it is not reasonable to exp ect any user to comprehend wh y the prediction w as made, even if individual w eights can be inspected. This requirement further implies that explanations should b e easy to understand, which is not necessarily true of the features used by the mo del, and th us the “input v ariables” in the explanations ma y need to b e differen t than the features. Finally , w e note that the notion of in terpretabilit y also dep ends on the target au dience. Mac hine learning practitioners ma y b e able to in terpret small Ba yesian net works, but la ymen ma y be more comfortable with a small n umber of weigh ted features as an explanation. Another essen tial criterion is lo cal fidelity . Although it is often imp ossible for an explanation to b e completely faithful unless it is the complete description of the mo del itself, for an explanation to be meaningful it m ust at least b e lo c al ly faithful , i.e. it must corresp ond to how the mo del behav es in the vicinity of the instance b eing predicted. W e note that local fidelity does not imply global fidelit y: features that are globally imp ortant ma y not be imp ortan t in the lo cal con text, and vice versa. While global fidelity would imply local fidelit y , identifying globally faithful explanations that are interpretable remains a c hallenge for complex models. While there are mo dels that are inheren tly interpretable [ 6 , 17 , 26 , 27 ], an explainer should b e able to explain any mo del, and thus b e mo del-agnostic (i.e. treat the original mo del as a black b ox). Apa rt from the fact that many state-of- the-art classifiers are not currently interpretable, this also pro vides flexibility to explain future classifiers. In addition to explaining predictions, providing a global p erspective is imp ortan t to ascertain trust in the mo del. As mention ed b efore, accuracy may often not be a suitable metric to ev aluate the mo del, and thus we wa nt to explain the mod el . Building up on the explanations for individual predictions, we select a few explanations to present to the user, such that they are representativ e of the mo del. 3. LOCAL INTERPRET ABLE MODEL-A GNOSTIC EXPLANA TIONS W e no w presen t Local In terpretable Model-agnostic Expla- nations ( LIME ). The ov erall goal of LIME is to identify an in terpretable model o ver the interpr etable r epr esentation that is lo cally faithful to the classifier. 3.1 Interpr etable Data Representations Before we present the explanation system, it is imp or- tan t to distinguish b etw een features and int erpretable data represen tations. As mentioned before, in terpretable expla- nations need to use a represen tation that is understandable to humans, regardless of the actual features used by the model. F or example, a p ossible interpr etable r epr esentation for text classification is a binary vector indicating the pres- ence or absence of a word, even though the classifier may use more complex (and incomprehensible) features such as w ord em b eddings. Likewise for image classification, an in- terpr etable r epr esentation may be a binary vector indicating the “presence” or “absenc e” of a contiguous patc h of similar pixels (a sup er-pixel), while the classifier ma y represent the image as a tensor with three color c hannels per pixel. W e denote x ∈ R d be the original represen tation of an instance being explained, and we use x 0 ∈ { 0 , 1 } d 0 to denote a binary v ector for its in terpretable representation. 3.2 Fidelity-Interpr etability T rade-off F ormally , we define an explanation as a mo del g ∈ G , where G is a class of p otentially interpr etable mo dels, suc h as linear models, decision trees, or falling rule lists [ 27 ], i.e. a model g ∈ G can b e readily presented to the user with visual or textual artifacts. The domain of g is { 0 , 1 } d 0 , i.e. g acts o ver absence/presence of the interpr etable c omp onents . As not every g ∈ G ma y b e simple enough to be in terpretable - th us we let Ω( g ) b e a measure of c omplexity (as opp osed to interpr etability ) of the explanation g ∈ G . F or example, for decision trees Ω( g ) ma y b e the depth of the tree, while for linear mo dels, Ω( g ) may be the num b er of non-zero weigh ts. Let the mo del b eing explained b e denoted f : R d → R . In classification, f ( x ) is the probabilit y (or a binary indicator) that x b elongs to a certain class 1 . W e further use π x ( z ) as a pro ximity measure betw een an instance z to x , so as to define locality around x . Finally , let L ( f , g , π x ) b e a measure of ho w unfaithful g is in approximating f in the lo calit y defined b y π x . In order to ensure b oth in terpretabilit y and lo cal fidelit y , we m ust minimize L ( f , g , π x ) while having Ω( g ) b e lo w enough to b e interpretable b y humans. The explanation produced b y LIME is obtained by the follo wing: ξ ( x ) = argmin g ∈ G L ( f , g , π x ) + Ω( g ) (1) This form ulation can be used with different explanation families G , fidelity functions L , and complexit y measures Ω. Here we focus on sparse linear models as explanations, and on p erforming the search using perturbations. 3.3 Sampling f or Local Exploration W e w ant to minimize the lo cality-a ware loss L ( f , g , π x ) without making an y assumptions ab out f , since we wan t the explainer to b e mo del-agnostic . Th us, in order to learn the lo cal behavior of f as the interpretable inputs v ary , w e appro ximate L ( f , g , π x ) by drawing samples, weig hted by π x . W e sample instances around x 0 b y drawing nonzero elemen ts of x 0 uniformly at random (where the num b er of suc h draws is also uniformly sampled). Giv en a perturb ed sample z 0 ∈ { 0 , 1 } d 0 (whic h contains a fraction of the nonzero elemen ts of x 0 ), we reco ver the sample in the original repre- sen tation z ∈ R d and obtain f ( z ), whic h is used as a lab el for the explanation mo del. Given this dataset Z of p erturbed samples with the asso ciated labels, we optimize Eq. (1) to get an explanation ξ ( x ). The primary in tuition b ehind LIME is presen ted in Figure 3, where we sample instances b oth in the vicinit y of x (which hav e a high weigh t due to π x ) and far aw ay from x (low w eight from π x ). Ev en though the original model ma y b e too complex to explain globally , LIME presents an explanation that is lo cally faithful (linear in this case), where the locality is captured b y π x . It is worth noting that our metho d is fairly robust to sampling noise since the samples are weigh ted b y π x in Eq. (1) . W e now presen t a concrete instance of this general framework. 3.4 Sparse Linear Explanations F or the rest of this paper, we let G b e the class of linear models, suc h that g ( z 0 ) = w g · z 0 . W e use the lo cally weig hted square loss as L , as defined in Eq. (2) , where w e let π x ( z ) = exp ( − D ( x, z ) 2 /σ 2 ) be an exp onential kernel defined on some 1 F or multiple classes, we explain eac h class separately , th us f ( x ) is the prediction of the relev ant class. Figure 3: T oy example to present intu ition for LIME. The blac k-b o x mo del’s complex decision function f (unkno wn to LIME) is represen ted by the blue/pink bac kground, which cannot b e approximated well b y a linear mo del. The b old red cross is the instance b eing explained. LIME samples instances, gets pre- dictions using f , and weighs them by the proximit y to the instance being explained (represen ted here b y size). The dashed line is the learned explanation that is lo cally (but not globally) faithful. distance function D (e.g. cosine distance for text, L 2 distance for images) with width σ . L ( f , g , π x ) = X z,z 0 ∈Z π x ( z ) f ( z ) − g ( z 0 ) 2 (2) F or text classification, w e ensure that the explanation is in terpretable b y letting the interpr etable r epr esentation b e a bag of words, and b y setting a limit K on the num b er of w ords, i.e. Ω( g ) = ∞ 1 [ k w g k 0 > K ]. P otentially , K can be adapted to b e as big as the user can handle, or we could ha ve differen t v alues of K for different instances. In this paper w e use a constant v alue for K , lea ving the exploration of different v alues to future work. W e use the same Ω for image classification, using “super-pixels” (computed using an y standard algorithm) instead of words, suc h that the in terpretable representation of an image is a binary vector where 1 indicates the original sup er-pixel and 0 indicates a gra yed out sup er-pixel. This particular choic e of Ω mak es directly solving Eq. (1) in tractable, but w e approximate it by first selecting K features with Lasso (using the regularization path [ 9 ]) and then learning the w eights via least squares (a procedure we call K-LASSO in Algorithm 1). Since Algo- rithm 1 produces an explanation for an individual prediction, its complexit y do es not depend on the size of the dataset, but instead on time to compute f ( x ) and on the n umber of samples N . In practice, explaining random forests with 1000 trees using scikit-learn (http://scikit - learn.org ) on a laptop with N = 5000 tak es under 3 seconds without an y optimizations such as using gpus or parallelization. Explain- ing each prediction of the Inception netw ork [ 25 ] for image classification tak es around 10 min utes. An y choic e of interpretable representations and G will ha ve some inheren t drawbac ks. First, while the underlying model can b e treated as a blac k-box, certain in terpretable represen tations will not be pow erful enough to explain certain behaviors. F or example, a mo del that predicts sepia-toned images to b e r etr o cannot b e explained b y presence of absence of super pixels. Second, our c hoice of G (sparse linear mo dels) means that if the underlying model is highly non-linear even in the lo cality of the prediction, there may not b e a faithful explanation. How ever, we can estimate the faithfulness of Algorithm 1 Sparse Linear Explanations using LIME Require: Classifier f , Number of samples N Require: Instance x , and its in terpretable version x 0 Require: Similarit y kernel π x , Length of explanation K Z ← {} for i ∈ { 1 , 2 , 3 , ..., N } do z 0 i ← sample ar ound ( x 0 ) Z ← Z ∪ h z 0 i , f ( z i ) , π x ( z i ) i end for w ← K-Lasso( Z , K ) with z 0 i as features, f ( z ) as target return w the explanation on Z , and present this information to the user. This estimate of faithfulness can also be used for selecting an appropriate family of explanations from a set of m ultiple interpretable mo del classes, thus adapting to the giv en dataset and the classifier. W e leav e suc h exploration for future w ork, as linear explanations work quite well for m ultiple black-box models in our exp erimen ts. 3.5 Example 1: T ext classification with SVMs In Figure 2 (right side), we explain the predictions of a support vecto r machine with RBF kernel trained on uni- grams to differen tiate “Christianity” from “Atheism” (on a subset of the 20 newsgroup dataset). Although this classifier ac hieves 94% held-out accuracy , and one w ould b e tempted to trust it based on this, the explanation for an instance sho ws that predictions are made for quite arbitrary reasons (w ords “P osting” , “Host” , and “Re” ha ve no connection to either Christianit y or Atheism) . The w ord “Posting” app ears in 22% of examples in the training set, 99% of them in the class “A theism” . Even if headers are remov ed, proper names of prolific p osters in the original newsgroups are selected by the classifier, which w ould also not generalize. After getting suc h insigh ts from explanations, it is clear that this dataset has serious issues (which are not evident just by studying the raw data or predictions), and that this classifier, or held-out ev aluation, cannot b e trusted. It is also clear what the problems are, and the steps that can b e tak en to fix these issues and train a more trustw orthy classifier. 3.6 Example 2: Deep networks f or images When using sparse linear explanations for image classifiers, one may wish to just highlight the sup er-pixels with p osi- tiv e weigh t tow ards a sp ecific class, as they giv e intuition as to why the mo del would think that class may b e present . W e explain the prediction of Go ogle’s pre-trained Inception neural netw ork [ 25 ] in this fashion on an arbitrary image (Figure 4a). Figures 4b, 4c, 4d show the superpixels expla- nations for the top 3 predicted classes (with the rest of the image gray ed out), having set K = 10. What the neural net work pic ks up on for eac h of the classes is quite natural to h umans - Figure 4b in particular pro vides insigh t as to wh y acoustic guitar w as predicted to be electric: due to the fretboard. This kind of explanation enhances trust in the classifier (ev en if the top predicted class is wrong), as it sho ws that it is not acting in an unreasonable manner. (a) Original Image (b) Explaining Ele ctric guitar (c) Explaining A c oustic guitar (d) Explaining L abr ador Figure 4: Explaining an image classification prediction made b y Go ogle’s Inception neural net w ork. The top 3 classes predicted are “Electric Guitar” ( p = 0 . 32 ), “Acoustic guitar” ( p = 0 . 24 ) and “Labrador” ( p = 0 . 21 ) 4. SUBMODULAR PICK FOR EXPLAINING MODELS Although an explanation of a single prediction provides some understanding in to the reliability of the classifier to the user, it is not sufficient to ev aluate and assess trust in the model as a whole. W e prop ose to give a global understanding of the mo del by explaining a set of individual instances. This approac h is still model agnostic, and is complementary to computing summary statistics such as held-out accuracy . Ev en though explanations of multiple instances can b e insigh tful, these instances need to b e selected judiciously , since users ma y not hav e the time to examine a large n umber of explanations. W e represen t the time/patience that humans ha ve by a budget B that denotes the num b er of explanations they are willing to lo ok at in order to understand a model. Giv en a set of instances X , w e define the pic k step as the task of selecting B instances for the user to insp ect. The pick step is not dependent on the existence of explana- tions - one of the main purpose of to ols lik e Mo deltrac ker [ 1 ] and others [ 11 ] is to assist users in selecting instances them- selv es, and examining the raw data and prediction s. How ever, since lo oking at ra w data is not enough to understand predic- tions and get insigh ts, the pick step should take into accoun t the explanations that accompan y eac h prediction. Moreov er, this metho d should pic k a diverse, representativ e set of expla- nations to show the user – i.e. non-redundan t explanations that represent ho w the model behav es globally . Giv en the explanations for a set of instances X ( | X | = n ), w e construct an n × d 0 explanation matrix W that represen ts the lo cal imp ortance of the interpretable comp onents for eac h instance. When using linear mo dels as explanations, for an instance x i and explanation g i = ξ ( x i ), we set W ij = | w g ij | . F urther, for eac h comp onent (column) j in W , we let I j denote the glob al imp ortance of that comp onen t in the explanation space. In tuitively , we wan t I suc h that features that explain many different instances hav e higher importance scores. In Figure 5, we sho w a toy example W , with n = d 0 = 5, where W is binary (for simplicity). The importance function I should score feature f2 higher than feature f1, i.e. I 2 > I 1 , since feature f2 is used to explain more instances. Concretely for the text applications, we set I j = p P n i =1 W ij . F or images, I must measure something that is comparable across the sup er-pixels in different images, f1 f2 f3 f4 f5 Covered Features Figure 5: T o y example W . Ro ws represent in- stances (do cuments ) and columns represen t features (w ords). F eature f2 (dotted blue) has the highest im- p ortance. Ro ws 2 and 5 (in red) w ould b e selected b y the pick pro cedure, cov ering all but feature f1. Algorithm 2 Submo dular pic k (SP) algorithm Require: Instances X , Budget B for all x i ∈ X do W i ← explain ( x i , x 0 i ) Using Algorithm 1 end for for j ∈ { 1 . . . d 0 } do I j ← p P n i =1 |W ij | Compute feature imp ortances end for V ← {} while | V | < B do Greedy optimization of Eq (4) V ← V ∪ argmax i c ( V ∪ { i } , W , I ) end while return V suc h as color histograms or other features of sup er-pixels; w e lea ve further exploration of these ideas for future wo rk. While we w ant to pick instances that cov er the imp ortan t components, the set of explanations m ust not b e redundant in the comp onen ts they show the users, i.e. av oid selecting instances with similar explanations. In Figure 5, after the second row is pick ed, the third row adds no v alue, as the user has already seen features f2 and f3 - while the last row exposes the user to completely new features. Selecting the second and last ro w results in the cov erage of almost all the features. W e formalize this non-redundan t co verage intuition in Eq. (3) , where we define cov erage as the set function c that, given W and I , computes the total importance of the features that app ear in at least one instance in a set V . c ( V , W , I ) = d 0 X j =1 1 [ ∃ i ∈ V : W ij > 0] I j (3) The pick problem, defined in Eq. (4) , consists of finding the set V , | V | ≤ B that achiev es highest cov erage. P ick ( W , I ) = argmax V , | V |≤ B c ( V , W , I ) (4) The problem in Eq. (4) is maximizing a weig hted co verage function, and is NP-hard [ 10 ]. Let c ( V ∪ { i } , W , I ) − c ( V , W , I ) b e the marginal cov erage gain of adding an instance i to a set V . Due to submodularity , a greedy algorithm that iterativ ely adds the instance with the highest marginal cov erage gain to the solution offers a constant-factor appro ximation guarantee of 1 − 1 /e to the optim um [ 15 ]. W e outline this appro ximation in Algorithm 2, and call it submo dular pick . 5. SIMULA TED USER EXPERIMENTS In this section, we presen t simulated user exp erimen ts to ev aluate the utilit y of explanations in trust-related tasks. In particular, w e address the following questions: (1) Are the explanations faithful to the mo del, (2) Can the explanations aid users in ascertaining trust in predictions, and (3) Are the explanations useful for ev aluating the mo del as a whole. Code and data for replicating our experiments are av ailable at https://git hub.com/marcotcr/ lime- exp eriments. 5.1 Experiment Setup W e use t wo sen timent analysis datasets ( b o oks and DVDs , 2000 instances each) where the task is to classify pro d- uct reviews as p ositiv e or negative [ 4 ]. W e train decision trees ( DT ), logistic regression with L2 regularization ( LR ), nearest neighbors ( NN ), and supp ort vector mac hines with RBF kernel ( SVM ), all using bag of words as features. W e also include random forests (with 1000 trees) trained with the av erage w ord2vec em b edding [ 19 ] ( RF ), a model that is impossible to in terpret without a techni que like LIME. W e use the implementations and default parameters of scikit- learn, unless noted otherwise. W e divide each dataset in to train (1600 instances) and test (400 instances). T o explain individual predictions, we compare our pro- posed approach ( LIME ), with parzen [ 2 ], a method that appro ximates the black b o x classifier globally with P arzen windo ws, and explains individual predictions by taking the gradien t of the prediction probability function. F or parzen, w e take the K features with the highest absolute gradien ts as explanations. W e set the hyper-parameters for parzen and LIME using cross v alidation, and set N = 15 , 000. W e also compare against a greedy procedure (similar to Martens and Prov ost [18] ) in which we greedily remo ve features that con tribute the mo st to the predicted class until the prediction c hanges (or we reach the maximum of K features), and a random procedure that randomly picks K features as an explanation. W e set K to 10 for our exp erimen ts. F or exp eriments where the pick procedure a pplies, w e either do random selection (random pick, RP ) or the pro cedure described in § 4 (submo dular pick, SP ). W e refer to pick- explainer combin ations by adding RP or SP as a prefix. 5.2 Are explanations faithful to the model? W e measure faithfulness of explanations on classifiers that are by themselves interpretable (sparse logistic regression random parzen greedy LIME 0 25 50 75 100 Recall (%) 17.4 72.8 64.3 92.1 (a) Sparse LR random parzen greedy LIME 0 25 50 75 100 Recall (%) 20.6 78.9 37.0 97.0 (b) Decision T ree Figure 6: Recall on truly imp ortan t features for t wo in terpretable classifiers on the b o oks dataset. random parzen greedy LIME 0 25 50 75 100 Recall (%) 19.2 60.8 63.4 90.2 (a) Sparse LR random parzen greedy LIME 0 25 50 75 100 Recall (%) 17.4 80.6 47.6 97.8 (b) Decision T ree Figure 7: Recall on truly imp ortan t features for t wo in terpretable classifiers on the DVDs dataset. and decision trees). In particular, we train b oth classifiers suc h that the maximum n um b er of features they use for any instance is 10, and thus we know the gold set of features that the are considered imp ortant b y these mo dels. F or eac h prediction on the test set, we generate explanations and compute the fraction of these gold features that are reco vered b y the explanations. W e report this recall av eraged ov er all the test instances in Figures 6 and 7. W e observ e that the greedy approach is comparable to parzen on logistic regression, but is substan tially w orse on decision trees since c hanging a single feature at a time often do es not ha ve an effect on the prediction. The ov erall recall by parzen is low, lik ely due to the difficulty in approximating the original high- dimensional classifier. LIME consisten tly provides > 90% recall for b oth classifiers on b oth datasets, demonstrating that LIME explanations are faithful to the mo dels. 5.3 Should I trust this prediction? In order to simulate trust in individual predictions, w e first randomly select 25% of the features to b e “un trustw orthy” , and assume that the users can identify and w ould not wan t to trust these features (such as the headers in 20 newsgroups, leak ed data, etc). W e thus dev elop or acle “trustw orthiness” b y lab eling test set predictions from a black box classifier as “un trustw orthy” if the prediction changes when un trustw orthy features are remo ved from the instance, and “trustw orthy” otherwise. In order to simul ate users, we assume that users deem predictions untrust worth y from LIME and parzen ex- planations if the prediction from the linear appro ximation c hanges when all un trustw orthy features that app ear in the explanations are remov ed (the sim ulated human “discounts” the effect of untrust worth y features). F or greedy and random, the prediction is mistrusted if any unt rustw orthy features are presen t in the explanation, since these metho ds do not pro vide a notion of the con tribution of each feature to the prediction. Thus for each test set prediction, w e can ev aluate whether the simulated user trusts it using each explanation method, and compare it to the trust wort hiness oracle. Using this setup, we rep ort the F1 on the trustw orthy T able 1: Average F1 of trustworthiness for different explainers on a collection of classifiers and datasets. Bo oks D VDs LR NN RF SVM LR NN RF SVM Random 14.6 14.8 14.7 14.7 14.2 14.3 14.5 14.4 Parzen 84.0 87.6 94.3 92.3 87.0 81.7 94.2 87.3 Greedy 53.7 47.4 45.0 53.3 52.4 58.1 46.6 55.1 LIME 96.6 94.5 96.2 96.7 96.6 91.8 96.1 95.6 0 10 20 30 # of instances seen by the user 45 65 85 % correct choice SP-LIME RP-LIME SP-greedy RP-greedy (a) Bo oks dataset 0 10 20 30 # of instances seen by the user 45 65 85 % correct choice SP-LIME RP-LIME SP-greedy RP-greedy (b) DVDs dataset Figure 8: Cho osing betw een tw o classifiers, as the n umber of instances shown to a simulated user is v aried. Averages and standard erro rs from 800 runs. predictions for each explanation method, a veraged o ver 100 runs, in T able 1. The results indicate that LIME dominates others (all results are significan t at p = 0 . 01) on b oth datasets, and for all of the blac k box models. The other methods either ac hieve a low er recall (i.e. they mistrust predictions more than they should) or lo wer p recision (i.e. they trust too many predictions), while LIME maintains b oth high precision and high recall. Even though we artificially select which features are un trust worth y , these results indicate that LIME is helpful in assessing trust in individual predictions. 5.4 Can I trust this model? In the final simulated user experiment, we ev aluate whether the explanations can be used for mo del selection, sim ulating the case where a h uman has to decide b et ween t wo competing models with similar accuracy on v alidation data. F or this purpose, w e add 10 artificially “noisy” features. Sp ecifically , on training and v alidation sets (80 / 20 split of the original training data), each artificial feature appears in 10% of the examples in one class, and 20% of the other, while on the test instances, eac h artificial feature app ears in 10% of the examples in each class. This recreates the situation where the models use not only features that are informative in the real w orld, but also ones that introduce spurious correlations. W e create pairs of comp eting classifiers b y rep eatedly training pairs of random forests with 30 trees until their v alidation accuracy is within 0 . 1% of each other, but their test accuracy differs b y at least 5%. Thus, it is not p ossible to identify the b etter classifier (the one with higher test accuracy) from the accuracy on the v alidation data. The goal of this experiment is to ev aluate whether a user can iden tify the better classifier based on the explanations of B instances from the v alidation set. The simulated h uman marks the set of artificial features that app ear in the B explanations as untrust worth y , following whic h w e ev aluate ho w many total predictions in the v alidation set should be trusted (as in the previous section, treating only mark ed features as un trustw orthy). Then, we select the classifier with few er untrust worth y predictions, and compare this c hoice to the classifier with higher held-out test set accuracy . W e present the accuracy of pic king the correct classifier as B v aries, av eraged ov er 800 runs, in Figure 8. W e omit SP-parzen and RP-parzen from the figure since they did not produce useful explanations, p erforming only slightly better than random. LIME is consistently better than greedy , irre- spective of the pic k method. F urther, comb ining submodular pic k with LIME outp erforms all other metho ds, in particular it is muc h b etter than RP-LIME when only a few examples are shown to the users. These results demonstrate that the trust assessments provided by SP-selected LIME explana- tions are go od indicators of generalization, which we v alidate with human experiments in the next section. 6. EV ALU A TION WITH HUMAN SUBJECTS In this section, we recreate three scenarios in machine learning that require trust and understanding of predictions and mo dels. In particular, w e ev aluate LIME and SP-LIME in the following settings: (1) Can users choose which of tw o classifiers generalizes b etter ( § 6.2), (2) based on the explana- tions, can users p erform feature engineering to impro ve the model ( § 6.3), and (3) are users able to identify and describ e classifier irregularities by looking at explanations ( § 6.4). 6.1 Experiment setup F or exp erimen ts in § 6.2 and § 6.3, we use the “Christianity” and “Atheism” do cumen ts from the 20 newsgroups dataset men tioned b eforehand. This dataset is problematic since it con tains feat ures that do not generalize (e.g. v ery informati ve header information and author names), and thus v alidation accuracy considerably ov erestimates real-w orld performance. In order to estimate the real world performance, we create a new r eligion dataset for ev aluation. W e do wnload Atheism and Christianit y websites from the DMOZ directory and h uman curated lists, yielding 819 webpages in eac h class. High accuracy on this dataset by a classifier trained on 20 newsgroups indicates that the classifier is generalizing using seman tic conten t, instead of placing importance on the data specific issues outlined ab ov e. Unless noted otherwise, we use SVM with RBF k ernel, trained on the 20 newsgroups data with hyper-parameters tuned via the cross-v alidation. 6.2 Can users select the best classifier? In this section, we wan t to ev aluate whether explanations can help users decide whic h classifier generalizes better, i.e., whic h classifier would the user deploy “in the wild” . Sp ecif- ically , users hav e to decide b etw een tw o classifiers: SVM trained on the original 20 newsgroups dataset, and a version of the same classifier trained on a “cleaned” dataset where man y of the features that do not generalize hav e b een man- ually remo ved. The original classifier achiev es an accuracy score of 57 . 3% on the r eligion dataset , while the “cleaned” classifier achiev es a score of 69 . 0%. In contrast, the test accu- racy on the original 20 newsgroups split is 94 . 0% and 88 . 6%, respectively – suggesting that the worse classifier wou ld b e selected if accuracy alone is used as a measure of trust. W e recruit human sub jects on Amazon Mechanical T urk – b y no means mac hine learning exp erts, but instead p eople with basic knowledge about religion. W e measure their abilit y to choose the b etter algorithm b y seeing side-by- side explanations with the associated raw data (as shown in Figure 2). W e restrict both the n umber of words in each explanation ( K ) and the num b er of documents that eac h greedy LIME 40 60 80 100 % correct choice 68.0 75.0 80.0 89.0 Random Pick (RP) Submodular Pick (RP) Figure 9: Av erage accuracy of h uman sub ject (with standard errors) in c ho osing b et ween t wo classifiers. 0 1 2 3 Rounds of interaction 0.5 0.6 0.7 0.8 Real world accuracy SP-LIME RP-LIME No cleaning Figure 10: F eature engineering exp erimen t. Each shaded line represents the av erage accuracy of sub- jects in a path starting from one of the initial 10 sub- jects. Eac h solid line represents the a verage across all paths p er round of inte raction. person insp ects ( B ) to 6. The p osition of each algorithm and the order of the instances seen are randomized b et ween sub jects. After examining the explanations, users are asked to select which algorithm will perform best in the real world. The explanations are produced by either greedy (chosen as a baseline due to its p erformance in the simulated user experiment) or LIME, and the instances are selected either b y random (RP) or submodular pick (SP). W e mo dify the greedy step in Algorithm 2 sligh tly so it alternates betw een explanations of the t wo classifiers. F or ea ch setting, we rep eat the exp erimen t with 100 users. The results are presented in Figure 9. Note that all of the metho ds are go o d at iden tifying the b etter classifier, demonstrating that the explanations are useful in determining whic h classifier to trust, while using test set accuracy w ould result in the selection of the wrong classifier. F urther, we see that the submodular pick (SP) greatly impro ves the user’s abilit y to select the b est classifier when compared to random pic k (RP), with LIME outperforming greedy in b oth cases. 6.3 Can non-experts impro ve a classifier? If one notes that a classifier is untrust worth y , a common task in mac hine learning is feature engineering, i.e. mo difying the set of features and retraining in order to improv e gener- alization. Explanations can aid in this pro cess by presen ting the imp ortan t features, particularly for removing features that the users feel do not generalize. W e use the 20 newsgroups data here as well, and ask Ama- zon Mechanical T urk users to ident ify which words from the explanations should be remo ved from subsequen t training, for the worse classifier from the previous section ( § 6.2). In eac h round, the sub ject marks words for deletion after observing B = 10 instances with K = 10 w ords in eac h explanation (an in terface similar to Figure 2, but with a single algorithm). As a reminder, the users here are not exp erts in machine learning and are unfamiliar with feature engineering, th us are only identifying words based on their semantic con tent. F urther, users do not hav e any access to the r eligion dataset – they do not even know of its existence. W e start the exp eri- men t with 10 sub jects. After they mark words for deletion, w e train 10 different classifiers, one for each sub ject (with the corresponding words remo ved). The explanations for each classifier are then presented to a set of 5 users in a new round of interaction, whic h results in 50 new classifiers. W e do a final round, after which w e hav e 250 classifiers, eac h with a path of interaction tracing bac k to the first 10 sub jects. The explanations and instances shown to eac h user are produced by SP-LIME or RP-LIME . W e show the a verage accuracy on the religi on dataset at each in teraction round for the paths originating from each of the original 10 sub jects (shaded lines), and the av erage across all paths (solid lines) in Figure 10. It is clear from the figure that the crowd w orkers are able to impro ve the mo del by remo ving features they deem unimp ortant for the task. F urther, SP-LIME outperforms RP-LIME , indicating selecti on of the instances to show the users is crucial for efficient feature engineering. Eac h sub ject to ok an av erage of 3 . 6 minutes per round of cleaning, resulting in just under 11 minutes to pro duce a classifier that generalizes muc h b etter to real world data. Eac h path had on a verage 200 w ords remov ed with SP , and 157 with RP , indicating that incorp orating cov erage of important features is useful for feature engineering. F urther, out of an av erage of 200 wo rds selected with SP , 174 were selected by at least half of the users, while 68 b y al l the users. Along with the fact that the v ariance in the accuracy decreases across rounds, this high agreement demonstrates that the users are con verging to similar co rr e ct mo dels. This ev aluation is an example of how explanations mak e it easy to improv e an un trustw orthy classifier – in this case easy enough that machine learning kno wledge is not required. 6.4 Do explanations lead to insights? Often artifacts of data collection can induce undesirable correlations that the classifiers pic k up during training. These issues can b e very difficult to identify just by looking at the raw data and predictions. In an effort to reproduce suc h a setting, we take the task of distinguishing betw een photos of W olv es and Eskimo Dogs (huskies). W e train a logistic regression classifier on a training set of 20 images, hand selected suc h that all pictures of wolv es had sno w in the bac kground, while pictures of huskies did not. As the features for the images, w e use the first max-p ooling la yer of Google’s pre-trained Inception neural net work [ 25 ]. On a collection of additional 60 images, the classifier predicts “W olf ” if there is snow (or ligh t background at the b ottom), and “Husky” otherwise, regardless of animal color, p osition, pose, etc. W e trained this bad classifier inten tionally , to ev aluate whether sub jects are able to detect it. The exp eriment pro ceeds as follo ws: we first present a balanced set of 10 test predictions (without explanations), where one wolf is not in a sno wy background (and th us the prediction is “Husky” ) and one h usky is (and is thus predicted as “W olf ” ). W e sho w the “Husky” mistake in Figure 11a. The other 8 examples are classified correctly . W e then ask the sub ject three questions: (1) Do they trust this algorithm (a) Husky classified as wolf (b) Explanation Figure 11: Ra w data and explanation of a bad mo del’s prediction in the “Husky vs W olf ” task. Before After T rusted the bad model 10 out of 27 3 out of 27 Sno w as a potential feature 12 out of 27 25 out of 27 T able 2: “Husky vs W olf ” exp erimen t results. to work w ell in the real world, (2) why , and (3) how do they think the algorithm is able to distinguish b et ween these photos of wolv es and hu skies. After getting these resp onses, w e show the same images with the associated explanations, suc h as in Figure 11b, and ask the same questions. Since this task requires some familiarit y with the notion of spurious correlations and generalization, the set of sub jects for this experiment w ere graduate studen ts who ha ve tak en at least one graduate machine learning course. After gathering the resp onses, we had 3 indep endent ev aluators read their reasoning and determine if each sub ject mentioned snow, bac kground, or equiv alent as a feature the mo del may b e using. W e pic k the ma jority to decide whether the sub ject w as correct ab out the insigh t, and rep ort these num b ers before and after showing the explanations in T able 2. Before observing the explanations, more than a third trusted the classifier, and a little less than half men tioned the sno w pattern as something the neural netw ork was using – although all sp eculated on other patterns. After examining the explanations, how ever, almost all of the sub jects identi- fied the correct insigh t, with m uch more certaint y that it was a determining factor. F urther, the trust in the classifier also dropped substantially . Although our sample size is small, this exp erimen t demonstrates the utilit y of explaining indi- vidual predictions for getting insigh ts in to classifiers kno wing when not to trust them and why . 7. RELA TED WORK The problems with relying on v alidation set accuracy as the primary measure of trust hav e b een well studied. Practi- tioners consistently o verestim ate their mo del’s accuracy [ 20 ], propagate feedbac k lo ops [ 23 ], or fail to notice data leaks [ 14 ]. In order to address these issues, researchers ha ve prop osed tools like Gestalt [ 21 ] and Modeltrack er [ 1 ], whic h help users na vigate individual instances. These to ols are complemen- tary to LIME in terms of explaining mo dels, since they do not address the problem of explaining individual predictions. F urther, our submodular pic k procedure can be incorp orated in such tools to aid users in navigating larger datasets. Some recent w ork aims to anticipat e failures in mac hine learning, sp ecifically for vision tasks [ 3 , 29 ]. Letting users kno w when the systems are likely to fail can lead to an increase in trust, b y a voiding “silly mistak es” [ 8 ]. These solutions either require additional annotations and feature engineering that is sp ecific to vision tasks or do not pro vide insigh t into wh y a decision should not b e trusted. F urther- more, they assume that the current ev aluation metrics are reliable, which ma y not be the case if problems such as data leak age are present. Other recen t work [ 11 ] focuses on ex- posing users to different kinds of mistakes (our pick step). In terestingly , the sub jects in their study did not notice the serious problems in the 20 newsgroups data even after lo ok- ing at many mistakes, suggesting that examining ra w data is not sufficient. Note that Groce et al. [11] are not alone in this regard, many researc hers in the field ha ve un wittingly published classifiers that would not generalize for this task. Using LIME, we show that even non-exp erts are able to iden tify these irregularities when explanations are present. F urther, LIME can complemen t these existing systems, and allo w users to assess trust even when a prediction seems “correct” but is made for the wrong reasons. Recognizing the utilit y of explanations in assessing trust, man y ha ve proposed using interpretable mo dels [ 27 ], esp e- cially for the medical domain [ 6 , 17 , 26 ]. While such models ma y b e appropriate for some domains, they may not apply equally w ell to others (e.g. a sup ersparse linear mo del [ 26 ] with 5 − 10 features is unsuitable for text applications). In- terpretabilit y , in these cases, comes at the cost of flexibilit y , accuracy , or efficiency . F or text, EluciDebug [ 16 ] is a full h uman-in-the-lo op system that shares man y of our goals (in terpretability , faithfulness, etc). How ever, they focus on an already interpretable model (Naive Ba yes). In computer vision, systems that rely on ob ject detection to pro duce candidate alignmen ts [ 13 ] or attention [ 28 ] are able to pro- duce explanations for their predictions. These are, how ever, constrained to sp ecific neural netw ork arc hitectures or inca- pable of detecting “non ob ject” parts of the images. Here we focus on general, mo del-agnostic explanations that can be applied to any classifier or regressor that is appropriate for the domain - even ones that are yet to b e prop osed. A common approach to mo del-agnostic explanation is learn- ing a p otentially in terpretable model on the predictions of the original mo del [ 2 , 7 , 22 ]. Ha ving the explanation b e a gradien t vector [ 2 ] captures a similar locality in tuition to that of LIME. How ever, in terpreting the co efficien ts on the gradien t is difficult, particularly for confident predictions (where gradient is near zero). F urther, these explanations ap- pro ximate the original model glob al ly , thus maintaining local fidelit y b ecomes a significant challenge, as our exp erimen ts demonstrate. In con trast, LIME solves the muc h more feasi- ble task of finding a mo del that appro ximates the original model lo c al ly . The idea of p erturbing inputs for explanations has b een explored before [ 24 ], where the authors fo cus on learning a sp ecific c ontribution model, as opp osed to our general framework. None of these approaches explicitly tak e cognitiv e limitations into account, and thus may pro duce non-in terpretable explanations, such as a gradien ts or linear models with thousands of non-zero weigh ts. The problem becomes worse if the original features are nonsensical to h umans (e.g. w ord embeddings). In con trast, LIME incor- porates in terpretabilit y b oth in the optimization and in our notion of interpr etable r epr esentation , such that domain and task sp ecific in terpretability criteria can be accommodated. 8. CONCLUSION AND FUTURE WORK In this pap er, we argued that trust is crucial for effectiv e h uman interaction with mac hine learning systems, and that explaining individual predictions is imp ortan t in assessing trust. W e proposed LIME, a modular and extensible ap- proac h to faithfully explain the predictions of any mo del in an interpretable manner. W e also introduced SP-LIME, a method to select represen tativ e and non-redundant predic- tions, providing a global view of the mo del to users. Our experiments demonstrated that explanations are useful for a v ariety of models in trust-related tasks in the text and image domains, with b oth expert and non-expert users: deciding betw een mo dels, assessing trust, impro ving untru stw orthy models, and getting insights in to predictions. There are a num b er of av enues of future work that we w ould like to explore. Although we describ e only sparse linear mo dels as explanations, our framew ork supp orts the exploration of a v ariety of explanation families, suc h as de- cision trees; it would b e interesting to see a comparative study on these with real users. One issue that we do not men tion in this work w as ho w to p erform the pic k step for images, and we w ould like to address this limitation in the future. The domain and mo del agnosticism enables us to explore a v ariety of applications, and we would lik e to in ves- tigate p oten tial uses in speech, video, and medical domains, as well as recommendation systems. Finally , we w ould like to explore theoretical prop erties (such as the appropriate n umber of samples) and computational optimizations (such as using parallelization and GPU pro cessing), in order to pro vide the accurate, real-time explanations that are critical for any h uman-in-the-lo op machine learning system. Acknowledgements W e would lik e to thank Scott Lundb erg, Tianqi Chen, and T yler Johnson for helpful discussions and feedbac k. This w ork was supported in part b y ONR aw ards #W911NF-13- 1-0246 and #N00014-13-1-0023, and in part by T erraSwarm, one of six centers of ST ARnet, a Semiconductor Research Corporation program sponsored b y MARCO and D ARP A. 9. REFERENCES [1] S. Amershi, M. Chic kering, S. M. Druc ker, B. Lee, P . Simard, and J. Suh. Mo deltrack er: Redesigning performance analysis tools for machine learning. In Human F actors in Computing Systems (CHI) , 2015. [2] D. Baehrens, T. Sc hroeter, S. Harmeling, M. Kaw anab e, K. Hansen, and K.-R. M ¨ uller. How to explain individual classification decisions. Journal of Machine L e arning R ese ar ch , 11, 2010. [3] A. Bansal, A. F arhadi, and D. Parikh. T ow ards transparen t systems: Semantic characterization of failure modes. In Eur op e an Confer ence on Computer Vision (ECCV) , 2014. [4] J. Blitzer, M. Dredze, and F. P ereira. Biographies, bollywoo d, bo om-boxes and blenders: Domain adaptation for sen timent classification. In Asso ciation for Computational Linguistics (ACL) , 2007. [5] J. Q. Candela, M. Sugiyama, A. Sch waighofer, and N. D. Lawrence. Dataset Shift in Machine L earning . MIT, 2009. [6] R. Caruana, Y. Lou, J. Gehrke, P . Koch, M. Sturm, and N. Elhadad. Intelligible models for healthcare: Predicting pneumonia risk and hospital 30-day readmission. In Know le dge Disc overy and Data Mining (KDD) , 2015. [7] M. W. Crav en and J. W. Sha vlik. Extracting tree-structured representatio ns of trained netw orks. Neur al information pr o c essing systems (NIPS) , pages 24–30, 1996. [8] M. T. Dzindolet, S. A. Peterson, R. A. P omranky , L. G. Pierce, and H. P . Beck . The role of trust in automation reliance. Int. J. Hum.-Comput. Stud. , 58(6), 2003. [9] B. Efron, T. Hastie, I. Johnstone, and R. Tibshirani. Least angle regression. Annals of Statistics , 32:407–499, 2004. [10] U. F eige. A threshold of ln n for appro ximating set cov er. J. ACM , 45(4), July 1998. [11] A. Gro ce, T. Kulesza, C. Zhang, S. Shamasunder, M. Burnett, W.-K. W ong, S. Stumpf, S. Das, A. Shinsel, F. Bice, and K. McIn tosh. Y ou are the only possible oracle: Effectiv e test selection for end users of in teractive mac hine learning systems. IEEE T rans. Softw. Eng. , 40(3), 2014. [12] J. L. Herlo c ker, J. A. Konstan, and J. Riedl. Explaining collaborative filtering recommendations. In Confer ence on Computer Supp orted Co op er ative Work (CSCW) , 2000. [13] A. Karpath y and F. Li. Deep visual-seman tic alignments for generating image descriptions. In Computer Vision and Pattern R ec ognition (CVPR) , 2015. [14] S. Kaufman, S. Rosset, and C. P erlich. Leak age in data mining: F ormulation, detection, and av oidance. In Know le dge Disc overy and Data Mining (KDD) , 2011. [15] A. Krause and D. Golovin. Submo dular function maximization. In T r actability: Pr actic al Appr o aches to Har d Pr oblems . Cam bridge Univ ersity Press, F ebruary 2014. [16] T. Kulesza, M. Burnett, W.-K. W ong, and S. Stumpf. Principles of explanatory debugging to p ersonalize interactiv e mac hine learning. In Intel ligent User Interfac es (IUI) , 2015. [17] B. Letham, C. Rudin, T. H. McCormic k, and D. Madigan. Interpreta ble classifiers using rules and bay esian analysis: Building a better stroke prediction model. Annals of Applie d Statistics , 2015. [18] D. Martens and F. Prov ost. Explaining data-driven document classifications. MIS Q. , 38(1), 2014. [19] T. Mikolo v, I. Sutskev er, K. Chen, G. S. Corrado, and J. Dean. Distributed represen tations of w ords and phrases and their comp ositionalit y . In Neur al Information Pr o c essing Systems (NIPS) . 2013. [20] K. Patel, J. F ogarty , J. A. Landa y , and B. Harrison. Inv estigating statistical machine learning as a tool for softw are dev elopment. In Human F actors in Computing Systems (CHI) , 2008. [21] K. Patel, N. Bancroft, S. M. Druck er, J. F ogarty , A. J. Ko, and J. Landay . Gestalt: Integrated supp ort for implementa tion and analysis in mac hine learning. In User Interfac e Software and T e chnolo gy (UIST) , 2010. [22] I. Sanc hez, T. Ro cktasc hel, S. Riedel, and S. Singh. T ow ards extracting faithful and descriptiv e represen tations of laten t v ariable models. In AAAI Spring Syp osium on Know le dge R epr esentation and Re asoning (KRR): Inte gr ating Symb olic and Neur al Appr o aches , 2015. [23] D. Sculley , G. Holt, D. Golo vin, E. Davydo v, T. Phillips, D. Ebner, V. Chaudhary , M. Y oung, and J.-F. Crespo. Hidden tec hnical debt in machine learning systems. In Neur al Information Pr o c essing Systems (NIPS) . 2015. [24] E. Strumbelj and I. Kononenko. An efficien t explanation of individual classifications using game theory . Journal of Machine L earning R ese ar ch , 11, 2010. [25] C. Szegedy , W. Liu, Y. Jia, P . Sermanet, S. Reed, D. Anguelo v, D. Erhan, V. V anhouck e, and A. Rabinovic h. Going deeper with conv olutions. In Computer Vision and Pattern R ec ognition (CVPR) , 2015. [26] B. Ustun and C. Rudin. Sup ersparse linear integer mo dels for optimized medical scoring systems. Machine L e arning , 2015. [27] F. W ang and C. Rudin. F alling rule lists. In Artificial Intel ligenc e and Statistics (AIST A TS) , 2015. [28] K. Xu, J. Ba, R. Kiros, K. Cho, A. Courville, R. Salakh utdinov, R. Zemel, and Y. Bengio. Show, attend and tell: Neural image caption generation with visual attentio n. In International Confer enc e on Machine L e arning (ICML) , 2015. [29] P . Zhang, J. W ang, A. F arhadi, M. Heb ert, and D. P arikh. Predicting failures of vision systems. In Computer Vision and Pattern R e co gnition (CVPR) , 2014.
Original Paper
Loading high-quality paper...
Comments & Academic Discussion
Loading comments...
Leave a Comment