Leveraging Unstructured Data to Detect Emerging Reliability Issues
Unstructured data refers to information that does not have a predefined data model or is not organized in a pre-defined manner. Loosely speaking, unstructured data refers to text data that is generated by humans. In after-sales service businesses, th…
Authors: Deovrat Kakde, Arin Chaudhuri
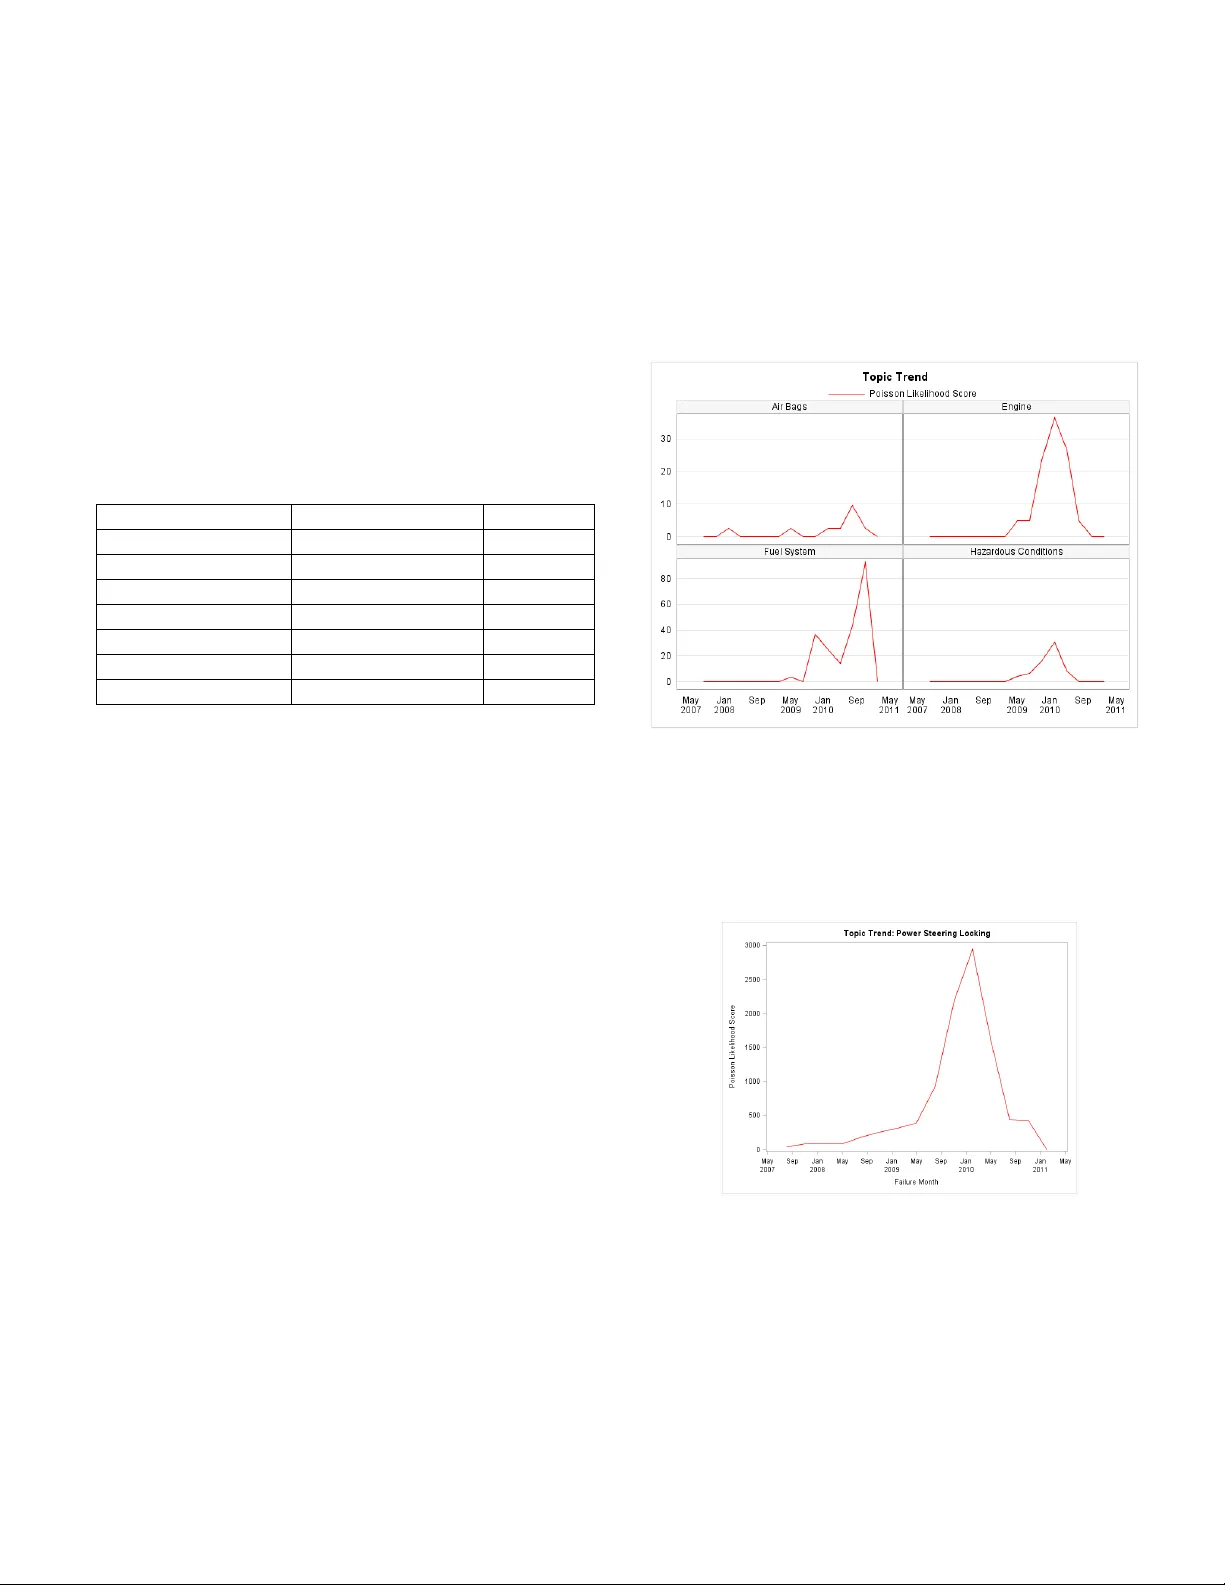
Leveraging Unstructured Data to Detect Emerging Reliability I ssues Deovrat Kakde, SAS Institute Arin Chaudhuri, SAS Institute Key Words: customer co mplaints, emerging issues, text mining, reliability SUMMARY & CONCLUSION S Unstructured data refers to information that does not have a predefined data model or is not organized in a p re - defined manner [1] . Loosely speaking, unstructured d ata refers to text data th at is generated by humans. In after-sales service business es , there are t w o main sources o f unstructured d ata: custo mer complaints, which ge nerally describe symptoms, a nd technician co mm ents, which outline diagnostics and treatment information. A legitimate customer complaint can eventuall y be tracked to a failure or a claim. Ho wev er, there is a delay bet ween the ti m e o f a customer co m plaint and the time of a failure o r a claim. A proactive strategy ai med at analyzing custo mer complaints for symptoms ca n help service p roviders d etect r eliability problems i n adva nce and initiate correc tive actions such as recalls. This paper introduces e ssential text mining concepts in the context of r eliability a nalysis a nd a method to detect emerging reliability issues. T he application of the m ethod is illustrated using a case st udy. 1 INTRODUCTION Customer and Technician comments are rich sources of symptoms and diagnostic information. T raditionally, customer complaints are reco rded in the service provider’s database or with governm ent organizations t hat are responsible for pr oduct safet y oversight such as t he Natio nal Highway T ransportation Safet y Administration (NHT SA) . In today’s digital world, customer co m plaints can be found on social media sites s uch as Faceboo k and Twitter . The number o f d ata so urces as well a s the speed and scale at which t he custo mer co m plaint or feedbac k data is generated can be both a blessing and a curse. A manufacturer or a service provider wh o can h arness this data and identify complaint topics can gain a co mpetitive advantage. T he remainder of this paper will explain and showcase ho w text mini ng techniques ca n be used to anal yze the v ast bod y of customer complaints data for detecting emerging reliabilit y issues. Section 2 introduces the b asics of text mining. Section 3 outlines how te xt mining can be used to identify themes or to pics in custo mer complaints . Section 4 provides a method for id entify ing e m erging reliability issues once a top ic is established. An exa m ple that uses actual c ustomer complaints is provided in section 5 . It is followed b y the conclusio ns. 2 BASICS OF TEXT MI NING Text mining is an umbrella ter m for describing technologies that ana lyze and process unstructured data . Text mining can mean different things to d ifferent anal ysts [2]. But an y text mining technology fi rst involves converting text into numbers and then appl ying a rele vant algorithm to solve the business problem at hand . Input to the text mining algorithm con sists of terms, docu ments, and a corpus. In the co ntext of this paper , each complaint is a document, a d ocument is a co llection of terms, and a collection of docu ments is called a corpus . The vector space m odel is co mmonly used for numeric representation of a document. In th is model, each document is a vector, and the elements of the vector indicate the occurrence of a term within a document. A ter m count o r a Boolean value i ndicates the pr esence or absence o f a word . A docu m ent can also be represented as a weighted vector . The weighted vector en tries are computed using a weighing approach such as the TF -IDF (T erm Frequenc y-Inverse Document Frequency) [2]. The entries of th e weighted vector reflect ho w i mportant a word is to a document i n the corpus . The corpus is a co llection of multiple docum ent vectors and is represented using a t erm-document matrix. The vector space model ignores t he ord er of words . T his model is called the "b ag - of -words" app roach. T he b ag - of - words approach works fine for key text mining tas ks such as clustering and topic identification . Figu re 1 illustrates these key concepts. Figure 1 – Term, Document, and Corpus The size of the term-docume nt matrix can grow very fast as the number of docu ments i ncreases. Additionally , since each document co ntains only a few ter ms fro m the overall corpus, the ter m-document matrix is also v ery sparse . Hence, it is important to reduce the dimension of this m atri x so that subseq uent algorit hms w ork faster and a ny noise in the data is reduced . The di m ension r eduction can be achieved b y eli minating ter ms or documents or b y using mathematical techniques such as Singular Value Decomposition [3 ]. These two tec hniques are outlined below. 2.1 Dimension Red uction using Term Elimination: The number of ter ms can b e reduced by adop ting the one or more of t he following techniques: Stop List: Create a p redefined list of terms that are not important f or solving t he business problem at hand. For the corp us in Figure 1 , stop list ca ndidates would b e terms such as my, at, is, when, and while . Start List: This is the list of important w o rds. A ny term that is not part of the start list is not included in t he analysis. Stemming: T his technique maps a word to its roo t . For example, words such as driven and driving are mapped to their roo t, which is driv e . T here ar e different algorithms f o r ste mming. Most ste mming algorithms in English are based on Porter’s stemming algorit hm [4]. Spelling Corrections: Each misspelled word that is not corrected or mapped to its cor rect spelling forms a separate row in the term document matrix and th us increases t he matrix di mension. The spelling correc tion is generall y do ne using fuzz y matching algori thms. SOUNDEX is one s uch algorithm [5]. Remove ter ms that occur in a single document o r less than a set threshold n umber of documents . Remove numeral s if they ar e not of i nterest to the analysis. 2.2 Dimension Red uction Using Singu lar Value Decomposition (S VD): SVD is a matrix factorization method. It is used to approximate any high di mensional, ter m-document matrix by usi ng a lower di mensional matrix [2 ]. SVD is similar to Principal Component Analysis. Mathematically t he SVD of matrix A with rank r is where U and V are matrices with or thogonal columns . is a diagonal m atr ix with p ositive singular value entries . The matrix A can be approximated by b est rank k matrix where k ≤ r. where and are created using first k columns of U and V is the kxk diagonal m atrix with top k singular values. 2 = 2 3 IDENTIFYING DOCU MENT TOPICS A corpus o r a do cument can contain multiple topics or themes. A corp us o f custo mer complaints generally consists of topics that are related to product parts or subsystems and descriptions abo ut wh at went wrong o r the symptoms. Complaints also contain infor mation about how the customer was using the pr oduct. C onsider th e follo wing two customer co m plaints: Complaint 1: I h ave a 2008 S peed Mach ine Savoy - the power steering is extremely difficult at times- the light comes on and off- showing a problem is p resent- I am unable to turn the car n ormally- making me use two hands -also, there is a rattle in the ba ck- left- very noticeable - to all in vehicle. Complaint 2: I purchased the car literally off the showroom floor . One d ay and 38 miles later it stalled ou t on my wife on the way to church. Two weeks later I got it ba ck. It turned out to be a problem in the accelerator pedal . The dealer had to finally take one from ano ther car to help solve my problem . Two da ys later I now ha ve a prob lem with the rear "third eye" bra ke light. It will not go off. I am returning the ve hicle on Monday and will wait to see what th is problem is. I know the speed machine sa voy is new but I should n't be having these kind of problems . A quic k look at the co m plai nts indicates presence o f multiple top ics in each co m plaint. T he first complaint is about a 2008 Speed Machine Sa voy 's po wer steering , turning problems, and a rattling so und heard at the ti m e of event. The seco nd co m plaint is abo ut the Speed Machine Savoy's ac celerator p edal, stalling, an d brake light. The complaint also p rovides some ad ditional details such as mileage (38 miles) and driver (owner’s wife) at t he ti m e of the i ncident. Both compla ints were ab out the Spee d Machine Savoy, and each complain t had multiple topics in it . These top ics are i mportant for the manufacturer because they shed li ght on the reliabili ty of the p roduct in t he field . An effecti ve text mining algori thm should be able to identify different topics in the docu ment corpus. There are different techniques to identify to pics in a corpus [2]. For the case study i n the current paper , SAS ® Enterprise Miner ™ was used for topic identification. The algorithm started with t he basic SVD co ncept vectors and then applied a rotation transformation to try to produce concepts that can be more easily interpreted . 4 IDENTIFICATIO N OF EMERGING RELIABILITY ISSUES There is a significa nt amount of literature o n using event count d ata to detect emerging reliability i ssues. Use of unstructured data to identify emerging issues in product reliability is a relati vely new field. However, there is a sufficient am ount of researc h where unstructured data is successfully used to detect emerging issues in the dom ain of public health. [6 ] used patient’s symptoms that were noted at emergency roo m admission to detect the onset of an epidemic. T his paper uses an appro ach similar to [6] , but applied to the custo m er co m plaints . The identification of useful to pics fro m custo mer complaints that are indicativ e o f reliability problems or product malfunction iss ues is the most challen ging part . It requires d om ain k nowledge to identify which co m ponent, part is problematic as well as which s ymptoms warrant investigation. Also, customer complaints are generally very verbose, and there is usual ly a lot of information in complaints that is not use ful fr om the analysis perspective . A good topic should identify the malfunctioning part or assembly as w ell as shed some light on the symptoms. T he dimension red uction techniqu es such as stop list, start list, stemming, a nd spelling correction ar e very us eful i n eliminating the noi se from t he complaints and identifying topics of interest . Any algorithm to identify emerging issues should generate alerts for kno wn problems, as well as a ny previously unknown p roblems. In the case of customer complaints, the algorith m should detect , at a minimum, topics that can identify the component , subsystems, and symptoms that w ere previo usly unknown . To identify emerging reliability issues using unstructured data involves first using a text mini ng algorithm to identify important relevant topics . T hen statistical techniques are used to alert for sig nificant sh ifts in topic frequenc y. The methodology of detec ting shift s is based on the expectation-ba sed Poisson statistic as outli ned in [7]. The follo wing hypothese s were tested us ing t his methodology: H 0 : C jt the count of do cuments for a topic j (j=1 to k) in a time period t follows P oisson ( b j t) wh ere b j is the baseline topic rate per d ocum ent per time period. H 1 : C jt the count of do cuments for a topic j (j=1 to k) in a tim e period t follo w s Poisson ( qb j t) w here b j is th e baseline topic rate per d ocum ent per time per iod, for some q > 1 B jt : Expected count of documents for topic j (j=1 to k) in time period t n: number of time intervals for calculating C jt . At the end of nth interval, the expec tation- ba sed Po isson statistic F jn is calculated. Specific steps are as follo ws: Establish existing to pics ( k) and topic rate per p roduct per time period (b j , j=1 to k) using historic co mments data. The actual docu m ent f requency is divided by expected p opulation of products i n field to arrive at the topic rate per p roduct, per time period . b 0 =min(b j , j =1 to k) is the b aseline topic rate for new topics. In every new time period, calculate the actual count C jt , j=1 to k In every n th time period , compute the Poisson lo g likelihood ratio F jn The topics with F jn greater than 1, are em erging topics. The text mining algorithm used for topic identification, assigns o ne docu m ent to multiple topics . If top ics are indicative of a part and/or symptoms, then further anal ysis to identify which top ics appear together can be bene ficial to understand parts m alfunctioning to gether. 5 CASE STUDY The actual c ustomer co mplaints were ana lyzed to identify emerging reliab ility iss ues usi ng the methodolog y described in sections 2 throug h 4. The complaints were for a specific m od el of an auto mobile manufacturer . T here were total 5,259 complaints from 1 992 to 2014 . The first 36 months of data, w here each month had at minimum one complaint, was used to identify the existing topic and establish its baseli ne rate . An alysis was performed u sing the text mining functionality availab le in SAS ® Enterprise Miner ™ version 12. 1. In SAS ® Enterprise Miner ™ , the data mining process is driven b y a process flow diagram that can be created by dragging nodes from the app lication to olbar and dropping them in a diagram w orkspace [ 7]. T he current analysis was perfor med using the nodes for text impor t, text parsing, text filter, and text top ics. Figure 2 illustrates the process flow d iagram. T he SAS Code nod e was used to query the data for a sp ecific time period. Figure 2 – Process Flow Diagram A stop list and a syno nym list w a s speci fied under the text parsing node. Terms th at appear in fewer than four documents were ignored in the anal ysis. A stop list was carefully co nstructed so tha t terms t hat are not relevant for the analysis are excluded . The T ext Topics n ode, in addition to finding n ew top ics, enables users to specify a list of custo m topics . Users ca n define topics of interest a nd fo rce the text mining node to identify do cuments that belong to these custo m topics. A set of cu stom to pics was created based on domain k nowledge . Table 1 shows the list of custom top ics used in the anal ysis. As seen in table 1 these topics indicate the i m portant subsystems in automobiles and possible symptoms these automobiles can exhibit . The weight associated with a ter m indicates the relative importance of the ter m to the topic . A weight of 1 is highest importance and weig ht of 0 is the lowest. Table 1 – Custom Topics Topic Terms Weight Vehicle Speed Control Accelerator 0.9 Vehicle Speed Control Gas Pedal 0.9 Vehicle Speed Control Cruise Control 0.8 Vehicle Speed Control Vehicle Speed Control 0.8 Accident Accident 0.9 Accident Crash 0.9 Accident Collision 0.9 The analysis was first run using the 36 months of data . After analysis co m pletion, the T ext Topics node assigned documents to the custom topics as well as new ly d iscovered topics . Each of the new topics was examined for relevance . If the topic was of i nterest, then it was converted into a custom topic, so that the Text Topic node could assign documents avai lable in the next ti m e per iod to this top ic . One o f the topics d iscovered when a nalyzing t he first 36 months data was f ailure of power steeri ng with locking. The key ter ms that d escribed t his top ic were power, steer, lock, indicator, light, and illuminate . This disco vered topic consisted of a subs ystem, Power Steer ing in this ca se, and symptoms such as locki ng and indicator light ill umination . After anal yzing the first 36 m onths o f customer complaints data, the subsequent data was analyzed in t hree- month incre ments. For each month, the C jt was compared against the baseline count B jt to compute t he Poisson log likelihood ratio F jt . Any discovered topic of interest was set as a custom topic for monitoring i nstances of it i n the following time period s. Figure 3 illustrates the quarterly trend of custo m topics. The custo m topics, such as Air Bags and Engine represent broad top ics wh ich at minimum indicate what part is malfunctioning. So m etimes it is d ifficult to b uild custo m topics w ith terms indicative of sympto ms, because t hose symptoms might b e new, or organizations might not have sufficient domain expertise to i dentify all po ssible symptoms. In s uch case a c lose exami nation disco vered topics can help ide ntify symptoms. For example, in this case study, when a nalyzing the 36 months of histo ric data, the text topic node identified a topic w ith the key ter ms power , steer , indicator , and light . These key terms were associated with symptoms such as lo ck and illuminate . A close examination o f co mplaints r evealed t hat these symptoms were associated with steering lo cking issues w here malfunction indicator light would turn on. This to pic was called “p ower steering locking .” In subsequent quarterl y analyses , “p ower steerin g locking ” was used as a cus tom topic . Figure 3 – Topic Trend The quarterly tr end of “ Power Steering Locking ” is shown in Figure 4 . T he figure indicates a sudden upward trend in the P oisson likelihood ratio starting in May 20 08 . This trend is alar ming and indicates a p roblem that affects a significant number of pro ducts in the field . Figure 4 – Power Steering Locking Trend CONCLUSIONS This paper outlines a simple method to detect emerging reliability iss ues using customer complaints . It uses text mining technology to identif y topics and statistical methods to detect emerging is sues. T he topics , which at minimum consist of product part or sub-system w ith on e or m a ny symptoms, represent very useful i nformation. A manufacturer or a service provider can get insights ab out symptoms and their pr evalence. T he method described in this paper cannot be co mpletely automated . As outlined in earlier sections, h uman input is needed in defining stop lists, synonyms, and custom topics and in interpreting the discovered topics. The hum an efforts are primarily needed at the project start, when b aselines for the topics are established. T he log likelihood statistic d escribed in the paper along with so me sympto m severity statistic, such as average co st o f repairs, can help pr ioritize the iss ues for further root cause anal ysis. REFERENCES 1. http://en.wikipedia.or g/wiki/Unstructured_data . 2. G. Miner , J. Elder IV, T . Hill, R. Nisbet, D. Delen, "A. Fast, P ractical Text Mining an d Statistical Anal ysis for Non-structured Text Data Applications, " Acade m ic Press, 2012 . 3. R. Albright, "Taming Text w ith t he SVD," SAS Institute Inc., Car y, NC, available at http://ftp.sas.com/techs up/download/EMiner/T amingT extwiththeSVD.pd f . 4. M . F. P orter , “ An algorithm for suffix stripping,” Program 14, no . 3, July 1980, pp 130- 137 . 5. C . D. Mannin g, P . Ra ghavan; H. Schütze, Introduction to Informa tion Retrieval , Cambridge Universit y Press , 2008. 6. K. W. Murray, A Sema ntic Scan S tatistic or Novel Disease Outbreak Detecti on , Master’s Thesis, Language Technologies Institute, Carnegie Mellon University, 2013 . 7. D. B . Neill , “E xpectation -based scan stati stics for monitoring spatial time ser ies data”, I nternational Journal of Forecasti ng, 25, 2000. 8. SAS Institute Inc. , “ Getting Started with SAS ® Enterprise Miner ™ 1 2.1 ”, Cary, NC, SAS Institute Inc., 2012. BIOGRAPHIES Deovrat Kakde SAS Institute Inc. World Headquarter s SAS Campus Drive Cary, NC 27513 USA e-mail: Dev.Kakde @sas.com Deovrat Kakde works as a Senior Research Statis tician Developer at SAS I nstitute. He has over fiftee n years o f experience in various industries s uch as Ma nufacturing, Transpo rtation and Software. H e holds Master ’s degree i n Quality, Reliability and Operations Research fro m the Indian Statistical I nstitute, Kolkata and Bachelor’s degree in Production Engineering from Bombay University, India. He is an ASQ Certified Reliabil ity Engineer. Arin Chaudhuri SAS Institute Inc. World Headquarter s SAS Campus Drive Cary, NC 27513 USA e-mail: Arin.Chaud huri@sas.com Arin Chaudhuri has been working a s a Principal Resear ch Statistician Developer at SAS Institute for the past 10 years. He writes code to implement various statistical and numerical algorithms. He holds a Ma ster’s and a Bachelor’s degree in Statistics fro m the Indian Statistical Institute, Kolkata.
Original Paper
Loading high-quality paper...
Comments & Academic Discussion
Loading comments...
Leave a Comment