Customer Churn in Mobile Markets A Comparison of Techniques
The high increase in the number of companies competing in mature markets makes customer retention an important factor for any company to survive. Thus, many methodologies (e.g., data mining and statistics) have been proposed to analyse and study cust…
Authors: Mohammed Hassouna, Ali Tarhini, Tariq Elyas
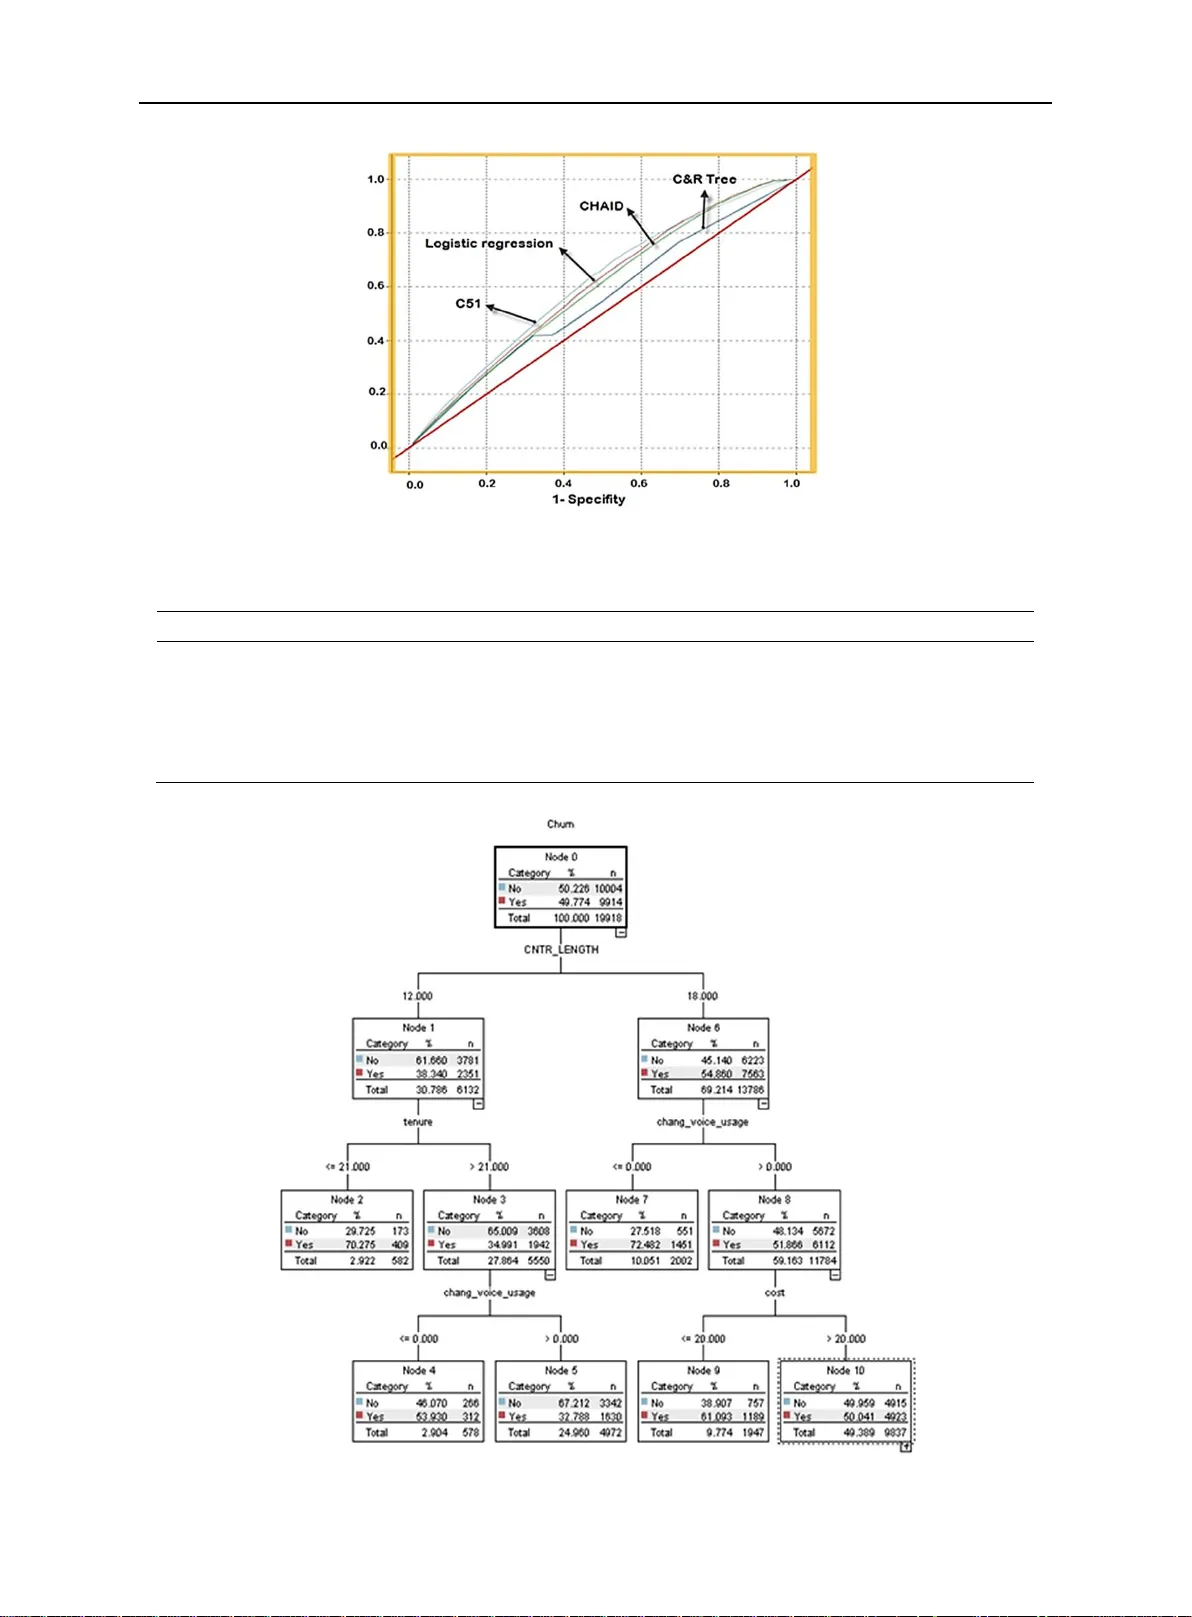
International Business Research ; V ol. 8, No. 6; 2015 ISSN 1913-9004 E-ISSN 1913-9012 Published by Canadian Center of Science and Education 224 Custo m er Churn in Mobile M arkets: A Co mparison of T echniques Mohammed Hassou na 1 , Ali T arhini 2 , T ariq Elyas 3 & Moha mmad Saeed AbouTrab 2 1 Computing and Infor mation Systems Depart ment, U niversit y of Greenwich, United Kin gdom 2 Department of Infor mation Systems, Brunel Uni versity London, Mid dlesex, U nited Kingdom 3 Faculty of Arts and Humanities, King Abdulaziz U niversity, Saudi A rabia Correspondence: Ali T arhini, Department of Inf ormatio n Systems , Brunel Universit y Londo n, Midd lesex, UK . E-mail: ali.tarhini@bru nel. ac .uk Received: A pril 16 , 201 5 Accepted : May 15, 201 5 Online Published : Ma y 25, 2 015 doi:10.5539 /ibr .v8n6p 22 4 URL: http://dx.do i.org/10.5539/ ibr .v8n6p 22 4 Abstract The h igh increase in the num ber of co mpanies competing in mature markets m akes cus tomer retention an important factor for any company to survive. Thus, many methodologies (e.g., data mining and statistics) have been prop osed to analyse and stud y customer rete ntion. The validity of suc h methods is not yet proved though. This paper tries to fill this gap by empiricall y comparing two techniq ues: Customer c hurn - dec ision tree a nd logistic regression models. T he pap er proves the supe riorit y o f dec ision tree techniq ue and stresses the need s for more advanced methods to ch urn modelling. Keywords: custo mer relationship management, customer ch urn, data mining, mobile market 1. Introduction Information technolog y (I T) has beco me a vital and inte gral part of every busine ss plan (T ar hini et al., 2 014a, b, c; Abbasi et al., 201 5; Alenezi et al, 2015; E l-Masri et al., 2015; Masa ’ deh et al., 2015 a, b, c; T arhini et al., 2015a , b, c) . Recently , Customer Relationship Ma nagement ( CRM) has got lot of attentions for nowadays companies where cu stomer rete ntion is c onsidered to be its main factor to be investigated as it focuses on developing and controlling lo yal, profitable a nd lasting relatio ns with customers. Developing successful retention techni q ues is important for b usinesses i n general, and for mobile operator s in particular since t hey are l osing 20% to 40% o f their c ustomers each year ( Jonathan, Jangh yuk, & Lawrence, 20 01; Ahn, H an , & Lee, 20 06; Seo, Ranganatha n, & Babad, 2008; Ordenes et al., 20 14; Hu, Shu, & Qiao, 2014, T arhini et al., 201 5d, e; Orozco et al., 2015 ). Attracting ne w customers costs a lot in ad vertising, ed ucating, creating new accounts. Such costs do not exist in the case o f retai ning existing custo mers. As a result, keepi ng an existing custo mer is five times cheaper than one attracting a new one (McIlro y & B arnett, 200 0). Improving c ustomer retentio n contribute s in red ucing churn rate from 20% to 10% annuall y saved about £ 25 millio n to the mobile operator Orange (A ydin & Ö zer, 2005). Investigate customer churn has been a s ubject for m any methods and tech niques including statistical methods and data mining. The super iority of u sing data mining is well establi shed to investigate custo mer ch urn compared with traditio nal m arket re search surveys (Shaw et al., 2001; Oliv eira, 2012; Huang, Kechadi , & Buckley , 201 2). Ma rket resear ch surveys based o n runnin g questionnaires or interviews voluntarily suff ers from a high cost, limited access to the custo mer pop ulation and d ata sel f -repo rting. Contrary , data m ining provides knowledge of whole customer populations based on analysis of t heir current and historical data. Data mining increasingly beco mes a main technique in c ustomer retention to predict future custo mers ’ attitude and detect patterns within historical data (W ei & Chiu, 2002; Han, L u, & Leung, 20 12; Liu & Fan, 2014) . T wo o f the most co mmon d ata mining tech niques are re gression anal ysis and decision tree (Hung, Y en , & W ang, 2006). First, logistic regression predicts the occurrence p rob ability o f customer churn by formulating a set of equations, input field values, factors a ffecting c ustomer churn a nd the output field ( A hn et al., 2006; Burez & V an den Poel, 2007). Second, decision trees, the most pop ular type of p redictive model ( B urez & V an d en P oel, 2007; Nie et al., 201 1), are used to solve classification pro ble ms where the instances ar e classified i nto one of two classes (i.e., positives and negatives). However, there i s little in the li terature that ( a) Provid es an inclu sive view of ho w decision tree and logistic regressio n models can be used to analyse and u nderstand customer churn in the mobile teleco mmunication market; and (b ) explores the p ros and cons of these techni ques. www . ccsenet.org/ibr International Business Research V ol. 8 , No. 6; 2015 225 Addressing these i ssues, we clar ify ho w to develop decision trees and logistic regressio n models using rea l data sets provided b y a UK mobile op erator . Experimental results a nd discussion ar e pr esented to pro vide understandings into the complexity of the churn prob lem. W e discuss the pros and cons of tech niques in customer retention analysis and suggest directions for future research. T his paper is structured as follows. Section 2 revises decisio n tree and logistic r egression modelling techniq ues. Perfor mance evaluation metrics are described in Section 3. Sectio n 4 intro duces modelling e xperiments results. Sectio n 5 eval uates and co mpares the performance of the developed models. Lastly , sec tion 6 concludes t his paper and points to future work. 2. Churn M odelling T echniq ues 2.1 Log istic Regr ession Logistic regression is a data mining technique used to predict occurrence probability of custom er churn (e.g., Burez & V an den Poel, 2007; Ahn et al., 2 006; Migué is et al. , 2012 ; Faris, Al -Shboul, & Ghatas heh, 20 14; Glady , Baesens, & C roux, 2009; Farquad, Ravi, & Raju, 2014). Logistic regression is based on a mathematically-orie nted app roach to anal yse the a ffecting of variables on the others. Prediction is made b y forming a set of eq uations connecting input values (i.e., affecting c usto mer chur n) with t he output fi eld (probability of churn). The equations (1), (2) and (3) give the mathematical for mulas for a logistic regression model (Miner , Nisbet, & Eld er , 2009). (1) (2) (3) Where: • y is the target variable for ea ch individual j (custo mer in churn modelling), y is a binary class label ( 0 or 1) ; • is a constant; • is the weight given to the specific variable associated with each customer j (j =1,…. m) ; • are the pred ictor variables for each custo mer j, from which y is to b e predicted . Customer data sets are analysed to form the r egression equa tions. An e valuation p rocess fo r each customer in the data set is then per formed. A customer is ca n be at risk o f c hurn if the p -value for the custo mer is greater than a predefined value (e.g. 0. 5), Regression anal ysis needs to b e processed in caution si nce it may give misleadin g results when carrying out causality a nd impact assessment (Cook & W eisberg, 1982; Amin et al., 2014). Multicollinearity res ulted from strong correlations between independent variables is a concerning fa ctor in logistic regression models as well (Miner et al., 2 009; Hui, Li, & Zongfan g, 201 3). The existence of strong multicollinear ity leads to incor rect conclusions ab out relation ships between independent a nd dependent variables since it i nflates the varia nces of the p arameter estimates and gives wrong m agnitude of the regression coefficient. Under certain circumstances, logistic regressio n can b e use d to approximate a nd represen t nonlinear s ystems i n spite o f it is a l inear appr oach (Cook & W ei sberg, 1982; Ren et al., 201 4). However , logisti c r egression needs to b e tested and evaluated for the increasing co mplexity o f the mobile teleco mmunication market (P aul & Cadman, 2002; Su, S hao , & Y e, 2 012; Su, 2014). 2.2 Decision T r ee Decision trees, the mos t p opular pr edictive models, is a tree graph presenting t he variables ’ relatio nships (B urez & V an den Poel, 200 7). Used to so lve c lassification and predictio n pr oblems, decision tree models ar e represented and eval uated in a top -do wn way . The two phases to develop decision trees are tree building and tree pruning. Starting from th e root node representing a feat ure to b e classified, d ecision tree i s b uilt. Selecting a f eature can be do ne b y e valuating i ts information ga in rat io. T he lo wer level nodes are t hen co nstructed in similar way to t he divide and co nquer strategy . Improvi ng pred ictive accurac y a nd r educing co mplexity , p runing proce ss is app lied on decision trees to produce a smaller tree and guara ntee a better generalisation by re moving branches contain i ng the larg est estimated er ror rate (Au, Chan, & Y ao , 200 3). The d ecision about a given ca se regardi ng to which of t he two classes it belo ngs is thus made b y moving fr o m the root node to all leaves. Thou gh there a re many algorit hms for building decision tree, C AR T , C5.0 and CHA ID are those m ost used (B in, Peiji, & Juan, 2007) . www . ccsenet.org/ibr International Business Research V ol. 8 , No. 6; 2015 226 Decision trees have several advantages. First, they are easy to visualise and un derstand (Bakır et al., 2009) . Second, no p rior assumptions abo ut the data are needed since it is a no npara metric ap proach (Fried l & Brod ley , 1997; Rahman et al., 201 2). Third, decision trees ca n process nu merical and categorical data. On t he o ther hand, decision tr ees suffer fro m so me disadva ntages. First, its perfor mance is affected b y co mplex interactio ns amon g variables and attribute s. Second, co mplex decision trees ar e very hard to be visualised and interpreted. Third, it suff ers from the lac k of robustness and o ver-sensitivity t o trainin g data sets (Burez & V an d en Po el, 2 007; Hassouna & Arzoky , 2011; De, Subbiah, & V egi, 20 14). 3. Data Mining Performance Eva luation Metrics The cr itical issue in using different churn modelling methods relate to: (a) Eff icientl y a ssessing t he perfor mance of these methods; a nd ( b), benchmarking and comparing the relati ve perfor mance a mong competing models. This section discusses t hose issues. 3.1 Classification Accuracy The confusion matrix is a tool that can b e used to measure the p erformance of binary cla ssification mode ( also called co ntingency table). A co nfusion matrix is a visual representation of information ab out actual and pred icted classifications p roduced by a classificatio n model (Mi ner et al., 2009, p. 2 92). T able 1 depicts a confusion matrix for a binary classifier . T able 1. A confusion matrix for a binary classifier Predicted classe s Actual classes Class=Y es/+/ Churn Class=No/-/No-c hurn Class=Y es/+/ Churn TP (true positive) FN (false neg ative) Class=No/-/ No- churn FP (false positive) TN (true negative ) Diff erent accurac y metrics result ed fr om the confusion matrix are classification accurac y , se nsitivity a nd specificity . Classification accurac y (CA) is the percenta ge o f the o bservations t hat were correctly classified, which can be calculated from the matrix usin g equation (4) (V u k & Curk, 2006 ): CA= ( 4) Classification accuracy is an a mbiguous indicator particularl y in t he case of extreme data. T o explain, a base contains 9,9 90 churn custo mers and 10 non -churn ones. If a model succeeds to p redict that all 1 0,000 customers are at risk of churn, the acc uracy of classificatio n will be 99.9%. The high accuracy rate mistakenly indicates t hat the model is ver y ac curate in predicting customer churn because the m odel does not detect an y non -churn customers. Predicting churn cases in a correct way is always more important than predicting no n-churn cases as the cost of mis-pred icting churn is higher tha n that of mis -pred icting non-churn. 3.2 Sensitivity and Specificity Overcoming some of the weakness of accuracy metric, sensitivity a nd speci ficity are used. Sensitivity is the proportion of actual po sitives that are correctl y identified. Spec ificity is the prop ortion of actual negatives th at are correctly identified. The equations are t hus: Sensitivity= (5) Specificity= ( 6) Mobile o perators prefer m odels with high se nsitivity rather than models with h igh specificit y b ecause the cost associated with the i ncorrect classification of churners i s higher than t he cost associated w ith the incorrect classification of a no n-churner . A compro mise bet ween high sensitivity co mbined with reasonable specificity www . ccsenet.org/ibr International Business Research V ol. 8 , No. 6; 2015 227 should b e al ways made so mobile op erators can effectively mana ge their marketing b udget to achieve high customer retention. 3.3 Receiver Op erating Characteristic Curve (ROC) The Receiver Operati ng Char acteristic (ROC) curve is a d epiction of the r elations between the tr ue positive rate (i.e., benefits) and fal se p ositive rate (i.e., co sts), dra wn on x and y axi s i n l leaner scale (Kar ahoca, Karahoca & A ydin, 2007) . ROC represen ts the relations b etween the churners ratio co rrectly predicted as churners, and non-churners r atio wrongly predicted as churners. T he ROC provides relative compro mises bet ween benefits and costs. T he ROC c urve con sists of po ints correspo nding to prediction r esults. Figure 1 pr esents an example of a ROC curve. Figure 1. An example of RO C curve The best performance model i s when the ROC curve p asses through or close to ( 0, 1). T he model sensitivity a nd specificity will then b e 1 00% (i.e., no false negatives and no false p ositive r espectively). Some models such as logistic regression p roduce a score rather than p roducing b inary class dec isions (i.e. c hurn or non -c hurn). T o produce a b inary classifier i n this case, thresholds are used. If the classifi er result i s greater than a threshold, the classification class is a chur n. Otherwise, it is non -churn. Figure 1 dep icts ROC curve for a random predictor represented by t he diagonal li ne that divides t he RO C space into t wo parts represent s. RO C curve s pass ing near this line correspond to random guessing classifiers (e. g. classifying by tossing a coin). Generally , models with ROC curve s passing the top left part of the ROC curve perfor m better . The area under the ROC c urve (i.e., called AUC) is used as a per formance metric (Karahoca et al. , 2007). T he AUC value ranges from 0.0 to 1. 0. Models perform better when having greater AUC. Mo reover, models with AUC value greater than 0.5 perfor m better than random models because t he area under the ROC dia gonal line is 0.5. 3.4 Lift Chart Evaluating model perfor mance and d etermining thresholds, the Lift chart is similar to the ROC curve by yielding high tr ue positive cases. If the total number s o f t he clas sification insta nces are u nknown a nd the true p ositive TP rate cannot be computed, the ROC curve is not ap propriate and a Lift chart sho uld be use d for measuring t he accuracy of models ( V uk & Curk, 20 06) . In custo mer c hurn, t he Lift chart gathers custo mers into deciles based on their churn p redicted probability . Each decile shows the predicatio n performance o f the model. An instance o f lift chart for a c ustomer chur n model is shown in Figure 2 . T he top two dec iles arrest about 5 0% of churners and the to p five deciles assert about 90% o f www . ccsenet.org/ibr International Business Research V ol. 8 , No. 6; 2015 228 churners. Lift charts ha ve become pre ferred per formance evaluation metric used a mong marketers since it groups customers based on their relative probab ility to c hurn. Keeping the marketing cost at a minimum level along with maintaining high cu stomer retention rate can be achieved by targe ting cu stomers in the top deciles rather than targeting all of them. Figure 2. A li ft chart of customer churn model 4. Modelling Experi ments and Result s T o test those methods, churn analysis and p rediction experiments were used. The ubiquitous data min in g methodology CRISP -DM was adopted to investigate custo mer churn in the telec ommunications sec tor (Chapman et al. , 2000; Rudin & W a gstaff, 2014 ). T he CRISP -DM methodolo gy gives co mprehensive instructions and pro cedures for applying data mining algorithms to solve real- world prob lems. The CRISP-DM model consists of six phases: (1) Busin ess understanding; (2) data understanding; (3) data preparation; (4) modelling; (5) evaluation; a nd (6) deployment. Understanding business involves specifying its ob jectives and correlating them with data mining applications. Understanding data entails data co llection, familiarization, exploratio n, d escription and quality veri fication. Data preparation transfor ming r aw data into a suitable for mat in the sake o f app lying data mining algorit hms includes data cleaning, trans formation and r eduction. Modelling selects and applies suitable data mining a lgorithms and identifies their par ameters for addressing business pr oblem. T he decision abo ut adopting data mining models should be taken based on the evaluation results f rom a business o bjective perspective. Deployment is th e last phase where the discovered kno wledge from the data mining process should be organized and presented in a format that the business can use. 4.1 Data Sets De scription This section highlights the proce sses involved in t he data understanding phase. T wo sets of data were used to show ho w traditional a nalysis techniq ues may be used to explo re churn. T he data sets were obtained from a U K mobile telecom munication op erator d ata warehouse. T he analysis is based on t wo datasets of 15 ,519 and 19 ,919 customers resp ectively conta ining 17 variables. The d ependent variable ( output variable) simply identifies whether the customer c hurns or not. The predictor variables (input variables) are i n T ab le 2. These variab les are categorised into five groups: Demographics, cost, features/market ing, services usa ges an d customer services. A brief descrip tion of the predictor variables is provided by T able 2. Both data sets contained 5 0% of custo mers who ch urned and 50 % who sta yed with the operato r . The data sets also contain custo mers on 12 - and 18-month contracts. The data sets reflect the customer population features under stud y . The d ata sets cover customers ’ data from March to Dece mber, at which the c ustomers took the decision of chur n. The data were collected from Month 4 to Month 9 for the ne w or upgraded 1 2 -month c usto mers. In addition, the data were collected from Mon th 9 to Month 1 5 for those on 18 month contracts. The time of the d ata sets used in this study is illustrated in Fi gure 3. www . ccsenet.org/ibr International Business Research V ol. 8 , No. 6; 2015 229 Figure 3. T ime window of data sets T able 2. Desc ription of data sets ’ variables Category V ariable Name Description Demog raphics Lifestage _Segment Subscribers ’ age stage and gender Gender Subscribers ’ gender Post_Code Post code in whi ch subscribe rs live Cost Package_Cost Cost of the package of serv ices chosen by subscriber s Contract_L ength Number of mon ths of the contrac t T enure Number of mon ths with the prese nt mobile oper ator Features/Market ing T ariff The package of services chosen by subscriber s Device_De sc Handset model a nd manufacture r sales_channel The first channel where the relationship with the customer was established Usage Leve l Q2_bytes Data usages in t he second quarter Q3_bytes Data usages in t he third quarter Q2_voice V oice usages in the second quarter Q3_voice V oice usages in the third quar ter Customer Se rvices No_of_Repairs Number of time s handset has bee n in for repair in a 12-month period Prob_Handset Known issues w ith existing ha ndset No_of_Complain ts Number of custome r complaints re garding billing in a 12 month pe riod 4.2 Data Preparation The data preparation phase produces the final d ata sets fo r models. T he main goal of data prep aration is to enhance data quality a nd improve data anal ysis perfor mance. Data prepar ation needs to be ca rried o ut in a more iterative manner until a co nclusive outco me is reached. In this study , data preparation processes include: • Imputation of the missing values; • Discretisation of numerical variables ; • Transformation fro m one set of discrete values to a nother ; • Feature selection of the most informative variables ; • New variable derivation. Imputation p rocess involves replacing missing values with co mplete in formation based on an estimate fro m completed values. Creating new variables from the data is based on discreti sation and transfor mation. T wo new variables were formed to mea sure voice a nd cha nge i n data usage. T he per formance res ults o f t he exper iments show t hat models with selected features outperfor m t hose with full feature sets. In spite of the fact that the data sets used in this stud y have few variables, a feature selection pro cess performed involved three steps: www . ccsenet.org/ibr International Business Research V ol. 8 , No. 6; 2015 2 30 1) Feature screening by deletin g unreliable variables. Two variables (i.e., proble m_handset and no_of_complaint) were re moved from the feat ure list because they had ver y little variation. 2) Feature ranking b y sorting t he rest o f variables b ased on their importance a nd correlation with t he dependant variable. 3) Feature selection b y choosing the most i mportant variables and re moving others. 4.3 Modellin g In this pha se, lo gistic r egression and decision tree techniq ues were applied and their parameters were calibrated to o ptimise values. IBM SP SS Mod eller ( formerly Clementine) was used to build and experi ment with those techniques. 4.4 Logistic Reg r ession Analys is A model can be marked ‘ goo d ’ when having a 25 % higher classification accurac y rate than t he propo rtional by chance acc uracy rate (Costea & Ekl und, 20 03). T he logistic regression analysis was sta rted by computi ng t he proportional by cha nce accurac y rate based on calc ulating the pro portion of cases for each group (c hurn and non-churn). T he propor tions of the no n-ch urn and the churn gro ups are p resented in T able 3. The proportional by chance acc uracy rate was then co mputed b y squaring and summarising the proportion of cases in each group. The logistic regressio n acc urac y rates are 25 % higher than the propo rtional by cha nce accurac y rate. As a r es ult, the classification acc uracy criteria are satisfied and the logistic r egression model perform s better than a rando m guess. A relatio n between the dep endent variable (i.e., pro bability of churn) and combination o f independent variables is veri fied. The indep endent variables have been added to the analysis and the statistic al significance of the model chi -square at step 1 ha s bee n checked. The probabilities of the models ’ chi-squares for both data sets were less th an or equal to the level of significance of 0.05. The null hypothesis was accor dingly rejected . T he existence of a relations hip between the independen t variables and the dep endent variable was thus supported . T able 3. The proportional by chance acc uracy rate Data set Proportion of ch urner Proportion of non-churner Proportional by chance Logistic regr ession model accuracy rate Dataset 1 0.5277 0.47220 0.5176 0.681 Dataset 2 0.499 0.5033 0.5023 0.642 Multicollinearity is a potential issue in logistic regres sion th at is d etected b y examining t he standard erro rs of the B co ef ficients. An erro r larger than 2.0 indicates numerical p roblems (Miner et al., 2009 ). No ne of the independent variables in t his anal ysis had a stand ard error lar ger than 2.0. As a resul t, multicollinearity was not a concern in this study . W e present the result s o f the first data set as the a nalysis gave very similar results for t wo data sets. Figure 4 sho ws the buil t mode l for logistic regre ssion. T he s tream presents data operations perfor med on t he ra w data. Each oper ation is represented b y an icon or node. The n odes are linked together in a strea m representing the flow of data through eac h op eration. T he classificatio n table for the best performing l ogistic regre ssion m odel based on the classificatio n c ut-o ff of 0.5 and 95% confidenc e intervals (CI for exp (B)) is shown in T ab le 4. T he classification table register s correct and not c orrect estimations. T able 4. The logistic regression clas sification table Observe d Predicted Flag Correct Per centage No Y es The Last step Flag No 5183 1294 80.0 Y es 2175 2226 50.6 Overall Pe rcentage 68.1 www . ccsenet.org/ibr International Business Research V ol. 8 , No. 6; 2015 231 T able 5 lists the B parameter, w ald statistics, degree o f freedom, significance levels and odd ratio . The W ald statistics and th e co rresponding signi ficance level test the statistical si gnificance of ea ch coefficient (B). If the W ald statistic is significant ( i.e. less than 0.05), the variable is sig nificant. Exp (B) values in T ab le 5 are the results of testing the risk of customer churn. Exp (B ) is the predicted change in odd s for a unit i ncrease in the corresponding indep endent variable. If odds ratio is less than 1, a decr ease happ ens in odds. Other wise, a n increase happens in od ds. If Odds ratio is 1.0, the independent variable d oes not affect the dependant variable. Figure 4. Data stream for the logistic regre ssion model T able 5. Logistic regre ssion analysis results of t he first step B S.E. W ald df Sig. Exp(B) Step 1 a CNTR_L ENGTH .084 .009 79.717 1 .000 1.087 Gender .050 .050 .972 1 .324 1.051 no_of_repairs -.220 .072 9.282 1 .002 .803 Cost -.002 .002 1.343 1 .247 .998 billing_querie s -.057 .062 .830 1 .362 .945 T enure -.026 .003 97.216 1 .000 .974 Coverage -.289 .052 30.309 1 .000 .749 chang_data_usage -.159 .048 10.781 1 .001 .853 chang_voice_us age -.943 .081 133.980 1 .000 .390 bundle_avr_usag e -.106 .069 2.358 1 .125 .900 Constant .853 .247 1 1.946 1 .001 2.347 All o f the variables with hig her significance level ( more than 0.0 5) are eliminated fro m the m odel. Then, the logistic regressio n model is applied pr ogressively throu gh several iterations to elimin ate all non-significant variables. T able 6 shows all the signi ficant variables, whic h were included in the final logi stic model. T able 6. Logistic regre ssion analysis results of t he last step B S.E. W ald df Sig. Exp(B) Step 6 cntr_length .085 .009 85.360 1 .000 1.089 no_of_repairs -.217 .072 9.088 1 .003 .805 tenure -.027 .003 105.587 1 .000 .974 Coverage -.292 .052 31.086 1 .000 .747 chang_data_usage -.162 .048 1 1.193 1 .001 .850 chang_voice_us age -.973 .079 152.903 1 .000 .378 Constant .735 .217 1 1.461 1 .001 2.085 www . ccsenet.org/ibr International Business Research V ol. 8 , No. 6; 2015 232 4.5 Decision T r ee Analysis Customer churn behaviour was inv estigated by creati ng a d ecision tree m odel. Three decision tree algorithms (CAR T , C5.0 and CHAID) were utilised to evaluate their performance. T he accuracy rates of t he d ecision tree were 68.57 % with respect to CAR T , 68.83% with respect to the CHAD a nd 70 .25% with respect to the C5. The results of C5 are disc ussed i n more d etail as it has the best pr edictive per for mance. The decision tree co nstructed using C5 model is shown in Figure 7 . The most important independent varia bles are cntr_length, chang_voice_usage and tenure. Ranking independen t variables based on their importance has be en sho wn to be consistent with the logi stic regression results. Figure 5. Data strea m for the decision tree model 5. Model Eva luation and Discussion From a data-anal ysis perspective, t he models presented i n the last sectio n were chosen based on the quality of their o utputs. In the evaluat ion p hase, a perfor mance co mparison of the di ff erent modell ing techniques i s car ried out. A decision o n which modellin g technique to be a dopted for deploying the final custo mer churn model should be taken at the end of this phase. AUC, RO C curve, to p -decile and overall accuracy ar e used here to compare the performance of the modelling techniq ues. Based on the evaluation pr ocesses, t he limit at ions of d ata m ining in customer churn anal ysis are discussed. Figure 6 depicts t he RO C curve for three decision tree s and one logistic regression models. T able 7 presents the three evaluatio n metrics adopted in this stud y . Fig ure 6 and T able 7 p roves tha t decision trees and C5 outper for m the logistic r egression m odels. T hese results ar e consistent with some pr ior literature (e.g., Bakır et al., 2009) , having in mind that achieving fair co mparison is difficult b ecause of the diff erence in the data sets use d. T his study sug gests decision tree analysis as a potentially valuab le to ol for churn prediction based on the evaluation results and the data sets u sed. T able 7 shows that C5 model outperforms all other models, including the Logistic Re g. (2) model devel op ed by a data analytics team working for the mobile operator . C5 m odel in Figure 7 shows a lift value of 1.598 at 30 percentile. T o explain, C5 model ca n capture about 16% o f the churners in the top 30% of a sorted list of churned customers. www . ccsenet.org/ibr International Business Research V ol. 8 , No. 6; 2015 233 Figure 6. The ROC curve of d ecision trees and logistic regression models T able 7. Mo del evaluation metrics Model Lift (top 30%) Area under curve Overall accur acy C5 1.598 0.763 70.25 CHAD 1.584 0.710 68.83 CAR T 1.409 0.603 68.57 Logistic Reg. 1.218 0.723 68.1 Logistic Reg.(2) 1.4 - 67.5 Figure 7. The C5 decision tree model www . ccsenet.org/ibr International Business Research V ol. 8 , No. 6; 2015 234 6. Limitations of Da ta Mining in Customer Retention Analysis The results the d ata mining models are reported in this paper prove that prediction accuracy can b e im proved further b y fine tuning model par ameters. Specifically , the experimental res ults show that the pred iction accuracy of the models develop ed has i mproved ac curacy by 1 -3% compared to that achieved b y the mobile o perator . Although data mining is an advanced custo mer churns analysis too ls, the following poten tial limitations to its u se exist: 1) There is no direct v alue explanation of these p atterns. Skilled data mining professionals are needed to provide such an expla nation (Friedl & Bro dley, 1997). 2) Although data mining links between variables and customer behaviours, it fails to identify the causal relationships bet ween variable s (Cook & Weisberg, 1982). D ecision trees can be used in some cases to infer causal relationships. 3) Data mining models have a relatively short expir y life. The mobile m arket faces ne w t echnologies on a daily bases. As a result, histor ical data b ecome less valuable for predictions. 4) Churn relates to co mplex interactions within populatio n. Examining all the factors a ffecting c ustomer ch urn simultaneously and j ointly by building a model is not a pplicable. 5) The level of the a nalysis in t he data mining models d ecreases the ability to captu re the heterogeneity o f the customers. Ne w tech niques are thus required to suppo rt custo mer churn anal ysis to bypass the cons o f the data mining techniques. T able 8 lists the limitations of using data mining tools in customer churn analysis and describ es the general requirements to o vercome the m. Agent -Based Mo delling and Si mulation (ABMS) technique is a mong t he techniques t hat ha ve the potential to advance the custo mer churn anal ysis and o vercome so me of the li mitations of data m ining (P aul & Cadman, 2 002 ). ABMS is an emerging means of si mulating b ehaviour and examining behavioural consequences. ABMS is a computational model for simulating the actions an d interactions of autonomous individuals i n a network, with a view to assessing their e ffects on t he s ys te m as a whole. I n o utline, agents represent custo mers and agent relationship s represent pr ocesses of agent interaction . T able 8. D ata mining limitations in custo mer churn analysis No. Description of the limitation How to ove rcome it 1 Explanation of the v alue and the sig nificance of t he patterns and relationships necessitate skilled data mining profe ssionals Provide an easy and intuitive way to explain the value and the significance of re lationships betw een variable s 2 Low e fficiency of identify ing causal rel ationship Enhance the a bility of identify ing causal re lationships 3 Short expiry date and the depe ndency on data quality Offe r to ols for long-term planning, and minimise the dependency on data quality 4 Neglecting custome rs ’ interactions Include custome r interaction i n customer churn analysis 5 Cannot captures t he heteroge neity of custome rs Offe r tools that take ac count of the hete rogeneity of customers 7. Conclusion Many mobile operator s have used data mining techniques such as regre ssion and decision trees to overcome churn p roble ms. The e xperimental results cond ucted in this stud y s how that the decisio n t ree model outperfor ms all the logistic regression mod els exa mined, including the model develop ed by a d ata analytics team working in the mobile o perator . The decision tree model produces a lift value of 1.598 at 30 percentile compared with 1.4 at the same percentile p roduced by the d ata analytic s tea m. For this pro bl e m and for similar data sets, therefore, the conclusion is that d ecision trees are a preferable technique for investigating custo mer ch urn. Mo re reflectively , although data mining provides ver y useful i nsight into c ustomer churn, limitations ar e app arent in relatio n to significance, ca usality , d ata e volution, model co mplexity an d aggregation. In ord er to overcome t hese li mitations new ways of understanding and exploring data may b e helpful - Agent Based Mo delling Simulation (ABMS) provides one such aven ue for more complex i nvestigations o n customer retention. www . ccsenet.org/ibr International Business Research V ol. 8 , No. 6; 2015 235 References Abbasi, M. S., T arhini, A., Hassouna, M., & Shah, F . (2015). Soc ial, organizational, demograp hy and individuals ’ technology accep tance behaviour: A co nceptual model. European Scien tific Jou rnal, 1 1 (9), 48 -76. http://eujournal.org/index.php/esj /article/view/5279 Ahn, J . H., Han, S. P. , & Lee, Y . S. (2 006). Customer churn anal ysis: Churn deter minants and mediation e ffects of par tial d efection in the Ko rean mobile teleco mmunications ser vice indu stry . T elecomm unication s Po licy , 30 (10), 552-568. http://dx.do i.org/10.1016/j.telpol.2006.09.006 Alenezi, H., T arhini, A., & Masa ’ deh, R. (2015). Investigating the Stra tegic Relat ionship betw een Infor mation Quality and E-Government Benefits: A Literature Re view . International Review of Social Science s and Humanities , 9 (1 ), 33 - 50 . http://www .irssh.co m/volumes/vol_9_no_ 1_april_2015 Amin, A., Khan, C., Ali, I. , & Anwar, S. (2014). Custo mer churn prediction i n telecommunication indus try: With and without counter-example. Natur e-Inspired Computation and Ma chine Learning (pp. 206 -218). Springer . http://dx.doi.org/10.1007/9 78-3- 319 - 13650 -9_19 A ydin, S., & Ö zer , G. (2005). The anal ysis o f antece dents of custo mer lo yalty in t he Turkish mobile telecommunication market. Eur op ean J ournal of Marketing , 39 ( 7), 910-925. http://dx.doi.org/10.1 108/0309056051 0601833 Bakır , B., Batmaz, İ., Güntürkün, F ., İpekçi, İ., Köksal, G. , & Ö zd emirel, N. (2009). Defect cause modeling with decision tree and regressio n analysis. Relation , 24 (1), 1- 4. Bin, L., Peiji, S., & J uan, L. (20 07) . Customer chu rn prediction ba sed on the decision tree in p ersona l handyphone system service . In 2007 Internatio nal Conference on Ser vice Syste ms and Service Management (pp. 1-5). IEEE. http://dx.doi.org/10.1 109/ICSSSM.2007.428 0145 Burez, J., & V an den P oel, D. (2007). CRM at a p ay -TV co mpany: Using analytical models to r educe c ustomer attrition b y targeted marketing for subscrip tion services. Expert Systems with Applications, 32 (2) , 277-288 . http://dx.doi.org/10.1016/j.eswa.2005 .1 1.037 Chapman, P ., Clinton, J., Kerber, R., Khabaza, T ., Reinartz, T ., Shearer, C. , & Wirth, R. (2000). CRISP -DM 1. 0 Step- by -step data mining guide. Cook, R. D., & W eisberg, S. (1982). Criticism a nd influence anal ysis in regression. Sociological Meth odology , 13 (3), 313-361. http://dx.doi.org /10.230 7/270724 Costea, A., & Ekl und, T . (2003). A two-level a ppr oach to making cla ss predictions, system scien ces . P roceedings of the 36th An nual Hawaii IE EE International Conference ( pp. 1 - 9) . Hawaii. De, A., Subb iah, S., & V e gi, S. R. ( 2014) . Metho ds for managing telecommunica tion service and devices thereof . Google Patents. El -Masri, M., & T ar hini, A. (20 15). A design scien ce approach to gamify educ ation: F r om games to pla tforms . T wenty-Third Europea n Conference on Infor mation Systems (ECIS) (pp. 26 - 38 ). Mü nster , Ger many . Faris, H., Al-S hboul, B. , & Ghatas heh, N. (2014 ). A gen etic pro gramming based frame work for c hurn pr ediction in telec ommunicatio n industry . Computational Collective Intelligence , T echn ologies and App lications (pp. 353 -362). Springer . http://d x.doi.org/10.1007/978 -3- 319 -1 1289- 3_36 Farquad, M. , Ravi, V ., & Raju , S. B. (2014). Churn p rediction u sing co mprehensible s upport vector machine: An analytical CRM application. A pplied Soft Compu ting, 19 (1), 31-40. http://dx.doi.org/10.1016/j.asoc.201 4.01.031 Friedl, M. A., & B rodley , C. E. (1997). Decision tree classification of la nd co ver from remotely sensed data. Remote Sen sing of Environment, 61 (3), 399-409. http://dx.do i.org/10.1016/S0034 -4257(97)00049 -7 Glady , N., Baesens, B ., & Croux, C. (2009 ). Modeling chur n using cus tomer lifeti me value. European Journal of Operationa l Resear ch, 197 (1), 402-411 . http://dx.doi.org/10.1016 /j.ejor .2008.06.027 Han, S. H., Lu, S. X., & Leung, S. C. (201 2). Segm entatio n of telecom customers based on customer value b y decision tree model. Exp ert Systems with Application s, 39 (4), 3964-3973. http://dx.doi.org/10.1016/j.eswa.2011.09.034 Hassouna, M. , & Arzoky , M. (2011). Agent based modelling and simulation: T oward a new mo del o f cu stomer r etention in the mobile market. Proceedings o f the 2011 Summer Computer Simulatio n Co nference ( p p. 30 -35). Society for Modelin g & Simulation I nternational. www . ccsenet.org/ibr International Business Research V ol. 8 , No. 6; 2015 236 Hu, C., Shu, H., & Qiao, X. ( 2014) . Customer segmen tation model r esear ch based on o r ga nizational customer life cycle in telecom ope rator . 2014 International Conference on Education T echnology and Social Science , Atlantis Press. http://d x.doi.org/10.2991/icetss -14.2014.8 8 Huang, B., Kec hadi, M. T ., & Buckley , B. (2 012). Customer ch urn predictio n in teleco mmunications. Exp ert Systems with Applications, 3 9 (1), 141 4-1425. http://dx.doi.o r g/10.1016 /j.esw a.2011.08.024 Hui, L., Li, S., & Zongfang, Z. (201 3). T he model and em pirical research of application scoring b ased on d ata mining methods. Pr ocedia Comp uter Science, 17 , 91 1-918. http://dx.doi.org/10.1016/j.procs.201 3.05.1 16 Hung, S. Y ., Y en, D. C. , & W ang, H. Y . (2006). Applying data m ining to telec om c hurn management. Expert Systems with Applications, 31 (3), 515 -524. http://dx.doi.o rg/10.1016/j.eswa.2005.09.080 Karahoca, A., Karahoca, D., & A ydin, N. (2007). GSM churn managemen t using an adaptive neu r o- fuzzy infer ence system . The 2007 International Conference o n Intelligent Pervasive Computing, 200 7 , IPC (p p. 323 -326). IEEE. V alencia, Spain. http://dx.doi.org/10.1109/IPC.2007.1 19 Jonathan, L., J anghyuk, L., & Lawrence, F . (2001). T he impact of s witching co sts on the c ustomer satisfaction-loyalty link: Mobile phone service in France. Journal of Service s Ma rketing, 15 (1 ), 3 5-48. http://dx.doi.org/10.1 108/08876040110381463 Liu, D. S., & Fan, S. J. (2014). A mod ified decisio n tree algor ithm based on genetic al gorithm for mobile user classification prob lem. The Scientific W o rld Journal , (1) . http://dx.doi.org/10.1 155/2014/468324 Masa ’ deh, R., T ay eh, M., Al-Jar rah, I. M., & T arhini, A. (2015 ). Accounting vs. market -based measures of firm performance related to information technology inv estments. International Review of Social Scien ce s and Humanities , 9 (1 ), 129-145. http://www .irss h.com/volumes/vol_ 9_no_1_april_20 15 . Masa ’ deh, R., T arhini, A., A l -Dmour , R. H., & Obeidat, B. Y . (2015). Strategic IT -bu siness alignment as managers ’ explorative and explo itative strateg ies. European Scientific Journal, 11 (7), 437- 457 . http://eujournal.org/index.php/esj /article/view/5334 Masa ’ deh, R., Obeidat, B. Y ., Al -Dmour , R. H., & T ar hini, A. (2015 ). Kno wledge manage ment strategie s as intermediary variables betwee n IT -business strategic a lignment and firm p erforma nce. Eur opean Scientific Journal, 1 1 (7), 344- 368 . http://eujournal.org/index.php/esj/article/view/53 McIlroy , A., & Barnett, S. ( 2000). Building c ustomer relationships: Do d iscount cards work? Managing S ervice Quality , 1 0 (6), 347 -355. http://dx.doi.org/10.11 08/0960452001 0351491 Migué is, V . L., V an den P oel, D., Ca manho, A. S. , & Falcã o e Cunha, J. (2012). Mo deling partial custo mer chur n: On the v alue of first product-categor y purchase sequences. Expert Systems with Applications, 39 (12) , 1 1250-1 1256. http://dx.doi.o rg/10.1016/j.eswa.2012.03.073 Nie, G., Rowe, W ., Zhang, L., Tian, Y ., & Shi, Y . (2011). Credit card churn forecasting b y logistic regre ssion and decision tree. Expert Systems with Appli cations, 38 (1 1), 15273-152 85. http://dx.doi.org/10.1016/j.eswa.2011.06.028 Miner , G ., Nisbet, R., & Elder, IV . J. (2009). Handbook of statistical an alysis and d ata minin g applications . Academic Press. Oliveira, V . L. M. (201 2) . An alytical custo mer r elationship manag ement in r etailing supported by d ata mining technique s . Universidade do Porto . Ordenes, F . V ., Theodoulidis, B ., Burton, J., Gruber, T . , & Zaki, M. (2014). Analy zing customer experience feedback using text minin g: A linguistics-based approach. Jou rnal of Service Research , 10 (1), 242- 256 . http://dx.doi.org/10.1 177/1094670514 524625 Orozco, J., T arhini, A., Masa ’ deh, R., & T arhini, T . (2015). A framework o f IS/busine s s alig nment management practices to im prove the d esign o f IT Governance architectures. Internationa l Journal of Business and Managemen t, 10 (4), 1 -12. http://dx.doi.org/10.5539/ijbm.v10n4p1 Orozco, J., El-Masri, M., & T arhini, A., T arhini, T . (2015 ). The Impact of IS-Business A lignment Prac tices on Organizational Choice of IS-Busi ness Alignment Strategies . The 19th Pacific Asia Confer ence on Information S ystems (P ACIS 2015 ), Singapore, 6 -9 July 2015. Paul, T ., & Cadman, R. (200 2). Agent -based modeling of c ustomer behavior in the teleco ms and media marke ts. Info, 4 (1) , 56-63. http://dx.doi.org/10.1 108/1463669021042664 0 Rahman, A., Kumar , S., Fazal, S., & Siddiqui, M. A. (2012). Assessment of land use/land co ver change i n the www . ccsenet.org/ibr International Business Research V ol. 8 , No. 6; 2015 237 north-west district o f Del hi usin g remote sensi ng and GI S techniques. Journal o f the Ind ian Society o f Re mote Sensing, 40 (4), 689 -697. http://dx.doi.org/10.1007/s12524 -011-0165-4 Ren, J., Ning, Z., Kir kness, C. S., Asche, C. V . , & W ang, H. ( 2014). Risk of u sing lo gistic regression to ill ustrate exposure-response relationship of infectious diseases. BMC Infectiou s Diseases, 14 (1), 540. http://dx.doi.org/10.1 186/1471 - 2334 - 14 - 540 Rudin, C., & W agstaff, K. L. (20 14). Machine learning for science a nd society . Ma chine Learnin g, 95 (1), 1-9. http://dx.doi.org/10.1007/s10994 - 013 - 5425 -9 Seo, D., Ranganathan, C., & Babad, Y . (2008). T wo-level model of customer retention in the US mobile telecommunications service market . T e lecommu nication s Policy , 32 (3 ), 18 2-196. http://dx.doi.org/10.1016/j.telpo l.2007.09.004 Shaw , M. J., Subramaniam, C., T an, G. W . & W elge, M. E . (2001). Knowledge management and data mining for marketing. Decision S upport Systems, 31 (1), 127 -137. http://dx.doi.org/10.1016/S0167 -9236( 00)00123 -8 Su , Q. (2014 ). Research of i nstrument to m easure customer perceived service quality o f mobile data services. Internationa l Journal of Networking and V irtual Or ganisations, 14 (1), 176 -196. http://dx.doi.org/10.1504/IJ NVO.2014.065101 Su, Q., Shao, P ., & Y e, Q. (2012). T he analysis on th e det er min ants of mobile VIP customer churn: A logistic regression approach. Internationa l Journal of Services T echnolo gy a nd Management, 18 (1), 61-74. http://dx.doi.org/10.1504/IJ STM.2012.049016 T arhini, A., Ammar , H., T arhini, T. , & Masa ’ deh, R. (201 5). Anal ysis of t he critical success factors for enterprise resource planning imple mentation fro m stake holders ’ persp ective: A systematic revie w . Internationa l Business Research , 8 (4), 25-40. http://dx.doi.org/10.5539 /ibr .v8n4p25 Ta rhini, A., T eo, T ., & T arhini, T . (2015 ). A cross-cultural validit y of the E-learning Accept ance Measure (ElAM) in Lebanon and England: A co nfirmatory factor analys is . Education and Information T ec hnologies . http://dx.doi.org/10.1007/s10639 - 015 - 9381 -9 T arhini, A., Fa kih, M., Arzoky , M. , & T ar hini, T . (2015 ). Designing guideli nes to disco ver causes of dela ys in construction pro jects: The case of Lebanon. I nternationa l Business Resear ch, 8 (6). T arhini, A ., Hasso una, M., Abbasi, M. S. , & Orozco, J. (2015 ). T owards th e ac ceptance of RSS to support learning: An e mpirical study to validate the technology acceptance model in Lebanon. Ele ctr onic Jo urnal of e-Learning , 13 (1), 30- 41 . Retrieved fro m http://www .ej el.org/volume13/issue1 T arhini, A., Scott, M., Shar ma, K. S., & Abbasi, M. S. (2015e). Diff erence s in inte ntion to use educat ional RSS feeds between Lebanese and British S tudents: A multi ‑ group analysis based o n the technology ac ceptance model . Electr onic Journ al of e-Lea rning, 13 (1 ), 14-29. Retrieved fro m http://www .ejel. org/volume13/issue1 T arhini, A., Hone, K., & Li u, X. (20 14a). A cross -cultural exa mination of the impact o f social, organizational and individual factors on technology acceptance bet ween British and Lebanese university stu dents. British Journal o f Educational T ech nology . http://dx.doi.org/10.1 1 1 1/b jet.12169 T arhini, A., Hone, K., & Liu, X. (2014b). T he effects o f ind ividual di f ferences o n e -learning users ’ be haviour i n developing co untries: A structural equatio n model. Comp uters in Human Behavior , 41 , 153-163. http://dx.doi.org/10.1016/j.chb.2 014.09.020 T arhini, A., Ho ne, K., & Liu, X. (2014c). Meas uring the moderating effect of gender and age on e-lear ning acceptance in England: A structural equation modellin g approach for an exten ded technology acceptance model. Journal o f Educationa l Computing Resea r ch, 51 (2), 163 -184. http://dx.doi.org/10.2190/EC.5 1.2.b V uk, M., & Curk, T . ( 2006). ROC curve, lift chart and calib ration plot. Metodolo ˇski Zvezki, 3 (1 ), 89-108. W ei, C. P. , & Chiu, I. (2002) . Turning teleco mmunications call details to churn prediction: A data mining approach. Expert Systems with App lications, 23 ( 2), 103-11 2. http://dx.doi.org/10.1016/S0957 -4174 (02)00030-1 Copyrights Copyright for this article is r etained by the author(s), with first publication rights granted to the journal. This is an open-acces s article distributed u nder the terms and condition s of t he Creative Co mmons Attribution license (http://creativeco mmons.org/licenses/by/3.0/).
Original Paper
Loading high-quality paper...
Comments & Academic Discussion
Loading comments...
Leave a Comment