Dynamic Question Ordering in Online Surveys
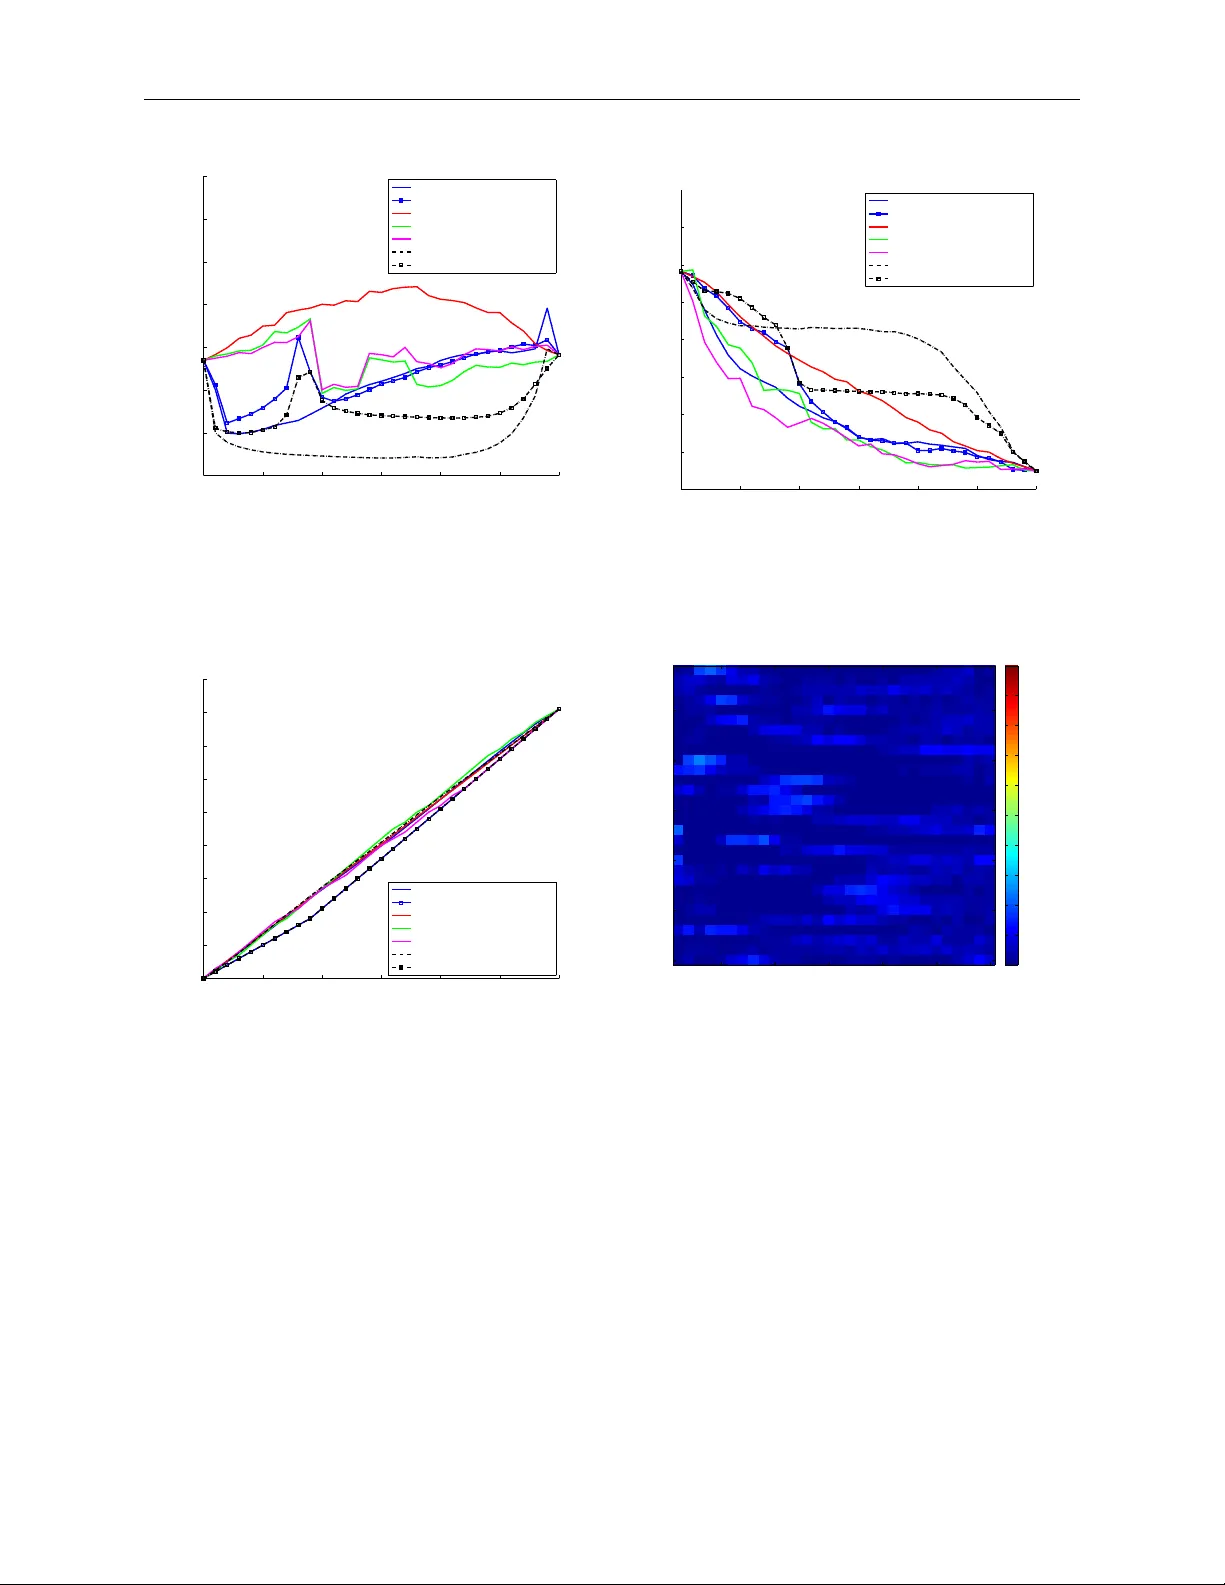
Online surveys have the potential to support adaptive questions, where later questions depend on earlier responses. Past work has taken a rule-based approach, uniformly across all respondents. We envision a richer interpretation of adaptive questions…
Authors: Kirstin Early, Jennifer Mankoff, Stephen E. Fienberg
Dynamic Question Ordering in Online Surv eys (In submission to Journal of Official Statistics) Kirstin Early Mac hine Learning Department Carnegie Mellon Univ ersity 5000 F orb es Av enue Pittsburgh, P A, 15213 kearly@cs.cmu.edu Jennifer Mank off Human-Computer In teraction Institute Carnegie Mellon Univ ersity 5000 F orb es Av enue Pittsburgh, P A, 15213 jmankoff@cs.cmu.edu Stephen Fien b erg Departmen t of Statistics Carnegie Mellon Univ ersity 5000 F orb es Av enue Pittsburgh, P A, 15213 fienberg@stat.cmu.edu Abstract Online surveys ha ve the p otential to supp ort adaptive questions, where later questions dep end on earlier resp onses. P ast work has tak en a rule- based approac h, uniformly across all resp onden ts. W e en vision a ric her in terpretation of adaptiv e questions, whic h we call dynamic question or- dering (DQO), where question order is p ersonalized. Suc h an approach could increase engagemen t, and therefore resp onse rate, as w ell as imputa- tion quality . W e presen t a DQO framework to improv e survey completion and imputation. In the general survey-taking setting, we w ant to maximize surv ey completion, and so we fo cus on ordering questions to engage the re- sp onden t and collect hop efully all information, or at least the information 1 In submission to Journal of Official Statistics that most c haracterizes the resp onden t, for accurate imputations. In an- other scenario, our goal is to provide a p ersonalized prediction. Since it is p ossible to give reasonable predictions with only a subset of questions, we are not concerned with motiv ating users to answ er all questions. Instead, w e wan t to order questions to get information that reduces prediction un- certain t y , while not b eing to o burdensome. W e illustrate this framework with an example of pro viding energy estimates to prosp ectiv e tenan ts. W e also discuss DQO for national surv eys and consider connections betw een our statistics-based question-ordering approach and cognitive survey metho dol- ogy . 1 In tro duction Surv ey resp onse rates ha v e been falling for decades, leading to results that do not nec- essarily represent the full p opulation of interest [29]. Online surveys tend to hav e muc h lo wer resp onse rates than traditional mail-out/mail-bac k and telephone surv eys [32]. Unlik e these traditional-st yled surveys, online surveys can easily supp ort adaptive question order- ing, where the order of later questions dep ends on resp onses to earlier questions. P ast work in adaptive questions for online surv eys has taken a rule-based, question-specific approac h where a certain resp onse to a certain question leads to a new set of questions, uniformly across all resp onden ts ( e.g. , [28, 3]). W e envision a richer in terpretation of adaptiv e ques- tion ordering, where question order is dynamic and p ersonalized to the individual resp onden t, dep ending on their previous answ ers. Suc h a dynamic question-ordering approac h has the p oten tial of increasing engagement, and therefore resp onse rates, as w ell as the qualit y of imputation for missing v alues. In addition to the use of surveys to gain insigh ts ab out general p opulations, w e can use surv ey results to giv e useful information to individual resp ondents. W e consider a re- sp onden t’s answering a sequence of questions to receiv e a p ersonalized estimate as a type In submission to Journal of Official Statistics of surv ey to o. An example of such a survey is a carb on calculator, where a user pro vides information ab out their home infrastructure and energy consumption to get an estimate of their carb on fo otprin t [27]. Here the resp onden t receiv es useful information from the surv ey , has a p ersonal incen tive to complete the survey , and likely self-selects into the surv ey . It is p ossible that the user do es not need to answer all questions to get an accurate estimate of their carb on fo otprint; for some users, certain features will b e more relev an t than for other users. W e can lo w er the cost (to users) of pro viding answers by ordering the questions so that the most informative questions for a particular user are ask ed first. W e presen t a general framew ork for dynamically ordering the questions that make up a survey questionnaire, based on previous resp onses, to engage respondents, and improv e surv ey completion and imputation of unkno wn items. Our work considers t wo scenarios for data collection from survey-tak ers. In the first, w e wan t to maximize survey completion (and the quality of necessary imputations) and so w e fo cus on ordering questions to engage the resp onden t and collect hop efully all the information we seek, or at least the information that most c haracterizes the resp onden t so imputed v alues will b e accurate. In the second scenario, our goal is to giv e the resp ondent a p ersonalized prediction, based on information they pro vide. Since it is p ossible to giv e a reasonable prediction with only a subset of questions, we are not concerned with motiv ating the user to answer all questions. Instead, w e wan t to order questions so that the user provides information that most reduces the uncertain ty of our prediction, while not b eing to o burdensome to answer. An y statistics-based approach to dynamic question ordering of the sort we consider here w ould seem to run coun ter to traditional argumen ts that questionnaires should hav e a fixed structure for all resp onden ts and when the same quan tities, e.g. , unemploymen t or p o vert y , are measured by surveys ov er time. Just ov er thirty years ago, the cognitive asp ects of surv ey metho dology (CASM) mo vemen t, e.g. , see [18, 35, 36], made the argument that this traditional approach to surv ey design shackled resp ondents and often preven ted them from pro viding the very answers that the survey metho dologists sought for their questions, e.g. , In submission to Journal of Official Statistics see [34, 36]. W e b elieve our approac h reop ens the do or to the arguments raised b y that mo vemen t, but in a v ery differen t manner, and somehow surv ey statisticians will ultimately need to blend the lessons from the CASM mo v emen t with the needs for cost-driven dynamic ordering. The remaining sections of the pap er are as follo ws: first, in Section 2, w e review re- lated w ork in question ordering from a v ariety of fields. Then, in Section 3, we jump into a sp ecific formulation of dynamic question ordering (DQO) from a pro ject to provide p erson- alized energy estimates to prosp ectiv e tenants, drawing on data from the Residen tial Energy Consumption Survey [44]. Our approac h mak es useful, individualized predictions of energy usage at under 30% of the cost of the full-feature mo del. In Section 4 w e formalize and generalize the DQO framework, b ey ond the particular application in the previous section. In Section 5 we set forth a broader view of the forms dynamic question ordering can take in other national surveys and suggest how they migh t b enefit from a dynamic question-ordering approac h. Finally , in Sections 6 and 7 we summarize our con tribution and note av enues for future w ork in this area. 2 Some Related W ork There is a rich literature focusing on adaptiv ely ordering questions to improv e outcomes while minimizing resp ondent burden, across multiple fields. Examples include adaptiv e design in surv ey metho dology , adaptiv e treatmen t design in medical statistics, adaptive testing in educational researc h, and test-time feature selection in mac hine learning. 2.1 Adaptiv e Surv ey Design Adaptiv e surv ey design (ASD) attempts to improv e surv ey qualit y (in terms of achieving a higher resp onse rate or lo wer error) by giving respondents custom survey designs, rather than the same one [31]. Usually ASD tries to minimize nonresp onse, and designs inv olve In submission to Journal of Official Statistics factors like num b er of follo w-ups, which can b e costly . The general technique is to maximize surv ey quality while k eeping costs b elow a budget. Often in ASD, c hanges in survey design happ en b et ween phases of the survey , where the exact same surv ey proto col ( e.g. , sampling frame, surv ey mo de, measurement conditions) is in place within a phase and results from that phase inform c hanges to the proto col for the next phase. Grov es and Heeringa [14] introduce an approac h they call resp onsiv e survey design, which uses indicators of the cost and error of design features to make decisions ab out ho w to change the surv ey design in future phases and then combines data from all phases into a final estimator. They also in tro duce the concept of phase c ap acity —once a stable estimate has b een reached in a design phase, it is unlikely that exp ending more effort in that phase will result in a b etter estimate. Their definition of “effort” fo cuses on collecting participan ts for each phase. They prop ose the use of error-sensitive indicators to identify when a phase has reached capacit y and no more participants need to b e recruited for that phase. This notion of phase capacit y could extend to reaching a stable estimate of a participan t’s survey- answ ering, and no more questions need to b e ask ed. 2.2 Adaptiv e T reatmen t Strategies In the field of medical statistics, adaptive treatment strategies (also called dynamic treat- men t regimes) contin ually adjust treatments, according to decision rules, dep ending on an individual’s resp onses to previous treatments as w ell as c haracteristics of the patien t [7]. This tec hnique contrasts with the research standard of randomized controlled trials, but more closely matc hes real-world practice of medical interv en tion (since, when a treatmen t fails for a particular patien t, that patien t is reassigned to a new treatmen t, based on ho w they reacted). Adaptiv e treatmen t strategies are targeted for an individual , rather than basing future treatment decisions on outcomes of previous patients. The design of the sequen tial m ultiple assignmen t randomized (SMAR) trial [25] c ho oses a decision to mak e at eac h p oin t according to what action will maximize the exp ected treatment In submission to Journal of Official Statistics outcome, given past information that has o ccurred. SMAR trials randomize individuals to differen t treatments at eac h decision time p oint. Adaptiv e treatment strategies ha v e b een applied to treat depression, with the ST AR*D (sequenced treatmen t alternatives to relieve depression) treatment [30], in whic h patien ts who did not resp ond to less-intensiv e therapies were randomly assigned to more intensiv e treatmen ts at higher lev els; to treat sc hizophrenia, with the CA TIE (clinical antipsyc hotic trials of in terv ention effectiveness) design [33], a three-phase study where patients were ran- domly assigned to new treatmen ts at successiv e phases if they did not resp ond to earlier treatmen ts; to treat adv anced prostate cancer [45] by randomizing nonfav orably-resp onding patien ts to untried c hemotherapy treatmen ts at eight-w eek in terv als, up to four times; and man y other medical settings ( e.g. , smoking cessation [6], p ediatric generalized anxiet y dis- orders [1], and mo o d disorders [22, 21]). 2.3 Adaptiv e T esting F or tests that measure ability or aptitude, adaptive testing selects test questions based on the resp onden t’s answ ers to previous questions. The goal is to measure the examinee’s ac hievemen t accurately , without making the examinee answ er to o man y questions. Adaptiv e tests hav e been sho wn to b e as reliable and v alid as conv entional tests (with static question orders), while reducing test length up to 50% [47]. Unlik e classical test theory , whic h as- sumes all questions equally indicate an assessment outcome, item response theory (IR T) [23] considers individual test questions through an item response function, the probabilit y of a correct answer b y an individual at a particular skill lev el θ . The item resp onse function has three parameters: the pseudo-c hance score lev el (how easy it is to guess the correct answer), item difficulty (how hard it is to answer the question), and discriminating p o wer (how muc h the skill level influences question resp onse). According to W eiss [47], an IR T-based adaptiv e testing framework has the following three comp onen ts: (1) a w a y to choose the first item to ask, (2) a w ay to score items and choose the next item to ask during test administration, In submission to Journal of Official Statistics and (3) a wa y to choose to end the test, based on an individual’s p erformance. W eiss and Kingsbury [48] in tro duce adaptive mastery testing to assess a student’s ac hiev e- men t level ˆ θ , sp ecifically ho w the estimated ac hievemen t lev el compares to a “mastery lev el,” θ m . At eac h time p oint, a question is selected whic h giv es the maxim um information at the studen t’s current estimated mastery lev el and ask ed. As the studen t answ ers questions, the estimate ˆ θ is updated, along with a confidence interv al. Once the confidence in terv al for ˆ θ no longer includes θ m , the test is finished and the studen t’s mastery lev el is assigned as sufficien t or not (dep ending if θ m lies ab o ve or b elo w the confidence in terv al for ˆ θ ). More recen tly , IR T-based adaptive testing has b een used for diagnoses of mental health disorders through patient questionnaires [12]. Their exp erimen ts sho w that their adaptive diagnosis pro cess can, in only one min ute of testing, arrive at the same diagnosis as a trained clinician in one hour. Montgomery and Cutler [24] hav e also used IR T-based adaptive test- ing, but for public opinion surveys. In an empirical study using adaptiv e testing to measure resp onden ts’ p olitical knowledge, the authors found that the adaptiv e testing approach could pro duce more accurate measurements than traditional test administration, at a 40% reduc- tion in questionnaire length. 2.4 T est-time F eature Selection In the case where survey collection is targeted tow ard the goal of pro viding the user with a personalized prediction ( e.g. , for energy consumption), at test time, the goal is to make a prediction on a new example. Making a prediction on a test instance requires gathering feature v alues, whic h can b e costly , esp ecially if it requires co op eration from users who migh t stop b efore completion. In this case, strategically ordering questions asked (based on previous answ ers) can get the most useful information first, while providing predictions on partial information. This w ay , p eople receive meaningful predictions without sp ending m uch time or effort answering questions. The test-time feature ordering problem resem bles activ e learning, whic h assumes lab els In submission to Journal of Official Statistics are exp ensiv e. Active learning algorithms strategically select whic h unlab eled p oin ts to query to maximize the mo del’s p erformance (using b oth lab eled and unlab eled data) while minimizing the cost of data collection [5]. T est-time feature ordering has a similar goal of making accurate predictions while k eeping data collection costs lo w; how ev er, rather than c ho osing an example to b e lab ele d , test-time feature ordering chooses a single fe atur e to b e enter e d (b y asking the user a question). He, Daum ´ e I II, and Eisner [16] consider the setting of test-time feature selection, where all features are av ailable for training, and at test time they wan t an instance-sp ecific subset of features for prediction, trading off feature cost with prediction accuracy . They form ulate dynamic feature selection as a Marko v decision pro cess (MDP). The p olicy selects a feature to add; the rew ard function reflects the classifier margin with the next feature, p enalized b y the cost of including that feature. Ho wev er, this method does not mak e sequential predictions, and instead only chooses whether to k eep getting features or to stop and mak e a final prediction. Kara y ev, Baumgartner, F ritz, and Darrell [20] also take an MDP approac h to classify images with a framew ork they call “timely ob ject recognition,” whic h sequen tially runs detectors and classifiers on subsets of the image and uses previous results to inform the next action to take, while pro viding the b est ob ject recognition in the a v ailable run time. Most work in test-time feature ordering does not consider the situation of pro viding predictions with partial information as questions are answered, nor do es it address the issue of giving measures of prediction uncertain ty to users. 3 Pro viding P ersonalized Energy Estimates with the Residen tial Energy Consumption Surv ey In this section, we illustrate the concept of dynamic question ordering for prediction with an application of predicting energy consumption for a prosp ective tenan t in a p otential home. Selecting homes with energy-efficient infrastructure is imp ortan t for ren ters, b ecause in- In submission to Journal of Official Statistics frastructure influences energy consumption far more than in-home b ehavior [9]. The imp or- tance of energy estimates for apartment hun ters is tw ofold. First, since ren ters often cannot mak e infrastructure upgrades for efficiency in a property they do not o wn, they need to kno w upfron t the exp ected costs of living in a ren tal unit. Second, 30% of the U.S. p opulation ren t, and ren ters mo v e on av erage ev ery t w o y ears [40]; therefore, renters can p oten tially c ho ose impro v ed infrastructure more frequently than w e can exp ect homeowners to mak e costly upgrades. P ersonalized energy estimates can guide prosp ective tenan ts to ward energy-efficien t homes, but this information is not readily av ailable. Utility estimates are not typically offered to house-h unters, and existing tec hnologies lik e carb on calculators require users to answ er (pro- hibitiv ely) man y questions that may require considerable researc h to answer. F or the task of pro viding p ersonalized utilit y estimates to prosp ectiv e tenants, w e present a cost-based mo del for feature selection at training time, where all features are a v ailable and costs as- signed to each feature reflect the difficulty of acquisition. At test time, we hav e immediate access to some features but others are difficult to acquire (costly). In this limited-information setting, we strategically order questions w e ask eac h user, tailored to previous information pro vided, to giv e the most accurate predictions while minimizing the cost to users. During the critical first 10 questions that our approac h selects, prediction accuracy improv es equally to fixed-order approaches, but prediction certain ty is higher [10]. 3.1 In tro duction Since energy consumption dep ends on home infrastructure ( e.g. , square fo otage) and o c- cupan t behavior ( e.g. , preferred temp erature), w e can learn the relationship b etw een these features and energy consumption through established datasets, like the Residential Energy Consumption Surv ey (RECS) [44]. Some information can b e extracted automatically from online ren tal advertisemen ts, while other information m ust b e pro vided b y prosp ectiv e ten- an ts at v arious costs (for example, the question of how man y windo ws a home has requires In submission to Journal of Official Statistics more effort to answ er than how many p eople will live there). T o dev elop a predictive mo del of energy consumption at training time, we b egin with the extractable ( i.e. , “free”) features in a regression model to predict energy usage and use forward selection to add a subset of the costly features. After learning this predictiv e mo del on the training dataset, the main problem lies in ho w to make a prediction on a new test instance. Initially , only a subset of the features (the free features) in the mo del are av ailable, and asking users for each unkno wn v alue incurs a cost, depending on ho w hard it is to pro vide that feature. Our dynamic question-ordering algorithm (DQO) c ho oses the b est question to ask next by considering which feature, if its v alue were kno wn, w ould most reduce uncertaint y , measured by the width of the prediction in terv al, with a penalty term on that feature’s cost. 3.2 Metho d 3.2.1 T raining Time: Cost-Aw are F eature Selection A greedy approximation to feature s election, forw ard selection starts with an empty feature set and, at eac h iteration, adds the feature that minimizes error [15, 38]. F or this analysis, w e started with the free extractable features (rather than no features, as in classic forward selection) and minimized lea v e-one-out cross-v alidation error with linear regression to add successiv e higher-cost features. 3.2.2 T est Time: Cost-Effectiv e Dynamic Question Ordering After learning regression mo dels for energy usage on the selected features from our training set, we w an t to mak e a prediction on a new test point, where initially only some features of the mo del are a v ailable. Our approac h considers a tra jectory of prediction interv als as a user pro vides information. A prediction interv al consists of a low er and upp er bound such that the true v alue lies in this in terv al with at least some probabilit y [46]. Prediction interv al width corresp onds to prediction uncertaint y: a wider in terv al means less confidence. W e In submission to Journal of Official Statistics select as the optimal next question the one whose inclusion most reduces the exp ected v alue of the prediction interv al width; that is, it most reduces the exp ected uncertaint y of the next prediction. In this problem, there are features that are unkno wn (not yet supplied by the user). W e use k nearest neigh b ors ( k NN) [8] to supply v alues for unansw ered features in v ector x ∈ R d . F or eac h unknown feature f , w e find the k data p oints in the training set X ∈ R n × d ( n samples, eac h d -dimensional) that are closest to x , along the dimensions K that are curren tly known. Then w e estimate x f as z f , the mean or mo de, as appropriate, of feature f in the k nearest neigh b ors (dep ending whether the feature is con tin uous or discrete) (see Algorithm 1). Algorithm 1 Estimating v alues z for still-unknown features Input: X ∈ R n × d , x ∈ R d , K ⊆ { 1 , ..., d } , k ∈ Z + Output: z ∈ R d 1: function estima te fea tures ( X , x, K , k ) 2: z K ← x K Cop y ov er the known features 3: I ← get knn( X : , K , z K , k ) Index z K ’s k NNs 4: for f ∈ { 1 , ..., d } \ K do F or all unkno wn f 5: z f ← mean( X I ,f ) Estimate z f from k NNs’ v alues for feature f 6: end for 7: return z 8: end function Because these z v alues estimate unkno wn features of x , w e use the measuremen t error mo del (MEM) [11] to capture error asso ciated with estimated features. Unlike traditional regression mo dels, MEMs do not assume w e observe eac h comp onent x f exactly; there is an error δ f asso ciated with the estimation: z f = x f + δ f , where E [ δ f | x f ] = 0 . Prediction ˆ y still dep ends on the true, unobserve d v alue x : ˆ y = ˆ β T ¯ x = ˆ β ( ¯ z − ¯ δ ) , In submission to Journal of Official Statistics where ˆ β ∈ R d +1 is the parameter vector learned on the training set X (recall all feature v alues are kno wn at training time). The notation ¯ x, ¯ z , ¯ δ means vectors x, z hav e a 1 app ended to them and δ a 0 to accoun t for the constan t term in the regression. Let ¯ X extend this notion to the training matrix: ¯ X = [ 1 n X ]. W e can calculate a 100(1 − α )% prediction in terv al for a new p oin t z as ˆ y ± t n − d − 1; α/ 2 q ˆ σ 2 1 + ¯ z T ( ¯ X T ¯ X ) − 1 ¯ z + ¯ δ T ( ¯ X T ¯ X ) − 1 ¯ δ , (1) where the ¯ δ T ( ¯ X T ¯ X ) − 1 ¯ δ term accounts for error from estimated features and t n − d − 1; α/ 2 is the v alue at which a Studen t’s t distribution with n − d − 1 degrees of freedom has cum ulativ e distribution function v alue α/ 2. W e can estimate δ from training data by calculating the error of predicting eac h feature with k NN, from the other features. W e also estimate ˆ σ 2 , the regression v ariance, from training data. Then, we cycle through eac h candidate feature f and compute the expected prediction in terv al width E [ w ( f )] for asking that feature next, ov er eac h v alue r that feature f migh t tak e on from its range of p otential v alues R : E [ w ( f )] = 2 · t n − d − 1; α/ 2 X r ∈ R p ( z f = r ) s ˆ σ 2 1 + ¯ z T f := r ( ¯ X T ¯ X ) − 1 ¯ z f := r + ¯ δ T f :=0 ( ¯ X T ¯ X ) − 1 ¯ δ f :=0 , (2) where p ( z f = r ), the probability that the f -th feature’s v alue is r , is calculated empirically from the training set, and the notation ¯ u f := q means the f -th comp onent of u is replaced with the v alue q . Algorithm 2 writes this pro cess in pseudo co de. In this algorithm, feat ranges and feat prop ortions are b oth d -dimensional cell arra ys where the f -th cells con tain, resp ectiv ely , the set of v alues R that feature f can take on and the prop ortions p ∈ R | R | that eac h v alue r ∈ R app ears in the training set. The output, E ∈ R d , is a v ector where the f -th comp onen t is the exp ected prediction in terv al width if the v alue of feature f w ere kno wn. In submission to Journal of Official Statistics Algorithm 2 Calculating the exp ected prediction in terv al width for eac h candidate feature to b e asked Input: X ∈ R n × d , K ⊆ { 1 , ..., d } , z ∈ R d , δ ∈ R d , ˆ σ 2 ∈ R , α ∈ [0 , 1], feat ranges, feat prop ortions Output: E ∈ R d 1: function Expected inter v al width ( X , K , z , δ , ˆ σ 2 , α , feat ranges, feat prop ortions) 2: v ← 0 d 3: ¯ X ← [ 1 n X ] 4: for f ∈ { 1 , ..., d } \ K do F or all unkno wn f 5: R ← feat ranges { f } , u ← 0 | R | 6: for ∈ { 1 , ..., | R |} do F or eac h v alue f can take on 7: ¯ z ← [1; z ] , ¯ z f +1 ← R ` f -th feature is assigned 8: ¯ δ ← [0; δ ] , ¯ δ f +1 ← 0 No uncertaint y in f -th feature 9: u ` ← ¯ z T ( ¯ X T ¯ X ) − 1 ¯ z + ¯ δ T ( ¯ X T ¯ X ) − 1 ¯ δ 10: end for 11: p ← feat prop ortions { f } 12: v f ← p T u 13: end for 14: return E ← 2 · t n − d − 1; α/ 2 p ˆ σ 2 (1 + v ) Elemen twise op eration on v 15: end function Algorithm 3 Dynamically c ho osing a question ordering A and making a sequence of pre- dictions ˆ y at the curren t feature v alues and estimates as feature v alues are pro vided Input: X ∈ R n × d , x ∈ R d , K ⊆ { 1 , ..., d } , k ∈ Z + , δ ∈ R d , α ∈ [0 , 1], feat ranges, feat prop ortions, ˆ β ∈ R d +1 , ˆ σ 2 ∈ R , λ ∈ R , c ∈ R d Output: A ⊆ { 1 , ..., d } , ˆ y ∈ R |A| +1 1: function DQO all ( X , x , K , k , δ , α , feat ranges, feat prop ortions, ˆ β , ˆ σ 2 , λ , c ) 2: A ← {} , ˆ y ← {} 3: for i ∈ { 1 , ..., d − |K|} do 4: z ← estima te fea tures ( X , x, K , k ) 5: ˆ y i ← ˆ β T z Predict on features and estimates 6: E ← Expected inter v al width ( X , K , z , δ , ˆ σ 2 , α , feat ranges, feat prop ortions) 7: f ? ← arg min f / ∈K ( E f + λ · c f ) 8: A ← A ∪ { f ? } , K ← K ∪ { f ? } 9: z f ? ← x f ? Ask and receive v alue for f ? 10: δ f ? ← 0 No more uncertaint y in f ? 11: end for 12: z ← estima te fea tures ( X , x, K , k ) 13: ˆ y d −|K| +1 ← ˆ β T z Mak e final prediction 14: return A , ˆ y 15: end function In submission to Journal of Official Statistics Including the feature that attains the narro w est exp ected prediction interv al width E [ w ( f )] will reduce the uncertain t y of our prediction more than any other feature. This approach allo ws incorp oration of feature cost into the question selection, by w eigh ting the expected prediction in terv al width against the cost of acquiring the feature: f ? = arg min f ( E [ w ( f )] + λ · c f ) , where c f is the cost of feature f and λ ∈ R trades off feature cost with reduced uncertain t y . A high-cost feature migh t not be chosen, if another feature can pro vide enough impro v emen t at lo wer cost. W e ask for this information, up date our v ector of known data with the resp onse (and estimate the unkno wn features again, no w including the new feature in the set for k NN prediction), and rep eat the pro cess until all feature v alues are filled in (or the user stops answ ering). Algorithm 3 formalizes this dynamic question-ordering (DQO) pro cess. More generally , this algorithm can b e seen as a framew ork that mak es predictions on partial information and selects whic h feature to query next b y (1) estimating v alues for unkno wn features (here with k NN) and (2) asking for the feature that will most reduce the exp ected uncertain ty of the next prediction (here measured b y prediction interv al width). With this approach, w e strategically order questions, tailored to previous information, to giv e accurate predictions while minimizing the user burden of answering man y or difficult questions that will not pro vide a substantial reduction in prediction uncertain ty . 3.3 Data The Residen tial Energy Consumption Surv ey (RECS) con tains information ab out home in- frastructure, o ccupan ts, and energy consumption. W e can use this dataset to learn rela- tionships b et ween household features and energy consumption to predict energy usage for prosp ectiv e tenants. The most recently released RECS w as a nationally representativ e sam- ple of 12,083 homes across the U.S. [44]. F or eac h household, RECS records fuel consumption In submission to Journal of Official Statistics b y fuel t yp e ( e.g. , electricity , natural gas) and around 500 features of the home ( e.g. , age of refrigerator, n umber of o ccupan ts). 3.3.1 Defining F eature Costs In our problem setting, features hav e different costs of obtaining, and w e wan t to build mo d- els and mak e predictions that leverage features cost-effectively . Some information is easily found in the ren tal listing ( e.g. , n umber of b edro oms) and is therefore “free,” while other information requires asking users. F or example, the n umber of windo ws do es not app ear in listings and would require a prosp ectiv e tenan t to visit each site; consequently , this question has high cost. Other useful features relate to o ccupan t b ehavior ( e.g. , preferred temper- ature). These questions lik ely remain constant for each user across homes and therefore require asking only once and are c heap er. W e categorize feature costs as “extractable/free” (can b e automatically extracted from ren tal listings), “low” (o ccupant-related; require ask- ing only once), and “high” (unit-related; must b e answ ered once for each apartment and ma y require a site visit). T able 1 lists the information used for extractable features and how often it app ears in Ren t Jungle, a compan y that scrap es ren tal listings from the internet; these “free” features app ear in the ma jority of listings on Rent Jungle. T able 1: The features we define as extractable ( i.e. , “free”) app ear in most of the listings on Ren t Jungle. Geographic features asso ciated with the city , zip co de, or state include climate zone and whether the area is urban or rural, among others. F eature Presence in Ren t Jungle database Num b er of b edro oms 85% Num b er of full bathro oms 57% Studio apartmen t 85% Cit y or zip co de 99% State 100% In submission to Journal of Official Statistics 3.4 Exp erimen tal V alidation W e v alidated our test-time feature ordering approac h on the RECS dataset for predicting household electricit y and natural gas consumption. W e restricted our analysis to homes in the same climate zone as our planned deplo yment lo cation in Pittsburgh, a subset of 2470 households in climate zone 2. W e used 90% of these homes for training and the remaining 10% for testing. The training set was further subdivided into feature selection and cross- v alidation subsets. W e trained separate mo dels for predicting electricity consumption (on all homes in our climate zone) and for predicting natural gas consumption (on the 75% of homes that use natural gas) with forward feature selection [15, 38]. Due to the similarity of the results from electricity prediction and natural gas prediction, we sho w here results from only electricit y prediction. 3.4.1 T est Time: Cost-Effectiv e Dynamic Question Ordering After learning regression mo dels for electricit y and natural gas prediction on the training set, we wan t to make predictions of energy usage for a new test p oin t. W e use our dynamic question-ordering framework (DQO) to make sequen tial predictions with partial, evolving information. T o apply DQO, we first used the training set to c ho ose parameters for im- puting unknown features ( k , from Algorithm 1, estima te fea tures ) and to estimate the measuremen t error δ (from Algorithm 2, Expected inter v al width ). Then, we simu- lated question-asking on RECS to ev aluate the p erformance of DQO for test-time feature ordering. P arameter Selection and Estimation W e used the training set to c ho ose k = 100 for imputing the v alues of features that ha ve not y et b een ask ed, based on the prediction p erformance of k NN for the higher-cost features. Then, w e estimated the measurement error δ f for eac h feature as the error from k NN on the training set. In submission to Journal of Official Statistics Sim ulating the Question-Asking and -Answ ering Pro cess with RECS W e simu- lated the pro cess of asking and answering questions on the testing subset of RECS by hiding the v alues for features that w ere not yet known. After we used DQO to c ho ose a feature to acquire (line 7 in Algorithm 3, DQO all ), we “ask ed” this question and unv eiled its v alue (line 9 in Algorithm 3) once it was “answered.” Ev aluating DQO P erformance with Prediction Certain t y , Error, and Cost W e ev aluated the p erformance of our cost-effective DQO algorithm in making sequential predic- tions with partial, evolving information on a held-out test set. F or comparison, w e imple- men ted sev eral baselines. The R andom algorithm chooses a random question ordering for eac h sample, the Fixe d De cr e asing algorithm asks questions in decreasing order of feature measuremen t error δ f (iden tical ordering for all samples), and the Fixe d Sele ction algorithm asks questions in the order of forw ard selection in the training phase (also identical for all samples). Finally , the Or acle c ho oses the next b est feature according to the minimum true prediction in terv al width (calculated on the test sample using true feature v alues, rather than the exp e cte d width as in Algorithm 3). W e tested tw o versions of DQO and oracle: ordering additional features without c ost and with c ost (implemen ted as λ = 0 and λ > 0). W e calculated several metrics related to the tra jectory of prediction p erformance and cost, for orderings given by the algorithms: DQO and Or acle with and without c ost, R andom, Fixe d De cr e asing , and Fixe d Sele ction . W e summarized prediction p erformance with the width of the current prediction in terv al (prediction c ertainty ) and the absolute v alue of the difference b et w een the curren t prediction and the truth (prediction err or ); w e also measured the cumulativ e cost of all features asked at each step (prediction c ost ). T able 2 summarizes the metric tra jectories as areas under the curve—smaller v alues are b etter b ecause they mean the algorithm sp en t less time in high uncertain t y , error, and cost. Certain ty Metrics F or certain t y , we calculated widths of 90% prediction interv als as features were answered. Since narrow er prediction in terv al widths corresp ond to more certain In submission to Journal of Official Statistics predictions, w e exp ect DQO in terv al widths to b e less than those of the baselines, particularly in the early stages. Figure 1a plots the actual prediction interv al widths as questions are ask ed (calculated with Equation 1, using the true kno wn feature v alues and imputed v alues for unknown features), av eraged across the test dataset, for the question sets from the sev en orderings. The DQO sets result in the narro west (or near-narro w est) prediction interv als ( i.e. , most certain predictions), compared to the baselines, with improv ements most notable in the first 10 questions answ ered—the situation that arises when users do not answ er all the questions. Error Metrics F or error, we calculated the absolute v alue of differences b et ween the midp oin t of the 90% prediction interv al and truth as questions are answ ered, plotted in Figure 1b. Because this metric compares a p oint prediction to the true v alue, error is still incurred for prediction in terv als that include the true v alue (as 90% of them will, by construction), when the true v alue is not the exact midp oin t of the range. F or all orderings, predictions approac h the true v alue as questions are answered. Once ab out 10 questions ha ve b een asked, DQO with c ost reaches similar p erformance as DQO without c ost and the fixed-order baselines ( Fixe d de cr e asing and Fixe d sele ction ). Cost Metrics Progressive total feature costs as features are asked and their true v alues are used in the mo dels are plotted in Figure 1c. Cumulativ e feature costs are low er for orderings that p enalize feature cost ( DQO, Or acle with c ost ), with cost decreasing as the p enalt y on cost λ increases. The other orderings ha v e similar cost tra jectories to each other. Ov erall, these metrics sho w that our test-time DQO approac h quickly achiev es accu- rate, confident predictions: b y asking around 10 questions, DQO (with and without cost) reac hes similar accuracy as the fixed-order baselines, but the sequent ial predictions b y the fixed orderings are less confiden t than DQO until ab out 20 questions hav e b een asked. Figure 1d shows ho w frequently the oracle ask ed each feature in each p osition across test In submission to Journal of Official Statistics 0 5 10 15 20 25 30 1.41 1.412 1.414 1.416 1.418 1.42 1.422 1.424 Number of user−answered questions Actual prediction interval width DQO with λ =0.00 DQO with λ =0.05 Random Fixed: feature uncertainty order Fixed: feature selection order Oracle with λ =0.00 Oracle with λ =0.05 (a) Prediction in terv al widths as questions are ask ed: DQO results in more certain predictions ( i.e. , low er prediction interv al widths) than the baseline orderings. 0 5 10 15 20 25 30 0.3 0.35 0.4 0.45 0.5 0.55 0.6 0.65 Number of user−answered questions |y_true − y_hat| DQO with λ =0.00 DQO with λ =0.05 Random Fixed: feature uncertainty order Fixed: feature selection order Oracle with λ =0.00 Oracle with λ =0.05 (b) Mean absolute error as questions are asked: DQO results in similarly-correct predictions as baselines. 0 5 10 15 20 25 30 0 10 20 30 40 50 60 70 80 90 Number of user−answered questions Total cost of questions answered so far DQO with λ =0.00 DQO with λ =0.05 Random Fixed: feature uncertainty order Fixed: feature selection order Oracle with λ =0.00 Oracle with λ =0.05 (c) T otal feature costs as questions are asked: the tradeoff parameter λ influences when exp ensiv e features are included. Feature d Frequency asked at position i 5 10 15 20 25 30 5 10 15 20 25 30 0 0.1 0.2 0.3 0.4 0.5 0.6 0.7 0.8 0.9 1 (d) The oracle chose to add features fairly uni- formly across test samples, shown here as the frequency each feature w as ask ed in eac h posi- tion of question orders. Figure 1: Results from dynamically ordering questions for test-time electricit y prediction. instances. Most features are chosen fairly uniformly at eac h p osition in the question ordering. This indicates that there is no single b est order to ask questions across all households, which is wh y the dynamic question-ordering pro cess is so v aluable. In submission to Journal of Official Statistics T able 2: Areas under the curve for the certain t y , error, and cost metrics from v arious meth- o ds, for electricity prediction: smaller v alues mean the algorithm sp en t less time in high uncertain ty , error, and cost. Metho d Interval width | y − ˆ y | Cost DQO without cost 42.43 12.06 1212.91 DQO with cost 42.44 12.53 1120.50 Random 42.53 13.18 1213.30 Fixed decreasing 42.46 11.85 1233.50 Fixed selection 42.47 11.45 1190.50 Oracle without cost 42.35 14.62 1222.91 Oracle with cost 42.39 13.63 1120.50 3.5 Limitations Curren tly , our DQO algorithm assumes that (1) users are able to answer the next question w e ask and (2) their answ ers are accurate. Ho wev er, situations could arise where these assumptions do not hold. F or example, in the utilit y prediction task, a prospective tenant ma y b e interested in getting p ersonalized energy estimates for a home b efore visiting—they could still answer occupant-related features. DQO can b e easily extended to this case b y offering users a “don’t kno w” option for answ ering questions and removing unkno wn features from consideration in later iterations. Breaking the second assumption, that user answers are accurate, would allo w p eople to giv e estimates for features ( e.g. , refrigerator size by lo oking at pictures in the rental listing). Incorp orating this element into DQO would require a w ay to estimate error asso ciated with user-pro vided feature estimates. F urthermore, we ha ve not y et tested the sequen tial question-asking and prediction- pro viding pro cess of DQO with human users. W e hypothesize that giving users estimates from partial information will motiv ate them to contin ue answering questions to receiv e more accurate p ersonalized predictions. On the other hand, once the prediction in terv al width is small enough or stable enough, users may no longer see the v alue in contin uing to answ er questions and will stop. In submission to Journal of Official Statistics 3.6 Conclusion Pro viding p ersonalized energy estimates to prosp ective tenan ts with limited, costly informa- tion is a c hallenge. Our solution uses an established dataset to build cost-effective predictiv e mo dels and, at test time, dynamically orders questions for each user. At test time, when we w ant to make a p ersonalized estimate for a new ren ter-home pair, we presen t a cost-effectiv e w ay to choose questions to ask a user ab out their habits and a ren tal unit, based on which feature’s inclusion w ould most improv e the certaint y of our prediction, given the information w e already know. Our exp erimen ts show that, for predicting electricit y and natural gas con- sumption, we ac hieve prediction p erformance that is equally accurate to, but more certain than, t wo fixed-order baselines b y asking users only 21% of features (26% of the cost of the full-feature model). 4 General F ramew ork for Dynamic Question Ordering in Online Surv eys The dynamic question-ordering pro cedure defined in DQO all (Algorithm 3) has tw o com- p onen ts at its core that can b e generalized to an online surv ey . First, there is a wa y to impute v alues for unanswered questions. Second, there is a wa y to select an optimal next question to ask. In this section w e expand the metho ds used to achiev e these goals in the previous section and discuss ho w other comp onen ts can b e used in similar w ays when applying DQO to other prediction problems and to surv ey collection. 4.1 Imputing Unkno wn F eature V alues T o estimate answers to yet-unask ed questions, the DQO approach presented in Section 3 used k nearest neighbors in estima te fea tures (Algorithm 1). The app eal of k NN here is that, as a nonparametric prediction metho d, it can estimate v alues for all unkno wn features from In submission to Journal of Official Statistics an y subset of known features, simply by finding the k nearest neigh b ors to the query p oint restricted to the dimensions currently kno wn ( i.e. , the questions already answ ered). Using a parametric prediction method, such as linear regression or naiv e Bay es, to estimate unkno wn features is challenging, because it w ould require a mo del for predicting ev ery feature on every p oten tial subset of features, since questions are not asked in a fixed order. While feasible for relativ ely short questionnaires, learning an exp onen tial num b er of predictiv e mo dels for each question in a survey , from all p oten tial sets of previous questions, is definitely impractical. 4.2 Selecting an Optimal Next Question to Ask T o c ho ose an optimal next question to ask, DQO for p ersonalized energy estimates mini- mized the expected prediction uncertaint y from including eac h p otential new question (cal- culated as the exp ected width of the prediction interv al, in Expected inter v al width (Algorithm 2)), p enalized b y question cost. W e used prediction interv al width as a measure of uncertain ty for regression, but other measures of prediction uncertain t y could b e used instead. Other criteria for question-selection include maximizing information gain from c ho osing a next question, maximizing an exp ected resp onse probability , or minimizing an exp ected break off probability (b oth calculated from items in the survey , or from paradata collected during the survey). Alternatively , item-sp ecific resp onse and breakoff rates could inform the cost of each question. This metho d can b e generalized to order mo dules of related questions, rather than indi- vidual questions. Reasons to present questions in mo dules rather than purely sequentially include (1) presenting related items in a group can reduce the c o gnitive bur den required of a resp onden t to answer the group ( e.g. , if a set of questions asks the resp ondent ab out v arious asp ects of their commute, as the American Comm unity Survey do es, it will be easier for the resp ondent to answ er those commute-related questions as a unit rather than scattered throughout the entire questionnaire) [37] and (2) imp osing a standard order on certain ques- In submission to Journal of Official Statistics tions that are susceptible to or der effe cts [35] can ensure that all participan ts understand and answer questions in the same wa y , ev en when question order is determined dynamically . 5 Other P oten tial Surv ey Applications In this section, we describ e other surv eys in which dynamic question ordering could b e b ene- ficial, with elab oration on what particular problems DQO could solv e. Some of these surv eys, suc h as the Curren t Population Survey (CPS) and the National Crime Victimization Sur- v ey (NCVS), hav e particular prediction problems as goals (identifying if the resp ondent is unemplo yed for the CPS or classifying incidents of victimization for the NCVS) and can therefore directly incorp orate a prediction-motiv ated approach to DQO, lik e the one pre- sen ted in Section 3. Other surveys, like the American Communit y Survey and National Health Interview Surv ey , are more fo cused on the broad goal of collecting information on a large p opulation, rather than making sp ecific predictions for individual resp onden ts. Dy- namic question ordering in these surveys w ould then need to fo cus on maximizing respondent engagemen t, calculated from previously-pro vided answers and paradata collected during the surv ey-taking. National surveys of these sorts are complicated to deal with, due to complex sampling requirements (suc h as ov ersampling certain p opulations, as the NHIS do es) and m ulti-purp ose goals (such as adding supplemental mo dules to core surveys, as happens in the CPS and NHIS). 5.1 American Comm unit y Surv ey F or the mandatory American Comm unity Survey (A CS), the goal is to gather complete statistics on the U.S. p opulation, and follo w-up with nonresp ondents is exp ensiv e. Eac h y ear 3.54 million households receive mailed surveys to answer anywhere b et ween 77 and 347 questions, dep ending on the n umber of household o ccupan ts [43]. The survey takes, on a verage, 40 minutes to complete and 54% of homes return theirs [41]. The Census Bureau In submission to Journal of Official Statistics calls nonresp onden ts for telephone in terviews and then samples nonrespondents for home in terviews. Each in-person case takes 134 min utes; in 2012 this amoun ted to 129,000 p erson- hours p er mon th [13]. In addition to b eing exp ensive, in-p erson in terviews can also bias surv ey results due to higher w eights assigned to those subsampled resp onden ts [41]. The Census Bureau tested shifting the mail surv ey online and found similar data quality for in ternet and mail return [17]. F urthermore, while ov erall resp onse rates were similar, online surv eys had higher item resp onse rates for earlier questions and more blank resp onses for later questions than pap er surveys [17]. Dynamically ordering surv ey questions in the online form could ensure that ev en if households do not complete the surv ey , they answ er the most informativ e questions b efore breaking off. The online mo de for the A CS also collects paradata as resp ondents complete the surv ey . These paradata include clic ked links (including na vigation buttons, resp onses, help buttons), timestamps, field v alues, errors, in v alid logins, timeouts, logouts [17]. Suc h paradata could b e used to model user engagemen t, understanding, and willingness to resp ond, as another comp onen t for dynamic question ordering to increase resp onse rate. 5.2 Curren t P opulation Surv ey The Curren t P opulation Surv ey (CPS) is a monthly survey of 60,000 households across the United States, jointly sp onsored by the U.S. Census Bureau and Bureau of Lab or Statis- tics [39]. Selected households are in the survey for four consecutiv e mon ths, out of the surv ey for eigh t months, and then bac k in the surv ey for four more mon ths. Originally conducted as an in-p erson pap er surv ey , the CPS first in tro duced computer-assisted telephone in terviewing (CA TI) in 1987 and computer-assisted p ersonal interviewing (CAPI) in 1994; currently , the CPS is completely computerized and conducted via CA TI and CAPI. These computerized mo des would allow for dynamic question ordering as resp onden ts answer survey questions. The c hief purp ose of the CPS is to estimate the United States unemplo ymen t rate for the past month, and, consequen tly , the ma jorit y of the official survey is dev oted to this task. In submission to Journal of Official Statistics Resp onden ts answer a battery of questions related to their work status in the past w eek to determine if they were employ ed, unemploy ed, or not in the lab or force. There are ov er 200 questions in the lab or force p ortion of the items; not all of these questions apply to ev ery household, so the curren t version of the CPS uses predefined skip patterns to a void asking irrelev an t questions. Augmenting the rule-based skip patterns with dynamic question ordering derived from statistical prop erties of the resp onden t could further lo wer resp onden t burden and resp onse time. V arious survey sp onsors add supplemental question mo dules to the CPS ( e.g. , the T o- bacco Use Supplemen t, sp onsored by the National Cancer Institute), whic h may also b enefit from dynamic question ordering. The n umber of supplemen ts is hea vily restricted, due to not w an ting to o verburden resp ondents with too man y questions and detract from the main purp ose of the survey—estimating emplo ymen t rate [39]. Using dynamic question ordering within or b et w een mo dules could effectively select items to ask of p opulations of interest, thereb y reducing the effectiv e num b er of questions resp onden ts m ust answer and increasing the potential for supplemental questions on the CPS. 5.3 National Health In terview Survey The largest U.S. health surv ey , the National Health Interview Surv ey (NHIS) is admin- istered in p erson to ab out 35,000 households, represen ting 87,500 individuals, throughout eac h year [26]. How ever, this num b er can increase or decrease, dep ending on a v ailable fund- ing; for example, the 2014 NHIS cov ered 44,552 households, represen ting 112,053 individuals. The main purp ose of the NHIS is to collect health-related information on a household, b oth at the household and family levels and at the individual lev el for one “sample c hild” and one “sample adult” from each family . As a CAPI-conducted surv ey , the NHIS could feasibly incorporate dynamic question ordering in to its interview pro cedure. Curren tly , the NHIS uses predefined skip patterns to adv ance resp onden ts through the surv ey , but a statistical approac h to question order could In submission to Journal of Official Statistics enhance the surv ey exp erience. Like the CPS, the NHIS also has supplemen ts to the main surv ey sp onsored b y other agencies. Supplemen tal questions are often asked in their own mo dules but are o ccasionally in tersp ersed in to the NHIS Core. The structure of the NHIS designates one p erson from a household as the “household resp onden t” who provides information for all members in the household (even for multi- family households). This type of proxy rep orting is more lik ely to ha ve errors than self- rep orts [35], and so a dynamic question-ordering pro cedure w ould need to consider the impact of uncertain provided v alues when choosing which question to ask next. The NHIS o v ersamples underrepresented p opulations, like blac k, Hispanic, and Asian p eople (esp ecially when they are at least 65 years old), to obtain more precise estimates for these p opulations [26]. With this goal in mind, a dynamic-question ordering pro cedure for the NHIS could also tak e in to account the lik ely accuracy of imputed v alues for questions that are not y et ask ed, with thresholds for allo wable imputation error. Suc h thresholds could b e p opulation-specific, with minorities’ having m uch lo w er allow able error thresholds, to ensure that more complete data are collected from mem b ers of these p opulations. 5.4 National Crime Victimization Surv ey Ev ery y ear the U.S. Census Bureau, on b ehalf of the Bureau of Justice Statistics, administers the National Crime Victimization Surv ey (NCVS) to 90,000 households (160,000 individuals) in the United States [4]. Once selected for the surv ey , a household’s o ccupan ts age 12 and older are in terview ed ev ery six mon ths o v er three years, for a total of sev en interviews. In in terviews, resp onden ts rep ort victimizations, b oth rep orted to p olice and unrep orted, that they exp erienced in the previous six months. The interview is alw ays conducted in a computerized mode (CAPI or CA TI), with the first in terview in p erson; since 2006 the NCVS has b een administered via CAPI, so dynamic question ordering is possible in this computerized setting. The NCVS collects detailed information ab out eac h inciden t rep orted b y a resp ondent, to In submission to Journal of Official Statistics classify incidents into fine-grained categories of crime ( e.g. , “Robb ery – completed without injury ,” “Robb ery – attempted with injury”). The curren t NCVS design asks a resp onden t a set of questions regarding eac h inciden t they report and uses answ ers to these questions to classify the crime, rather than directly asking resp onden ts for the crime category [4]. As suc h, this surv ey has a p er-individual prediction problem at its core (lab eling an incident as a type of crime), just lik e the p ersonalized energy estimate example with RECS presen ted in Section 3, and could b enefit from a similar DQO pro cess, except for classification rather than regression. Dynamic question ordering could further b enefit the NCVS b ecause, esp ecially as house- holds complete the surv ey multiple times, resp onden ts recognize that rep orting an incident results in an extended set of questions to answ er. This full questioning takes place for each individual rep ort, including rep eat victimizations ( e.g. , domestic violence). T o sp eed up the in terview, participants are likely to underrep ort incidents of victimization, to a v oid length y subsets of questions for eac h rep ort. By reducing the n umber of questions necessary to categorize each inciden t and using previously provided information to further help in ques- tion ordering for rep eat inciden ts, dynamic question ordering could reduce the n umber of questions in the en tire survey , making it m uch less burdensome for respondents to pro vide complete reports. 5.5 Surv ey of Income and Program P articipation Conducted by the U.S. Census Bureau, the Surv ey of Income and Program P articipation (SIPP) collec ts data on income, emplo ymen t, and so cial program participation and eligibilit y from households [42]. The SIPP is designed as a longitudinal national panel survey , where eac h panel is a representativ e sample of 14,000 to 52,000 households, con tacted yearly for three to five consecutive y ears. Eac h household in terview is conducted in p erson, via CAPI, and aims to get self-rep orts from all household members at least 15 years old. In addition to demographic information, interviews ask resp onden ts for their participation in v arious so cial In submission to Journal of Official Statistics programs, financial situation, and emplo ymen t status, in the previous calendar y ear. The c hief goal of SIPP is to understand household program eligibility and participa- tion and to assess the effectiv eness of so cial programs lik e Supplemental Securit y Income, Supplemen tal Nutrition Assistance Program, T emp orary Assistance for Needy F amilies, and Medicaid. Using participation in each program of in terest as the prediction of in terest could guide a DQO approach as illustrated in Section 3 on RECS. 6 F uture W ork Although the supp osed neutrality of the survey as an impartial data collection to ol means that all resp onden ts ha ve the same (or very similar) surv ey exp eriences, this rigid structure can also hinder the natural flow of information that occurs in a con versation [34]. Often for a participan t, a particular ev en t influences their answers for multiple questions; ho wev er, unless a direct question about this ev ent app ears in the surv ey , they ha v e to answ er many rep etitive questions that could hav e been av oided in a conv ersation. Learning a laten t structure of participan ts’ answers in a surv ey could b e a step tow ard uncov ering these hidden even ts that determine the answers to multiple questions, and DQO could use this knowledge to guide question selection as well. As w e mentioned at the outset, the cognitive asp ects of surv ey metho dology mov ement that originated in the 1980s [18, 36] raised issues with the traditional approac h to surv ey questionnaire design, whic h k eeps order fixed for all respondents and whic h measures the same quantities at differen t points in time. The need to reduce resp onden t burden and to k eep resp ondents engaged in online surveys is raising a complemen tary set of issues that are no w b eing addressed under the rubric of adaptiv e surv ey design. These t wo p ersp ectiv es do need to b e reconciled in some fashion. In this pap er, we considered the prediction-fo cused implementation of DQO as a sp ecial case of the more general survey-taking setting. Ho w ever, given typical survey resp onden ts’ In submission to Journal of Official Statistics disengagemen t from surveys and declining survey response rates, maybe a new paradigm of survey collection, in which resp onden ts get something useful to them out of answ ering a surv ey , could motiv ate participants to pro vide complete and accurate resp onses. Commer- cial surveys often pay resp onden ts, but comp ensation do es not necessarily ensure thoughtful resp onses—participan ts still exhibit satisficing behavior in paid surveys ( e.g. , [2, 19]). In- cen tivizing resp onden ts with something dep enden t on the qualit y of their answ ers, like a p ersonalized prediction or calculation, can motiv ate them to pro vide data that accurately reflect their situations. Ho wev er, one clear downside to this approac h is that giving resp on- den ts information that comes from the surv ey they are currently answering con taminates their resp onse. F or example, supp ose that a p erson is answ ering questions ab out their energy-using habits to receive a p ersonalized energy estimate, as in Section 3. Their current estimate for natural gas consumption is higher than they w ould lik e, and the next question asks for their preferred temp erature in the win ter. Because they do not wan t their estimate for natural gas usage to climb even higher, the respondent gives an optimistically-lo w v alue for preferred temp erature. The uncertain ty asso ciated with these predictions can also influ- ence a user’s decision to contin ue answering questions: once a participan t feels that their giv en prediction is certain enough, they may stop answ ering questions. Dep ending on the purp ose of the survey (namely , whether its chief goal is to pro vide information to or to collect information from the resp onden t), this type of breakoff ma y or may not b e bad. 7 Conclusion Dynamic question ordering— i.e. , choosing whic h question to ask a surv ey resp ondent next, dep ending on their answ ers to previous questions—can impro v e surv ey quality in t wo key w ays. First, giving participants p ersonalized question orders can engage them and motiv ate them to complete the survey . Second, eliciting the most relev an t information for a particular resp onden t upfront can improv e the quality of imputations for unansw ered questions if the In submission to Journal of Official Statistics resp onden t breaks off b efore completing the questionnaire. F or some surv eys, the goal is only to estimate a v alue for eac h resp onden t; in this case, it is not even necessary for the participan t to answ er all questions—it is sufficient for them to answ er a subset that will ensure a confident prediction. W e present a general framew ork for dynamic question ordering in online surveys that sequen tially considers which question to ask a resp onden t next, based on their previous an- sw ers, trading off the exp ected utilit y of ha ving an answ er to that question with the cost of asking that question. The definition of “utility” for an answer dep ends on the survey and its purp ose; examples include information gain, resp onse probability , (negative) breakoff prob- abilit y , or certaint y of the subsequent prediction. Similarly , the definition of question “cost” also depends on the surv ey; examples include difficulty to the user of answering the ques- tion, (negativ e) lik eliho o d of answ ering (since resp onden ts ma y b e reluctan t to resp ond to sensitiv e questions, even if they are easy to answ er), or break off rates of individual questions. W e illustrated an example of this DQO framework for a prediction-oriented surv ey—providing prosp ectiv e tenants with p ersonalized energy estimates in p otential homes. In this applica- tion, we found that asking users, on a verage, 21% of 30 questions could pro vide certain and accurate predictions at only 26% of the cost of the full-feature mo del, and that there w as no fixed order of questions that w as optimal across all users. Then, we discussed wa ys that dynamic question ordering could improv e quality in computerized national surveys, fo cusing on unique asp ects of eac h survey that DQO m ust take in to accoun t. As more surveys mov e online or to computerized modes, dynamic question ordering can improv e survey results at scale and at low cost to the data collectors. DQO trades off the utility from ha ving an answer to a question with its cost and sequentially requests feature v alues in order to make useful, confident predictions and gather survey data with the resources users are willing and able to provide. In submission to Journal of Official Statistics References [1] Daniel Almirall, Scott N. Compton, Meredith Gunlicks-Stoessel, Naih ua Duan, and Susan A. Murph y . Designing a pilot sequen tial m ultiple assignmen t randomized trial for dev eloping an adaptive treatmen t strategy . Statistics in Me dicine , 31(17):1887–1902, 2012. [2] Scott Barge and Hun ter Gehlbac h. Using the theory of satisficing to ev aluate the quality of surv ey data. R ese ar ch in Higher Educ ation , 53(2):182–200, 2012. [3] Matt-Mouley Bouamrane, Alan Rector, and Martin Hurrell. Gathering precise patien t medical history with an ontology-driv en adaptive questionnaire. In 21st IEEE Interna- tional Symp osium on Computer-Base d Me dic al Systems , pages 539–541. IEEE, 2008. [4] Bureau of Justice Statistics. National Crime and Victimization Survey: T ec hnical do c- umen tation, 2014. [5] David A. Cohn, Zoubin Ghahramani, and Mic hael I. Jordan. Activ e learning with statistical models. Journal of A rtificial Intel ligenc e R ese ar ch , 4:129–145, 1996. [6] Linda M. Collins, Susan A. Murphy , and Victor J. Nair, Vija y N .and Strecher. A strategy for optimizing and ev aluating behavioral interv en tions. Annals of Behavior al Me dicine , 30(1):65–73, 2005. [7] Linda M. Collins, Susan A. Murphy , and Victor Strec her. The m ultiphase optimization strategy (MOST) and the sequen tial m ultiple assignment randomized trial (SMAR T): New metho ds for more p otent eHealth in terven tions. A meric an Journal of Pr eventive Me dicine , 32(5):S112–S118, 2007. [8] Thomas M. Cov er and P eter E. Hart. Nearest neighbor pattern classification. IEEE T r ansactions on Information The ory , 13(1):21–27, 1967. In submission to Journal of Official Statistics [9] Thomas Dietz, Gerald T. Gardner, Jonathan Gilligan, P aul C. Stern, and Mic hael P . V andenbergh. Household actions can provide a b ehavioral w edge to rapidly reduce U.S. carb on emissions. In Pr o c e e dings of the National A c ademy of Scienc es , v olume 106, pages 18452–18456. National Academy of Sciences, 2009. [10] Kirstin Early , Stephen E. Fien b erg, and Jennifer Mank off. T est time feature ordering with F OCUS: In teractiv e predictions with minimal user burden. In ACM International Joint Confer enc e on Pervasive and Ubiquitous Computing , 2016. [11] W a yne A. F uller. Me asur ement Err or Mo dels . Wiley , New Y ork, 2009. [12] Rob ert D. Gibb ons, Da vid J. W eiss, Ellen F rank, and Da vid J. Kupfer. Computerized adaptiv e diagnosis and testing of men tal health disorders. Annual R eview of Clinic al Psycholo gy , 12(1), 2016. [13] Deb orah Griffin and Da wn Nelson. Reducing resp onden t burden in the ACS’s computer assisted p ersonal visit in terviewing op eration – phase 1 results, 2014. [14] Rob ert M. Grov es and Stev en G. Heeringa. Resp onsiv e design for household surv eys: T o ols for actively controlling survey errors and costs. Journal of the R oyal Statistic al So ciety: Series A (Statistics in So ciety) , 169(3):439–457, 2006. [15] F rank E. Harrell. R e gr ession Mo deling Str ate gies . Springer, New Y ork, 2001. [16] He He, Hal Daum´ e I I I, and Jason Eisner. Cost-sensitiv e dynamic feature selection. In Inferning 2012: ICML Workshop on inter action Betwe en Infer enc e and L e arning , 2012. [17] Rachel Horwitz, Jennifer T ancreto, Mary F rances Zelenak, and Mary Davis. Data qualit y assessment of the American Communit y Surv ey in ternet resp onse data, 2012. [18] T om B. Jabine, Miron L. Straf, Judith M. T anur, and Roger T ourangeau, editors. Co g- nitive Asp e cts of Survey Metho dolo gy: Building a Bridge Betwe en Disciplines . National Academies Press, W ashington, DC, 1984. In submission to Journal of Official Statistics [19] Adam Kap elner and Dana Chandler. Preven ting satisficing in online surveys. In Pr o- c e e dings of Cr owdConf , 2010. [20] Sergey Kara y ev, T obias Baumgartner, Mario F ritz, and T rev or Darrell. Timely ob ject recognition. In A dvanc es in Neur al Information Pr o c essing Systems , pages 890–898, 2012. [21] Amy M. Kilb ourne, Daniel Almirall, Daniel Eisen b erg, Jeanette W axmonsky , David E. Go o dric h, John C. F ortney , JoAnn E. Kirchner, Leif I. Solb erg, Deb orah Main, Mark S. Bauer, et al. Proto col: Adaptive implementation of effectiv e programs trial (ADEPT): Cluster randomized SMAR T trial comparing a standard versus enhanced implemen- tation strategy to impro v e outcomes of a mo o d disorders program. Implementation Scienc e , 9(132):1–14, 2014. [22] Philip W. Lav ori, Ree Da wson, and A. John Rush. Flexible treatmen t strategies in c hronic disease: Clinical and researc h implications. Biolo gic al Psychiatry , 48(6):605– 614, 2000. [23] F rederic M. Lord. Applic ations of Item R esp onse The ory to Pr actic al T esting Pr oblems . La wrence Erlbaum Asso ciates, Hillsdale, NJ, 1980. [24] Jacob M. Montgomery and Josh Cutler. Computerized adaptive testing for public opinion surv eys. Politic al Analysis , 21(2):172–192, 2013. [25] Susan A. Murph y . An exp erimental design for the developmen t of adaptiv e treatmen t strategies. Statistics in Me dicine , 24:1455–1481, 2005. [26] National Center for Health Statistics. Survey description: National Health Interview Surv ey, 2014. In submission to Journal of Official Statistics [27] Divya Pandey , Madho olik a Agraw al, and Jai Shanker P andey . Carb on fo otprin t: Cur- ren t metho ds of estimation. Envir onmental Monitoring and Assessment , 178(1-4):135– 160, 2011. [28] James E Pitk ow and Margaret M Rec ker. Using the web as a surv ey to ol: Results from the second WWW user survey . Computer Networks and ISDN Systems , 27(6):809–822, 1995. [29] Stephen R. P orter. Raising resp onse rates: What works? New Dir e ctions for Institu- tional R ese ar ch , 2004(121):5–21, 2004. [30] A. John Rush, Maurizio F a v a, Stephen R. Wisniewski, Philip W. Lav ori, Madh uk ar H. T rivedi, Harold A. Sac keim, Mic hael E. Thase, Andrew A. Nierenberg, F rederic M. Quitkin, T Michael. Kashner, et al. Sequenced treatment alternatives to relieve depres- sion (ST AR* D): Rationale and design. Contemp or ary Clinic al T rials , 25(1):119–142, 2004. [31] Barry Schouten, Melania Calinescu, and Annemiek e Luiten. Optimizing quality of resp onse through adaptive surve y designs. Survey Metho dolo gy , 39(1):29–58, 2013. [32] Tse-Hua Shih and Xitao F an. Comparing resp onse rates from web and mail surveys: A meta-analysis. Field Metho ds , 20(3):249–271, 2008. [33] T. Scott Stroup, Joseph P . McEvo y , Marvin S. Swartz, Matthew J. Byerly , Ira D. Glick, Jose M. Caniv e, Mark F. McGee, George M. Simpson, Mic hael C. Stev ens, and Jef- frey A. Lieb erman. The National Institute of Men tal Health clinical antipsyc hotic trials of in terven tion effectiv eness (CA TIE) pro ject: sc hizophrenia trial design and proto col dev elopment. Schizophr enia Bul letin , 29(1):15, 2003. [34] Lucy Suchman and Brigitte Jordan. Interactional troubles in face-to-face survey inter- views (with discussion). Journal of the Americ an Statistic al Asso ciation , 85(409):232– 253, 1990. In submission to Journal of Official Statistics [35] Seymour Sudman, Norman M. Bradburn, and Norb ert Sc h w arz. Thinking A b out A n- swers: The Applic ation of Co gnitive Pr o c esses to Survey Metho dolo gy . Jossey-Bass, San F rancisco, 1996. [36] Judith M. T anur. Questions ab out Questions: Inquiries Into the Co gnitive Bases of Surveys . Russell Sage F oundation, New Y ork, 1992. [37] Roger T ourangeau. Cognitiv e sciences and surv ey metho ds. In T om B. Jabine, Miron L. Straf, Judith M. T an ur, and Roger T ourangeau, editors, Co gnitive Asp e cts of Survey Metho dolo gy: Building a Bridge Betwe en Disciplines , pages 73–100. National Academies Press, W ashington, DC, 1984. [38] Jo el A T ropp. Greed is go o d: Algorithmic results for sparse approximation. IEEE T r ansactions on Information The ory , 50(10):2231–2242, 2004. [39] U.S. Bureau of the Census. Design and methodology: Curren t Population Survey, 2006. [40] U.S. Bureau of the Census. American Housing Survey for the United States, 2013. [41] U.S. Bureau of the Census. American Communit y Survey: Design and metho dology , 2014. [42] U.S. Bureau of the Census. Surv ey of Income and Program Participation, 2014. [43] U.S. Bureau of the Census. American Comm unity Survey, 2016. [44] U.S. Energy Information Administration. Residential Energy Consumption Survey 2009. www.eia.gov/consumption/residential/data/2009/ , 2009. [45] Lu W ang, Andrea Rotnitzky , Xihong Lin, Randall E. Millik an, and Peter F. Thall. Ev al- uation of viable dynamic treatmen t regimes in a sequentially randomized trial of ad- v anced prostate cancer. Journal of the A meric an Statistic al Asso ciation , 107(498):493– 508, 2012. In submission to Journal of Official Statistics [46] Sanford W eisb erg. Applie d Line ar R e gr ession . Wiley , New Y ork, 4th edition, 2014. [47] David J. W eiss. Improving measuremen t qualit y and efficiency with adaptiv e testing. Applie d Psycholo gic al Me asur ement , 6(4):473–492, 1982. [48] David J. W eiss and G. Gage Kingsbury . Application of computerized adaptive testing to educational problems. Journal of Educ ational Me asur ement , pages 361–375, 1984.
Original Paper
Loading high-quality paper...
Comments & Academic Discussion
Loading comments...
Leave a Comment