Event coincidence analysis for quantifying statistical interrelationships between event time series: on the role of flood events as possible triggers of epidemic outbreaks
Studying event time series is a powerful approach for analyzing the dynamics of complex dynamical systems in many fields of science. In this paper, we describe the method of event coincidence analysis to provide a framework for quantifying the streng…
Authors: Jonathan F. Donges, Carl-Friedrich Schleussner, Jonatan F. Siegmund
EPJ man uscript No. (will b e inserted b y the editor) Event coincidence analysis fo r quantifying statistical interrelationships b et w een event time series On the role of flo o d events as triggers of epidemic outbreaks Jonathan F. Donges 1 , 2 , a , Carl-F riedric h Sc hleussner 1 , 3 , Jonatan F. Siegm und 1 , 4 , and Reik V. Donner 1 1 P otsdam Institute for Climate Impact Research, T elegrafenberg A31, D-14473 Potsdam, German y 2 Sto c kholm Resilience Cen tre, Sto ckholm Univ ersity , Kr¨ aftrik et 2B, 114 19 Sto ckholm, Sw eden 3 Climate Analytics, F riedrichstr. 231, Haus B, D-10969 Berlin, Germany 4 Institute of Earth and Environmen tal Science, Univ ersity of Potsdam, Karl-Liebknech t- Str. 24-25, D-14476 Potsdam-Golm, German y Abstract. Studying ev ent time series is a p ow erful approach for an- alyzing the dynamics of complex dynamical systems in many fields of science. In this pap er, we describe the metho d of even t coincidence analysis to pro vide a framew ork for quan tifying the strength, direction- alit y and time lag of statistical interrelationships b etw een ev en t series. Ev ent coincidence analysis allo ws to form ulate and test n ull hypotheses on the origin of the observ ed interrelationships including tests based on P oisson pro cesses or, more generally , sto c hastic point processes with a prescrib ed inter-ev en t time distribution and other higher-order proper- ties. Applying the framew ork to country-lev el observ ational data yields evidence that flo o d even ts hav e acted as triggers of epidemic outbreaks globally since the 1950s. F acing pro jected future changes in the statis- tics of climatic extreme ev ents, statistical techniques such as ev ent coin- cidence analysis will be relev ant for in v estigating the impacts of an thro- p ogenic climate change on human so cieties and ecosystems worldwide. (Date: April 7, 2016) 1 Intro duction Climate extremes and related natural disasters are of ma jor in terest for researc h on climate c hange and its impacts, b ecause their frequency and amplitude is pro jected to increase significantly in the future [1,2,3]. How ever, when it comes to the quantifi- cation of impacts of associated natural disasters on ecosystems [4] and so ciety (e.g. in terms of triggering epidemics or social unrest [5]), there are only very few studies pro- viding a systematic assessmen t b eyond individual cases. In-depth studies in this field a e-mail: donges@pik-potsdam.de 2 Will b e inserted b y the editor require tailored statistical analysis tools that allow for a quantitativ e c haracterization of statistical in terdependencies b etw een even t time series and are also applicable to series comprising only a few ev ents. Time series of even ts or even t series, here defined as an ordered set of N even t timings { t 1 , . . . , t N } , are the sub ject of study in many fields of science. In this pap er, suc h even t series are considered as binary , i.e. amplitudes asso ciated to the even t timings t i are either not av ailable or are not taken into account in the analysis (cor- resp onding to a description as unmarked point pro cesses). There are man y real-world examples of ev en t series of this type, including photon arriv al times in physics [6], neuronal spik es in neurosciences [7,8], exc hange of messages on comm unication net- w orks in so cial science [9] or timings of climatic extreme even ts [1,2] and armed civil conflicts [10,11,12] in climate impact studies [13]. Man y recen t studies hav e focused on inv estigating statistical prop erties of single even t series or p oint pro cesses such as in ter-even t time distributions. F or example, the analysis of h uman online comm uni- cation reveals that waiting times b etw een text messages do not follow an exp onen tial distribution as exp ected from an uncorrelated (Poissonian) random pro cess, but in- clude bursts of frequent even ts interrupted b y long perio ds of inactivity that can b e b etter describ ed b y p ow er-law distributions [9]. Ho wev er, less w ork app ears to b e av ailable in the literature on quantifying and systematically studying statistical interrelationships betw een tw o or more ev en t se- ries, particularly when compared to the wide range of metho ds of this type a v ailable for standard time series suc h as P earson correlation [14], mutual information [15] or sync hronization measures [16]. Particularly in neuroscience, tec hniques hav e b een de- v elop ed for measuring the similarity or synchron y of even t series of neuronal spike trains [7,8,17,18,19]. In climatology , measures of even t synchronization hav e b een recen tly applied to study statistical interrelationships b etw een extreme precipitation ev ents and their complex spatial structure [20] using climate net work approaches [21]. More specifically , this approach has been used to unra v el the complex spatio-temp oral patterns of hea vy rainfall ev en ts in the Indian monso on domain [20,22], deriv e predic- tors for extreme flo o d even ts in South America [23] and study regional climatological phenomena related to extreme precipitation o ver Central Europ e [24]. Measures of even t synchronization tend to b e used mostly in an explorativ e mo de of researc h aiming to rev eal asso ciations in large data sets of even t series from neu- roscience or climatology . Ho w ever, some of the curren tly most debated problems in climate impact research, e.g. concerning climate-related v ariables such as extreme temp eratures or the El Ni ˜ no–Southern Oscillation as p otential drivers of armed civil conflicts [10,11], call for a more in-depth analysis of statistical interrelations b et ween ev ent series. Extending up on previously applied even t sync hronization approaches, in this paper we formally put forward the alternative framework of ev ent coincidence analysis [25] for inv estigating in detail the statistical interrelationships b etw een pairs of even t time series and testing hypotheses on the nature of these interrelationships. Ev ent coincidence analysis is designed to measure the strength, directionality and time lag of statistical relations b etw een even t series. The metho d w as introduced in a less general setting to study p ossible statistical interrelationships b etw een nonlinear regime shifts in African paleo climate during the past 5 million years and ev ents in hominin evolution suc h as the app earance and disapp earance of sp ecies [25]. It has also b een applied to in vestigate the impacts of climatic extremes such as droughts and heat wa v es on v egetation pro ductivity based on observ ational data and dynamic v egetation mo del runs [4]. F urthermore, even t coincidence analysis has b een used to ev aluate differen t hypotheses on so cio-economic factors influencing the vulnerability of countries to natural disasters with a focus on the possible triggering of outbreaks of civil conflicts [5]. Will b e inserted b y the editor 3 Event Type B Event Type A Time τ Δ T Fig. 1. Schematic illustration of even t coincidence analysis for quan tifying statistical in ter- relationships b et ween t w o ev en t time series A and B for the case of precursor coincidences. The assumption to b e quantified and tested for is that even ts in B are precursors of even ts in A (under the condition that an A -even t has o ccurred). F o cusing on an ev ent in series A (dark red bar), a (lagged) coincidence o ccurs with ev en ts in series B (dark blue bars) if the latter fall into the coincidence interv al of width ∆T (grey bar) that can b e shifted by a lag parameter τ . Coincidence rates are obtained b y computing the relativ e frequency of o ccurrence of suc h coincidences for all even ts in series A (Sect. 2). W e argue that ev en t coincidence analysis is a particularly useful tool in the area of climate impact studies, since it allo ws to statistically study the effects of such extreme ev ents on other pro cesses and explicitly tak es their nature as ev en t series into account. T o illustrate the capabilities of our approac h, w e emplo y even t coincidence analysis to assess extreme flo o d even ts as p ossible drivers of epidemics extending up on earlier w ork [4,5]. Applying the framework in this case study based on observ ational data yields evidence that, from a globally aggregated p ersp ective, flo o d even ts hav e acted as driv ers of epidemics in the same country in the past. The structure of this pap er is as follows: ev ent coincidence analysis is thoroughly in tro duced in Sect. 2 including descriptions of the basic metho dology , statistical null mo dels for testing hypotheses and related approaches. Subsequently , the results of applying even t coincidence analysis to even t series of extreme flo o ds and epidemics are rep orted in Sect. 3. Finally , Sect. 4 provides conclusions and p ersp ectives for promising future extensions of the ev ent coincidence analysis metho dology . 2 Metho ds In this section, we dev elop the method of ev en t coincidence analysis that is concerned with quan tifying the statistical interrelationships b etw een pairs of ev ent series, ex- tending up on the approach introduced in [25]. A pair of event time series A and B is here defined as tw o ordered even t sets with timings { t A 1 , . . . , t A N A } and { t B 1 , . . . , t B N B } with n um b ers of ev ents N A , N B , resp ectiv ely . Both even t series are assumed to cov er a time interv al ( t 0 , t f ) of length T = t f − t 0 , such that t 0 ≤ t A 1 ≤ · · · ≤ t A N A ≤ t f and t 0 ≤ t B 1 ≤ · · · ≤ t B N B ≤ t f . This yields ev ent rates λ A = N A /T and λ B = N B /T . Ev ent coincidence analysis is based on counting coincidences b etw een ev ents of differen t types. In the following, the assumption to b e quan tified and tested for is that even ts in B precede ev en ts in A , whic h is related to a possible causal influence from B - to A -type ev en ts (Fig. 1). The opp osite case of assuming that even ts in A precede even ts in B can b e accommo dated by exchangi ng the lab els A and B throughout the form ulae and text. An instantane ous c oincidenc e is defined to o ccur if tw o even ts at t A i , t B j with t B j < t A i are closer in time than a temp oral tolerance or c oincidenc e interval ∆T , i.e. 4 Will b e inserted b y the editor if t A i − t B j ≤ ∆T (1) holds. In turn, a lagge d c oincidenc e is defined as an instan taneous coincidence betw een the time shifted even t at t A i − τ , where τ ≥ 0 is a time lag parameter, and the even t at t B j < t A i − τ , i.e. if the condition ( t A i − τ ) − t B j ≤ ∆T (2) is satisfied. Differing from the abov e problem formulation that is consistently used throughout this work, we note that ev ent coincidence analysis can also be performed b y emplo ying coincidence in terv als that are symmetric around A -even ts and relaxing the assumption that B -even ts must precede A -even ts. The resulting condition | t A i − t B j | ≤ ∆T can b e meaningful, e.g. given even t series with pronounced dating uncertainties as in the case of arc heological, paleontological and paleo environmen tal data [25]. In the follo wing, w e in troduce the concept of the c oincidenc e r ate b etw een a single pair of even t series (Sect. 2.1) as well as an aggregated coincidence rate for taking in to accoun t sev eral pairs of even t series (Sect. 2.2). Section 2.3 discusses coincidence statistics for null models of stochastic p oint pro cesses that can be used to test the statistical significance of coincidence rates estimated from data. Moreov er, we put ev ent coincidence analysis into the con text of other related approaches for the analysis of ev ent time series (Sect. 2.4). Man y of the measures and significance tests described b elow are implemen ted in the open source soft w are pac k age CoinCalc [26] written in the programming language R whic h is av ailable at https://github.com/JonatanSiegmund/CoinCalc . 2.1 Coincidence rates for a pair of event series F or quan tifying the strength of statistical interrelationships b etw een tw o even t time series A and B , we introduce t wo v arian ts of coincidence rates addressing B -type ev ents as pr e cursors and triggers of A -type even ts, resp ectively . In the first case, the pr e cursor c oincidenc e r ate r p ( ∆T , τ ) = 1 N A N A X i =1 Θ N B X j =1 1 [0 ,∆T ] ( t A i − τ ) − t B j , (3) measures the fraction of A -t ype even ts that are preceded b y at least one B -type even t (note that multiple B -t yp e even ts within the coincidence interv al are counted only once, see also Fig. 1). Here, Θ ( · ) denotes the Hea viside function (here defined as Θ ( x ) = 0 for x ≤ 0 and Θ ( x ) = 1 otherwise) and 1 I ( · ) the indicator function of the in terv al I (defined as 1 I ( x ) = 1 for x ∈ I and 1 I ( x ) = 0 otherwise). In the second case, the trigger c oincidenc e r ate r t ( ∆T , τ ) = 1 N B N B X j =1 Θ " N A X i =1 1 [0 ,∆T ] ( t A i − τ ) − t B j # , (4) measures the fraction of B -type even ts that are follow ed b y at least one A -t ype ev ent (note that m ultiple A -type even ts within the coincidence in terv al are counted only once). Distinguishing b etw een precursor and trigger coincidence rates allows to introduce a certain notion of directionalit y to the metho d of even t coincidence analysis. F urthermore, the parameter τ allows to explicitly tak e into account lagged relationships b et ween ev ent series. Will b e inserted b y the editor 5 2.2 Aggregated coincidence rates In some applications, it can b e relev ant to hav e at hand an in tegrated measure for coincidences that occur betw een sev eral pairs of even t series as in the case of even ts that are av ailable on a spatial grid or for different regions or countries. F or example, consider m ultiple country-wise sets of A -type even ts (floo ds) and B -t yp e even ts (epi- demic outbreaks) as in the application presented in Sect. 3. In this case, coincidences can only b e meaningfully counted on a p er-country basis, but it is desirable to quan- tify the aggregated coincidence rate ov er all countries in the data set or a suitably filtered subset of countries to obtain a global measure of the strength of the rela- tionship b etw een the t wo even t t yp es considered and its statistical significance with resp ect to different null hypotheses [5]. Another motiv ation for considering aggregate measures of coincidence relationships is related to data qualit y . In some applications with small even t num b ers N A , N B , only aggregation ov er several pairs of even t series allo ws to draw robust statistical conclusions. Analogously to the case of a single pair of even t series, t wo flav ors of aggregated coincidence rates are defined as follo ws giv en a set G of pairs of A - and B -t yp e ev en ts. The aggr e gate d pr e cursor c oincidenc e r ate r G p ( ∆T , τ ) = P k ∈ G P N A,k i =1 Θ h P N B,k j =1 1 [0 ,∆T ] ( t A,k i − τ ) − t B ,k j i P k ∈ G N A,k (5) measures the total num ber of precursor coincidences o ccurring in all pairs of even t series normalized b y the maximum p ossible n umber of such coincidences. Along the same lines, the aggr e gate d trigger c oincidenc e r ate r G t ( ∆T , τ ) = P k ∈ G P N B,k i =1 Θ h P N A,k j =1 1 [0 ,∆T ] ( t A,k i − τ ) − t B ,k j i P k ∈ G N B ,k (6) is the accordingly normalized total num ber of trigger coincidences o ccurring in all pairs of even t series in G . Note that for b oth t ypes of aggregated coincidence rates, m ultiple ev ents falling within the coincidence windo w are coun ted only once, as in the definition of coincidence rates for a single pair of even t series (Sect. 2.1). Studying aggregated coincidence rates can b e seen as a first step tow ards a sys- tematic analysis of coincidences in more general spatio-temp oral even t data. Suc h data can b e conceptionalized as being generated b y spatial or spatio-temp oral point pro cesses [27,28]. More generally , ev ents of interest for an extended even t coincidence analysis can also take the form of higher dimensional ob jects with a nontrivial shap e in terms of, e.g. latitude, longitude and time, such as the spatio-temp oral extremes in the fraction of absorb ed photosynthetically active radiation (fAP AR) iden tified b y Zsc heischler et al. [29]. 2.3 Statistics fo r null mo dels of sto chastic p oint p ro cesses T reating sto chastic p oint pro cesses as generators of even t time series allo ws to de- riv e distributions of coincidence rates to test the statistical significance of the results of even t coincidence analysis based on a hierarch y of null hypotheses, analogously to classical statistics and the metho d of surrogates for standard time series analy- sis [15,30]. Here, w e fo cus on Poisson pro cesses without temp oral correlations betw een ev ents (Sect. 2.3.1) and point processes with a prescrib ed inter-ev en t time distribu- tion P ( ∆t ) that allo w to consider, e.g. pro cesses with heavy-tailed P ( ∆t ) that tend 6 Will b e inserted b y the editor to pro duce bursts of even ts (Sect. 2.3.2). More generally , classes of n ull mo dels for p oin t pro cesses of interest include, for example, even t series with higher-order m em- ory effects suc h as correlations betw een ev en t bursts [31] that are, ho w ev er, beyond the scop e of this pap er. W e also briefly touch up on the p ossibility of constructing surrogate ev ent series from time series surrogates (Sect. 2.3.3). Analytical results are given b elow where a v ailable, otherwise w e rely on Monte Carlo sim ulations. F or illustration, we restrict ourselves to a single pair of even t time series, the case of sets of ev en t series can b e treated analogously . Significance tests based on the null hypothesis of P oisson pro cesses following a Monte Carlo approach are applied in Sect. 3 to quantify the statistical interrelationships b etw een floo d even ts and epidemic outbreaks. 2.3.1 P oisson processes Here, we assume that b oth A - and B -type even ts are generated b y Poisson pro cesses with even t rates λ A and λ B , resp ectively . This assumption implies that b oth types of ev ents are distributed randomly , indep endently and uniformly ov er the contin uous time in terv al of length T . Since our fo cus is on using the deriv ed statistics for h y- p othesis testing on data sets with t ypically small n um b ers of even ts in each series, we assume fixed even t num b ers N A = λ A T and N B = λ B T . Note that the analytically deriv ed estimators presented b elow are only exp ected to yield reliable results in the limit of sufficien tly large even t num b ers N A 1 and N B 1 . (7) First, w e analytically derive the statistics of precursor coincidence rates extending up on [25]. The probabilit y for a (lagged) precursor coincidence betw een an A -even t and a preceding B -even t is giv en by the probability p = ∆T T − τ (8) that a B -even t o ccurs randomly in a segment of length ∆T of the effective time span of in terest T − τ . This follows from the n ull h yp othesis of P oisson processes generating the ev en t series, where the probability for even ts to o ccur is the same in any time instan t and is indep endent from the o ccurrence of other even ts, resulting in a linear dep endence of p on ∆T . Then the probability of a sp ecific A -even t to coincide with at le ast one of the N B B -even ts is given by 1 − (1 − p ) N B = 1 − 1 − ∆T T − τ N B . (9) Note that when counting only exactly con temp oraneous coincidences with ∆T = 0, p = 0 follows in the limit of a contin uous time axis. How ev er, in real-world data sets, the time axis is often discrete, e.g. due to finite sampling interv als or finite numerical precision. In this common case, p = 1 / ( T − τ ) needs to b e used in the following with T and τ measured in n umbers of time steps instead of units of absolute time when the in terest is in coincidences with zero tolerance [32]. Based on this expression, we can calculate the probabilit y P ( K ; N A , 1 − (1 − p ) N B ) that exactly K precursor coincidences are observed for a given realization of the tw o P oisson pro cesses. Ev en though A -ev en ts are assumed to be distributed indep endently in the in terv al [0 , T ], to pro ceed with the deriv ation w e need to further assume that Will b e inserted b y the editor 7 A -t yp e even ts are typically spaced m uc h more widely than the coincidence interv al ∆T , i.e. ∆T T / N A . (10) When this condition (Eq. 10) is fulfilled, the ev en ts that a sp ecific A i -ev ent coincides with at le ast one B -even t and that another sp ecific A j -ev ent coincides with at le ast one B -even t can b e considered statistically indep endent. Only then, P ( K ; N A , 1 − (1 − p ) N B ) is given b y the binomial distribution with N A trials and a success probability 1 − (1 − p ) N B [33] and, hence, P ( K ; N A , 1 − (1 − p ) N B ) = N A K 1 − 1 − ∆T T − τ N B ! K 1 − ∆T T − τ N B ! N A − K . (11) Using the relationship K = r p N A to substitute K by r p in the ab ov e equation yields the distribution of precursor coincidence rates P ( r p ; N A , 1 − (1 − p ) N B ). F rom the distribution (Eq. 11), the expectation v alue h K i and standard deviation σ ( K ) can b e straightforw ardly derived as h K i = N A 1 − (1 − p ) N B = N A 1 − 1 − ∆T T − τ N B ! (12) and σ ( K ) = r N A 1 − (1 − p ) N B (1 − p ) N B = v u u t N A 1 − 1 − ∆T T − τ N B ! 1 − ∆T T − τ N B . (13) This yields the exp ectation v alue of the precursor coincidence rate h r p i = h K i N A = 1 − 1 − ∆T T − τ N B (14) and its standard deviation σ ( r p ) = σ ( K ) / N A = v u u t 1 N A 1 − 1 − ∆T T − τ N B ! 1 − ∆T T − τ N B . (15) The p -v alue of an observ ation K e with respect to the test distribution (Eq. 11), i.e. the probability to obtain a num ber of coincidences K larger or equal to the empirically observ ed num b er K e , is then giv en by P ( K ≥ K e ) = N A X K ∗ = K e P ( K ∗ ; N A , 1 − (1 − p ) N B ) . (16) 8 Will b e inserted b y the editor The statistics of trigger coincidence rates for even t series generated by P oisson pro cesses can be deriv ed analogously b y assuming a wide enough typical spacing of B -even ts: ∆T T / N B . (17) The distribution of the n umber of trigger coincidences K is then given by P ( K ; N B , 1 − (1 − p ) N A ) = N B K 1 − 1 − ∆T T − τ N A ! K 1 − ∆T T − τ N A ! N B − K (18) yielding the exp ectation v alue and standard deviation of the trigger coincidence rate h r t i = 1 − 1 − ∆T T − τ N A (19) and σ ( r t ) = v u u t 1 N B 1 − 1 − ∆T T − τ N A ! 1 − ∆T T − τ N A , (20) resp ectiv ely . As abov e, the p -v alue of an empirically observed n um ber of trigger co- incidences K e can then b e written as P ( K ≥ K e ) = N B X K ∗ = K e P ( K ∗ ; N B , 1 − (1 − p ) N A ) . (21) In the case that the conditions (7), (10) and (17) are not met, Monte Carlo sim- ulations need to be applied to compute statistics of even t coincidence analysis suc h as the mean and standard deviation of coincidence rates or the significance lev el ( p - v alue) of an observed coincidence rate corresponding to the n ull hypothesis that the empirical coincidence rate can b e explained as the result of Poisson pro cesses. T o illus- trate this issue, we compare the expectation v alues and standard deviations of trigger coincidence rates for P oisson pro cesses derived from analytics and Mon te Carlo simu- lation for different relative coincidence interv als ∆T /T and num b ers of B -even ts N B (Fig. 2). Indeed, the statistics are only comparable if conditions (7) and (17) are met, i.e. for N B 1 and N B N c B ( ∆T /T ) = ( ∆T /T ) − 1 (green line in Fig. 2), where N c B ( · ) denotes a critical v alue of N B . Otherwise, Monte Carlo simulations show that the analytical appro ximation tends to ov erestimate the expected coincidence rate and its standard deviation, ev en though the appro ximations (Eqs. 14, 15) sho w the correct asymptotic b ehavior of r → 0 and σ ( r ) → 0 for ∆T /T → 0 and r → 1 and σ ( r ) → 0 for ∆T /T → 1. 2.3.2 Sto chastic p oint p ro cesses with prescribed inter-event time distribution Compared to the Poisson pro cesses discussed abov e, a more general null hypothesis is that the observed v alues of coincidence rates can b e explained by sto c hastic p oint pro cesses with a giv en distribution of inter-ev ent times P ( ∆t ). F or example, the inter- ev ent time distribution for P oisson pro cesses with a verage ev ent rate λ is giv en by the exp onen tial distribution P 1 ( ∆t ) = λe − λ∆t . (22) Will b e inserted b y the editor 9 Fig. 2. Comparison of the exp ected trigger coincidence rate h r p i (A,B) and its standard deviation σ ( r p ) (C,D) obtained using Mon te Carlo sim ulation (A,C) and an analytical ap- pro ximation (B,D) dep ending on the relative coincidence interv al ∆T /T and the n umber of B -type even ts N B . The analytical appro ximation is only accurate in the regime N B 1 and N B N c B ( ∆T /T ) = ( ∆T /T ) − 1 (green line), where N c B ( · ) denotes a critical v alue of N B . In this example, the num ber of A -t yp e even ts is N A = 10, no lag is used ( τ = 0), even ts are distributed in the unit interv al of width T = 1 and m = 1 , 000 trials are used in the Monte Carlo sim ulations for each considered combination of parameters. Ho wev er, it has b een shown that many even t time series display bursting b ehavior asso ciated with in ter-even t time distributions having more slowly deca ying (heavy) tails than the exp onential distribution P 1 ( ∆t ) [9,34]. F or example, human violent conflicts were rep orted to display univ ersal bursting b eha vior [34] asso ciated with in ter-even t time distributions of the form P 2 ( ∆t ) = λF ( λ∆t ) , (23) where F ( · ) exhibits a p o wer-la w decay with exp onent α such that F ( x ) = ax − α (24) yielding P 2 ( ∆t ) ∝ ∆t − α . (25) P ow er-law inter-ev en t time distributions with an exp onen tial cutoff P 3 ( ∆t ) = C ( λ∆t ) α e − λ∆t/β (26) 10 Will b e inserted b y the editor ha ve been rep orted to accurately describ e the return time statistics of earthquakes [35] and other t yp es of even t series. While deriving analytical results for coincidence statistics based on these and other classes of point pro cesses with prescrib ed P ( ∆t ) remains the sub ject of future researc h, Monte Carlo simulations can b e applied to obtain test distributions for assessing the statistical significance of empirically observed coincidence rates. Note that these tests c an only be meaningfully applied in practice if either P ( ∆t ) can b e estimated well from the empirically observ ed in ter-even t time statistics requiring a sufficien tly large n umber of ev ents, or a go o d pro cess understanding exists, i.e. the in ter-even t time distribution is known from theoretical considerations or observ ations from analogous systems. Alternatively , ensembles of surrogate even t series can b e generated b y randomly sh uffling in ter-even t time interv als given a large num ber of ev ents. These conditions are not met for the application studied in Sect. 3, implying the need for restricting the analysis to the n ull h yp othesis of P oisson pro cesses there. 2.3.3 Surrogate event series generated from time series surrogates In a num ber of relev ant applications of ev e n t coincidence analysis, e.g. when study- ing climatological extreme even ts, even t series are generated from underlying time series data. This transformation from time series to even t data is typically achiev ed b y thresholding to iden tify extreme even ts in the time series according to a prescribed quan tile [4,32] or some other form of filtering. In this case, v arious t ypes of time series surrogates [30] can be used to generate ensembles of ev en t series for h ypothesis testing b y applying the same transformation to original and surrogate time series data. F or example, univ ariate iterative amplitude adjusted F ourier transform (iAAFT) surro- gates as implemented in [36] can b e used to generate surrogate even t series based on surrogate time series with the same amplitude distribution and auto correlation func- tion as the original data. This procedure is useful for constructing suitable significance tests for ev en t coincidence analysis when extreme ev ents in the series of in terest tend to cluster due to pronounced auto correlation in the underlying time series data, as it was found to b e the case for Europ ean temp erature, precipitation, tree ring width and simulated net primary pro ductivit y (NPP) [4]. Along these lines, biv ariate ev ent series surrogates deriv ed from biv ariate iAAFT time series surrogates could b e used for testing the n ull hypothesis that observed coincidence rates can b e explained by the co-o ccurrence of extremes due to the conserved linear cross-correlation structure of the underlying pair of time series. 2.4 Related methods The complex systems-inspired framew ork of even t coincidence analysis presen ted ab o ve is conceptually related to measures from spatial statistics for the correlation of spatial and spatio-temp oral p oint process es [27,28] such as Ripley’s cross- K [37] as w ell as v arious forms of regression analysis for point pro cess data. Another popular related approach is considering measures of even t synchronization for quantifying the similarit y of ev en t series [17,20,23]. Hence, the considerations on surrogate even t se- ries and significance tests given ab ov e could b e applied to the latter concept as well, giv en that the requirements and basic assumptions are met. How ev er, it should b e noted that ev ent sync hronization lacks the distinction b etw een coincidence interv al ∆T and lag parameter τ pro vided by ev en t coincidence analysis, and also do es not allo w to distinguish the cases of precursor and trigger coincidences. While the statistical theory of temp oral point pro cesses appears generally less con- solidated than the theory of standard time series [8], a m ultitude of metho dologies for Will b e inserted b y the editor 11 studying statistical interrelationships b et ween ev en t time series hav e b een developed in the neurosciences in the last deca des fo cussing on the sp ecific, but imp ortant, ap- plication to neural spik e trains. These techniques include methods fo cussing on the distributions of relativ e waiting times of ev en ts in series A with respect to even ts in series B [38], cross-correlograms and cross-intensit y functions as well as frequency- domain metho ds, neural spike train deco ding or information-theoretical metho ds [8]. Certainly , this w ealth of alternativ e methodologies holds a great potential for fruit- ful applications in other fields of science, considering, for example, ev ent series of climatological extreme ev ents and natural disasters. It should also b e mentioned that the statistical and mathematical literature con- tains a large num ber of less closely related studies of coincidences, e.g. considering the birthday pr oblem [39]. The term c oincidenc e analysis is also used in different con texts in fields suc h as elementary particle ph ysics [40] or in the identification of causal de- p endencies in configurational data [41]. This is why we c ho ose to use the more sp ecific term event c oincidenc e analysis when referring to the methodology introduced in this pap er. 3 Application: extreme flo o d events as p ossible drivers of epidemics T o illustrate the capabilities of even t coincidence analysis, w e apply it here to analyze the interrelations b etw een t wo types of even t time series of natural disasters, for which a causal relation is commonly assumed in the literature: hydrological flo o ding even ts ( B -even ts) and outbreaks of epidemics ( A -even ts) [42]. Our analysis is p erformed on the EmD A T data base cov ering the time in terv al 1950–2009 in a monthly time resolution [43]. This data base contains 3,468 flo o d ev ents w orldwide that are defined as a significant rise of water level in a stream, lake, reserv oir or coastal region as well as 1,152 epidemic outbreaks, defined as either an un usual increase in the n um b er of cases of an infectious disease that already exists in the region or p opulation concerned, or the appearance of an infectious disease previously absent from a region. F or eac h coun try k in the data base, a pair of ev en t series is a v ailable con taining N f ,k flo o d ev ents and N e,k epidemic outbreaks, resp ectiv ely . As describ ed ab o ve, ev ent coincidence analysis allo ws for tw o differen t test setups: in the first setup, w e test on the basis of the occurrence of epidemic outbreaks and p erform a coincidence test with flo o d even ts preceding epidemic outbreaks within a giv en coincidence in terv al (statistics based on precursor coincidences). Since we an- alyze coincidences based on the condition that an epidemic outbreak has o ccurred, this setup ma y also b e termed a risk enhanc ement test [5]. In the second case, we p erform the even t coincidence analysis on the basis of o ccurrence of flo o d ev en ts that are follo w ed by epidemic outbreaks (statistics based on trigger coincidences). W e call this the trigger test [5], since it inv estigates a p ossible causal direction of flo o d even ts triggering epidemic outbreaks. In the following, w e do not consider additional time lags b etw een different t yp es of ev ents that are not cov ered already by the coincidence in terv al ∆T and, hence, set τ = 0 (see Fig. 1). F urthermore, w e compute aggre- gated coincidence rates cov ering all countries in the data base (Sect. 2.2) as well as coincidence rates on a coun try-wise basis (Sect. 2.1). T o test for statistical significance with the null h ypothesis (NH) that the observed coincidences can be explained on the basis of even t series generated by Poisson pro- cesses with the empirically observ ed even t rates, Monte Carlo sim ulation is applied to generate pairs of surrogate ev ent time series with conserv ed even t num bers on an individual country basis by uniformly and indep endently dra wing N f ,k , N e,k , e v en t timings o ver the full analysis p erio d 1950–2009. W e generate m = 1 , 000 ensemble 12 Will b e inserted b y the editor 0 .2 0 .3 0 .4 0 .5 0 .6 0 .7 0 .8 Precursor coinci den ce r at e (epidemic preceeded by flood) 0 5 10 15 20 25 Coincidence interval Δ T [m onths ] 0 .00 0 .05 0 .10 0 .15 0 .20 0 .25 0 .30 Trigger coinci den ce r at e (epidemic follows flood) A B 9 5% sign lev el 9 9% sign lev el Ob s rate Sign at 95% Sign at 99% Fig. 3. Results of even t coincidence analysis for the flo o d and epidemic outbreak even t time series: Aggregated precursor (A) and trigger (B) coincidence rates. Dotted (dashed) grey lines mark the 95 % (99 %) significance level determined by Monte Carlo simulations. Coincidence rates that are significant at 95 % (99 %) levels are highlighted by b old markers. mem b ers for each coun try and significance lev els of 95 % and 99 % are applied for the rejection of the NH. Figure 3 displays coincidence rates aggregated o ver all countries with av ailable ev ent data for coincidence interv als ∆T ranging from 0 to 24 months. While ∆T = 0 implies considering coincidences within the same mon th, a 24-mon ths windo w counts coincidences b etw een 0 and 24 mon ths after (b efore) a floo ding (epidemic outbreak) ev ent, resp ectively . F or the risk enhancement test, we find that ab out 20 % of all epidemic outbreaks hav e b een preceded by a flo o ding ev en t within a month b efore the outbreak. Our corresp onding results indicate that flo o ds robustly contribute to the outbreak risk (Fig. 3A). While no direct causal attribution is p ossible based on this test, the trigger test (Fig. 3B) also robustly suggests a possible causal relationship. Will b e inserted b y the editor 13 W e find that ab out 7 % of all flo o ding even ts hav e b een follow ed by an epidemic outbreak in the next mon th, which is significant at the 99 % lev el. These results are robust also for other small coincidence interv als. In turn, for windo w widths ∆T exceeding 3 mon ths, we do not find indications that the NH of the aggregated coincidence rate arising by c hance can b e rejected. How ever, this c hanges for window lengths b et ween 9 and 13 months, where the NH can b e rejected at least at the 95 % level, indicating a robust long-range interrelation b etw een the t wo types of even ts. In fact, more than 50 % of all epidemic outbreaks hav e b een preceded by a floo ding even t ov er a 12-months coincidence in terv al and about 20 % of all flo o ding ev ents hav e possibly triggered epidemic outbreaks within the 12 mon ths follo wing the natural disaster. It should b e noted that although we perform m ultiple hypothesis tests for v arying coincidence in terv als ∆T , standard corrections of the significance level to account for these multiple comparisons such as Bonferroni adjustments are not applicable in our case. This is particularly true for the corresp onding univ ersal n ull h yp othesis that no statistical relationship exists b etw een flo o d even ts and epidemic outbreaks for an y of the ∆T [44,45]. In con trast, the tw o detected clusters of ∆T with statistically significan t rates for b oth precursor and trigger coincidences around monthly and ann ual time scales indicate the existence of robust coincidence relationships that are presen t in the data. T o further inv estigate the robustness of these findings, we p erformed Monte Carlo simulations to assess the probability that the null h yp othesis is falsely rejected for fixed pairs of P oisson data surrogates for n v alues of ∆T . W e find that the probability to observe n = 4 falsely rejected tests at a significance level of 99 % (compare Fig. 3) in this setting is less than 0.001, implying that the results presen ted in Fig. 3 can b e considered highly statistically significant when taking the effects of m ultiple testing in the sp ecific setting of our study into account. The global frequencies of flo o d even ts and epidemics are depicted in Fig. 4A,B, and the country-wise trigger coincidence rates for coincidences within the same month and a 12-months coincidence interv al in Fig. 4C,D. While these maps giv e some guidance on where flo o ds may ha ve triggered epidemic outbreaks, they need to b e interpreted with great caution, since no information ab out the statistical significance of these rates is con v eyed. Since coincidence rates are plotted, countries with v ery limited statistics (e.g. only one or v ery few ev ents) can still exhibit high individual coincidence rates. Ho wev er, sev eral epidemic-prone regions such as parts of South America, South-East Asia, India and Sub-Saharan Africa are highlighted as having substantial trigger coincidence rates for b oth coincidence interv als. At the same time, these maps also illustrate a limitation of the tests p erformed here, since the data is provided on a coun try-wise resolution, while the considered ev ents, in particularly floo ds, are b ound to geographical regions and w ater-sheds. This is in particular problematic for larger coun tries, where a sub-country resolution would b e needed to ensure at least the p ossibilit y of a causal relation b etw een the ev ent time series. While this represen ts a clear limitation, it do es not affect the significance of our res ults. The reason is that inclusion of causally unrelated even ts on a coun try basis can only increase the probabilit y of coincidences o ccurring by chance, thereby increasing the significance lev els and rendering the test more conserv ative. While being the most common natural disasters, flo o ds are the leading cause of natural disaster fatalities worldwide: Doo cy et al. [46] estimate global fatalities due to flo o d even ts directly to exceed half a million for the p erio d 1980–2009. At the same time, flo o d ev en ts are also found to increase the risk of outbreaks of fecal- oral, vector-borne and ro dent-borne diseases [47]. Ho w ever, the in terrelation betw een flo o ds and disease outbreaks is found to b e complex and strongly case-dep endent [47] and, as a consequence, difficult to assess in an aggregated fashion using classical statistical metho ds. The ev en t-based even t coincidence analysis applied here pro vides 14 Will b e inserted b y the editor 25 50 75 100 125 150 175 200 8 16 24 32 40 48 56 Number of floods Number of epidemics Trigger coincidence rate 0.1 0.2 0.3 0.4 0.5 0.6 0.7 0.8 0.9 Trigger coincidence rate 0.1 0.2 0.3 0.4 0.5 0.6 0.7 0.8 0.9 Δ T= 12 months Δ T= 0 months A B C D Fig. 4. Global mapping of the frequency of flo o ds (A) and epidemics (B) b etw een 1950 and 2009. Coun try-wise trigger coincidence rates are sho wn for coincidences o ccurring within the same month (C) as well as a coincidence interv al of 12 months (D). Gray fillings indicate a lac k of data for the corresp onding countries. a metho dological alternative by assessing the statistical interrelationships b etw een the t w o t yp es of ev en t time series on a case-to-case basis. In line with a systematic review of the literature on floo ds and human health [48], w e report robust evidence for b oth short-term and long-term impacts of flo o ds on epidemic outbreaks. Sp ecifically , w e find that more than 50 % (20 %) of all epidemic outbreaks hav e b een preceded b y a flo o ding even t within a 12(1)-mon th(s) window b efore the outbreak and that ab out 20 % (7 %) of all flo o ds might hav e triggered such an outbreak in the 12(1) Will b e inserted b y the editor 15 mon th(s) follo wing the natural disaster. Our results indicate statistically significan t coincidence rates up to three mon ths following the disaster and then b etw een 9 and 12 months afterw ards, indicating the imp ortance of seasonal effects, which shall b e further studied in future w ork. In particular in tropical regions, flo o ding even ts are tied to the rain y season as are ma jor drivers in particular vector-borne diseases [49]. Th us, while the significan t short-term coincidence rates might to a large extent b e a direct consequence of the flo o ding even ts, indirect effects will likely dominate the long-term coincidence rates observed, e.g. through impacts on general health, fo o d systems and liv eliho o ds exacerbating pov ert y and potentially maln utrition that increase long-term susceptibilit y for diseases [48]. It is imp ortant to note, ho wev er, that the clustering of flo o ds and epidemics during the rainy season in tropical countries could lead to statistically significant long-term coincidence rates due to the counting of causally unrelated even ts in successiv e rainy seasons. This effect should b e controlled for in future studies. Giv en the pro jected increase in flo o d risk under anthropogenic climate change [50,51], our findings highlight the risk of such natural disasters for h uman health and call for an integrated view on climate and health risks in adaptation efforts. As a note of caution, we would like to stress again the illustrativ e nature of the results of even t coincidence analysis presented for this particular application. More detailed analyses including additional and indep endent data bases and taking int o account systematic effects suc h as biases induced by changes in self-rep orting b ehavior as ha ve b een rep orted for EmDA T and other data bases [52] are relev an t sub jects of future researc h. 4 Conclusions In this work, we ha v e introduced ev en t coincidence analysis as a metho d for in ves- tigating statistical interrelationships b et ween even t time series suc h as climate ex- tremes, natural disasters or civil conflicts and other sources of even t-lik e data. Even t coincidence analysis builds up on already established metho dologies suc h as even t sync hronization or measures of correlation b etw een spatial point processes and allows to quan tify the strength (via the coincidence rate), directionalit y (by distinguishing precursor and trigger coincidences) and lag of suc h interrelationships. Statistical sig- nificance tests for these prop erties hav e been prop osed based on differen t kinds of n ull h yp otheses on the nature of the temp oral p oint pro cesses underlying the even t series, including Poisson pro cesses and sto chastic p oin t pro cesses with a given inter-ev ent time distribution. As an exemplary application in the timely context of global anthropogenic cli- mate c hange, we hav e employ ed even t coincidence analysis for studying statistical in terrelationships b etw een flo o d ev en ts and epidemic outbreaks in the same country on a globally aggregated lev el. W e hav e found evidence that flo o d even ts ma y ha v e acted as p ossible drivers of epidemic outbreaks in the past, underlining this p oten tial causal relationship as an important sub ject of further studies in climate impact and adaptation researc h. Promising further methodological dev elopmen ts include the design and more de- tailed mathematical analysis of appropriate n ull hypotheses for even t coincidence analysis including analytical deriv ations of the corresponding test statistics as well as the incorporation of even t amplitude information [53], i.e. b y considering mark ed p oin t pro cesses. Spatial information could b e taken in to account more explicitly than is the case for the aggregated coincidence rates studied in this paper, building up on a notion of spatio-temporal coincidences with links to the theory of spatial [27] and spatio-temp oral p oint pro cesses [28]. F urthermore, multiv ariate extensions such as 16 Will b e inserted b y the editor partial or conditional ev en t coincidence analysis [54] for measuring statistical in ter- relations betw een t wo even t series conditional on a third or ev en more even t series, e.g. metho ds extending up on the PC-algorithm and its v ariants [55], w ould allow to extract further information from ric h sources of even t data in h yp othesis-driv en as w ell as exploratory research mo des [8]. This research was p erformed in the context of flagship pro ject COP AN on Co evolutionary P athw a ys in the Earth system and the BMBF Y oung In v estigators Group “Complex Systems Approac hes to Understanding Causes and Consequences of P ast, Present and F uture Climate Change” at the Potsdam Institute for Climate Impact Researc h. W e appreciate funding by a Hum b oldt Univ ersity / IRI THESys fellowship, the Stordalen F oundation (via the Planetary Boundary Research Netw ork PB.net), the Earth League’s EarthDo c program, the German F ederal Ministry for Education and Researc h (BMBF pro jects GLUES and CoSy-CC 2 (gran t no. 01LN1306A)) and the Ev angelisc hes Studienw erk Villigst. The work was supp orted by the German F ederal Ministry for the En vironmen t, Nature Conserv ation and Nuclear Safet y (11- I I-093-Global-A SIDS and LDCs). Jobst Heitzig, Marc Wiedermann and Miguel Mahec ha are ac knowledged for helpful insights and discussions at v arious stages of the rep orted research. Ev ent coincidence analyses can be performed using the R pack age CoinCalc [26] which is a v ailable at https://github.com/JonatanSiegmund/CoinCalc . References 1. S. Rahmstorf, D. Coumou, Pro c. Natl. Acad. Sci. USA 108 (44), 17905 (2011) 2. D. Coumou, S. Rahmstorf, Nat. Clim. Change 2 (7), 491 (2012) 3. T.F. Stock er, D. Qin, G.K. Plattner, M. Tignor, S.K. Allen, J. Bosch ung, A. Nauels, Y. Xia, V. Bex, P .M. Midgley , eds., Climate Change 2013: The Physic al Scienc e Basis. Contribution of Working Gr oup I to the Fifth Assessment R ep ort of the Inter govern- mental Panel on Climate Change (Cambridge Universit y Press, Cambridge, 2013) 4. A. Rammig, M. Wiedermann, J.F. Donges, F. Babst, W. v on Bloh, D. F rank, K. Thon- ic ke, M.D. Mahecha, Biogeosciences 12 (2), 373 (2015) 5. C.F. Sc hleussner, J.F. Donges, R.V. Donner, H.J. Schellnh uber, in review (2015) 6. A. Kuhn, M. Hennrich, G. Remp e, Phys. Rev. Lett. 89 (6), 067901 (2002) 7. R.Q. Quiroga, T. Kreuz, P . Grassberger, Ph ys. Rev. E 66 (4), 041904 (2002) 8. E.N. Bro wn, R.E. Kass, P .P . Mitra, Nat. Neurosci. 7 (5), 456 (2004) 9. Y. W u, C. Zhou, J. Xiao, J. Kurths, H.J. Schellnh uber, Pro c. Natl. Acad. Sci. USA 107 (44), 18803 (2010) 10. S.M. Hsiang, K.C. Meng, M.A. Cane, Nature 476 (7361), 438 (2011) 11. S.M. Hsiang, M. Burke, E. Miguel, Science 341 (6151), 1235367 (2013) 12. S.M. Hsiang, M. Burke, Clim. Change 123 (1), 39 (2014) 13. H.J. Schellnh ub er, B. Hare, O. Serdeczny , M. Schaeffer, S. Adams, F. Baarsch, S. Sch wan, D. Coumou, A. Robinson, M. Vieweg et al., T urn down the he at: climate extr emes, r e gional imp acts, and the c ase for r esilienc e. (International Bank for Reconstruction and Dev elopment, W orld Bank, 2013) 14. P .J. Bro ckw ell, R.A. Davies, Time series: the ory and metho ds , 2nd edn. (Springer, New Y ork, 2002) 15. H. Kantz, T. Schreiber, Nonlinear time series analysis , 2nd edn. (Cambridge Universit y Press, Cam bridge, 2004) 16. A.S. Piko vsky , M.G. Rosenblum, J. Kurths, Synchr onization: a universal c onc ept in nonline ar scienc es (Cam bridge Univ ersity Press, Cambridge, 2001) 17. T. Kreuz, F. Mormann, R.G. Andrzejak, A. Krasko v, K. Lehnertz, P . Grassb erger, Ph ysica D 225 , 29 (2007) 18. T. Kreuz, J.S. Haas, A. Morelli, H.D.I. Abarbanel, A. Politi, J. Neurosci. Meth. 165 (1), 151 (2007) Will b e inserted b y the editor 17 19. J. Dauw els, F. Vialatte, T. W eb er, A. Cichocki, in A dvanc es in Neur o-Information Pr o- c essing (Springer, Berlin Heidelb erg, 2009), V ol. 5506 of L e ctur e Notes in Computer Scienc e , pp. 177–185 20. N. Malik, B. Bo okhagen, N. Marw an, J. Kurths, Clim. Dyn. 39 (3–4), 971 (2012) 21. J.F. Donges, I. Petro v a, A. Lo ew, N. Marwan, J. Kurths, Clim. Dyn. 45 (9), 2407 (2015) 22. V. Stolb ov a, P . Martin, B. Bo okhagen, N. Marwan, J. Kurths, Nonlin. Pro c. Geoph ys. 21 (4), 901 (2014) 23. N. Bo ers, B. Bo okhagen, H.M.J. Barb osa, N. Marw an, J. Kurths, J.A. Marengo, Nat. Comm. 5 , 5199 (2014) 24. A. Rheinw alt, N. Bo ers, N. Marw an, J. Kurths, P . Hoffmann, F.W. Gerstengarb e, P . W erner, Clim. Dyn. 46 (3), 1065 (2015) 25. J.F. Donges, R.V. Donner, M.H. T rauth, N. Marwan, H.J. Schellnh uber, J. Kurths, Pro c. Natl. Acad. Sci. USA 108 (51), 20422 (2011) 26. J.F. Siegmund, N. Siegmund, R.V. Donner, Preprint arXiv:1603.05038 [stat.ME] (2016) 27. J. Moller, R.P . W aagep etersen, Statistic al inferenc e and simulation for sp atial point pr o c esses (CR C Press, 2003) 28. P .J. Diggle, in Statistic al metho ds for sp atio-temp or al systems , edited b y B. Fink enst¨ adt, L. Held, V. Isham (CRC Press, 2007), V ol. 107 of Mono gr aphs on Statistics and Applie d Pr ob ability , pp. 1–46 29. J. Zscheisc hler, M.D. Mahecha, S. Harmeling, M. Reichstein, Ecological Informatics 15 , 66 (2013) 30. T. Sc hreib er, A. Schmitz, Physica D 142 (3), 346 (2000) 31. H.H. Jo, J.I. Perotti, K. Kaski, J. Kertesz, Phys. Rev. E 92 , 022814 (2015) 32. J.F. Siegmund, M. Wiedermann, J.F. Donges, R.V. Donner, Biogeosciences Discuss. 12 , 18389 (2015) 33. E.T. Jaynes, G.L. Bretthorst, Prob ability the ory: the lo gic of scienc e (Cam bridge Uni- v ersity Press, Cambridge, 2003) 34. S. Picoli, M. del Castillo-Mussot, H.V. Ribeiro, E.K. Lenzi, R.S. Mendes, Sci. Rep. 4 , 4773 (2014) 35. ´ A. Corral, Ph ys. Rev. Lett. 92 (10), 108501 (2004) 36. J.F. Donges, J. Heitzig, B. Beronov, M. Wiedermann, J. Runge, Q.Y. F eng, L. T upikina, V. Stolb o v a, R.V. Donner, N. Marwan et al., Chaos 25 (11), 113101 (2015) 37. P .M. Dixon, in Encyclop e dia of envir onmetrics (Wiley Online Library , 2006) 38. D.H. Pe rkel, G.L. Gerstein, G.P . Mo ore, Biophys. J. 7 (4), 419 (1967) 39. P . Diaconis, F. Mosteller, J. Am. Stat. Asso c. 84 (408), 853 (1989) 40. D. Zab oro v, Physics of Atomic Nuclei 72 (9), 1537 (2009) 41. M. Baumgartner, A. Thiem, The R Journal 7 (1), 176 (2015) 42. D. Campbell-Lendrum, D.D. Chadee, Y. Honda, L. Qiy ong, J.M. Olw och, B. Revic h, R. Sauerb orn, in Climate Change 2014: Imp acts, A daptation, and V ulner ability. Part A: Glob al and Se ctor al Aspe cts. Contribution of Working Gr oup II to the Fifth Assessment R ep ort of the Inter governmental Panel on Climate Change , edited by C.B. Field, V.R. Barros, D.J. Dokken, K.J. Mach, M.D. Mastrandrea, M. Bilir, M. Chatterjee, K.L. Ebi, Y.O. Estrada, R.C. Genov a et al. (Cambridge Universit y Press, Cambridge, United Kingdom and New Y ork, NY, USA, 2014), c hap. 11, pp. 709–754 43. D. Guha-Sapir, R. Below, P . Hoy ois, EM-DA T: International Disaster Datab ase , – www.emdat.b e — Univ ersite Catholique de Louv ain – Brussels – Belgium. 44. K.J. Rothman, Epidemiology 1 (1), 43 (1990) 45. T.V. P erneger, Brit. Med. J. 316 (7139), 1236 (1998) 46. S. Do ocy , A. Daniels, S. Murray , T.D. Kirsch, PLoS Curr. 5 , 1 (2013) 47. M. Ahern, R.S. Kov ats, P . Wilkinson, R. F ew, F. Matthies, Epidemiol. Rev. 27 , 36 (2005), ISSN 0193936X 48. K. Alderman, L.R. T urner, S. T ong, En viron. Int. 47 , 37 (2012) 49. J.T. W atson, M. Gay er, M.A. Connolly , Emerging infectious diseases 13 (1), 1 (2007) 50. N.W. Arnell, S.N. Gosling, Clim. Change 134 (3), 387 (2016) 51. Y. Hirabay ashi, R. Mahendran, S. Koirala, L. Konoshima, D. Y amazaki, S. W atanab e, H. Kim, S. Kanae, Nat. Clim. Change 3 , 816 (2013) 18 Will b e inserted b y the editor 52. D.D. Saulnier, K. Brolin, International Journal of Public Health 60 (7), 781 (2015) 53. S. Suzuki, Y. Hirata, K. Aihara, Int. J. Bifurcation Chaos 20 (11), 3699 (2010) 54. J.F. Siegm und, T.G.M. Sanders, I. Heinric h, E. v an der Maaten, S. Simard, G. Helle, R.V. Donner, F rontiers in Plan t Science (in review) (2016) 55. J. Runge, V. Petoukho v, J.F. Donges, J. Hlink a, N. Ja jcay , M. V ejmelk a, D. Hartman, N. Marw an, M. Palu ˇ s, J. Kurths, Nature Communications 6 , 8502 (2015)
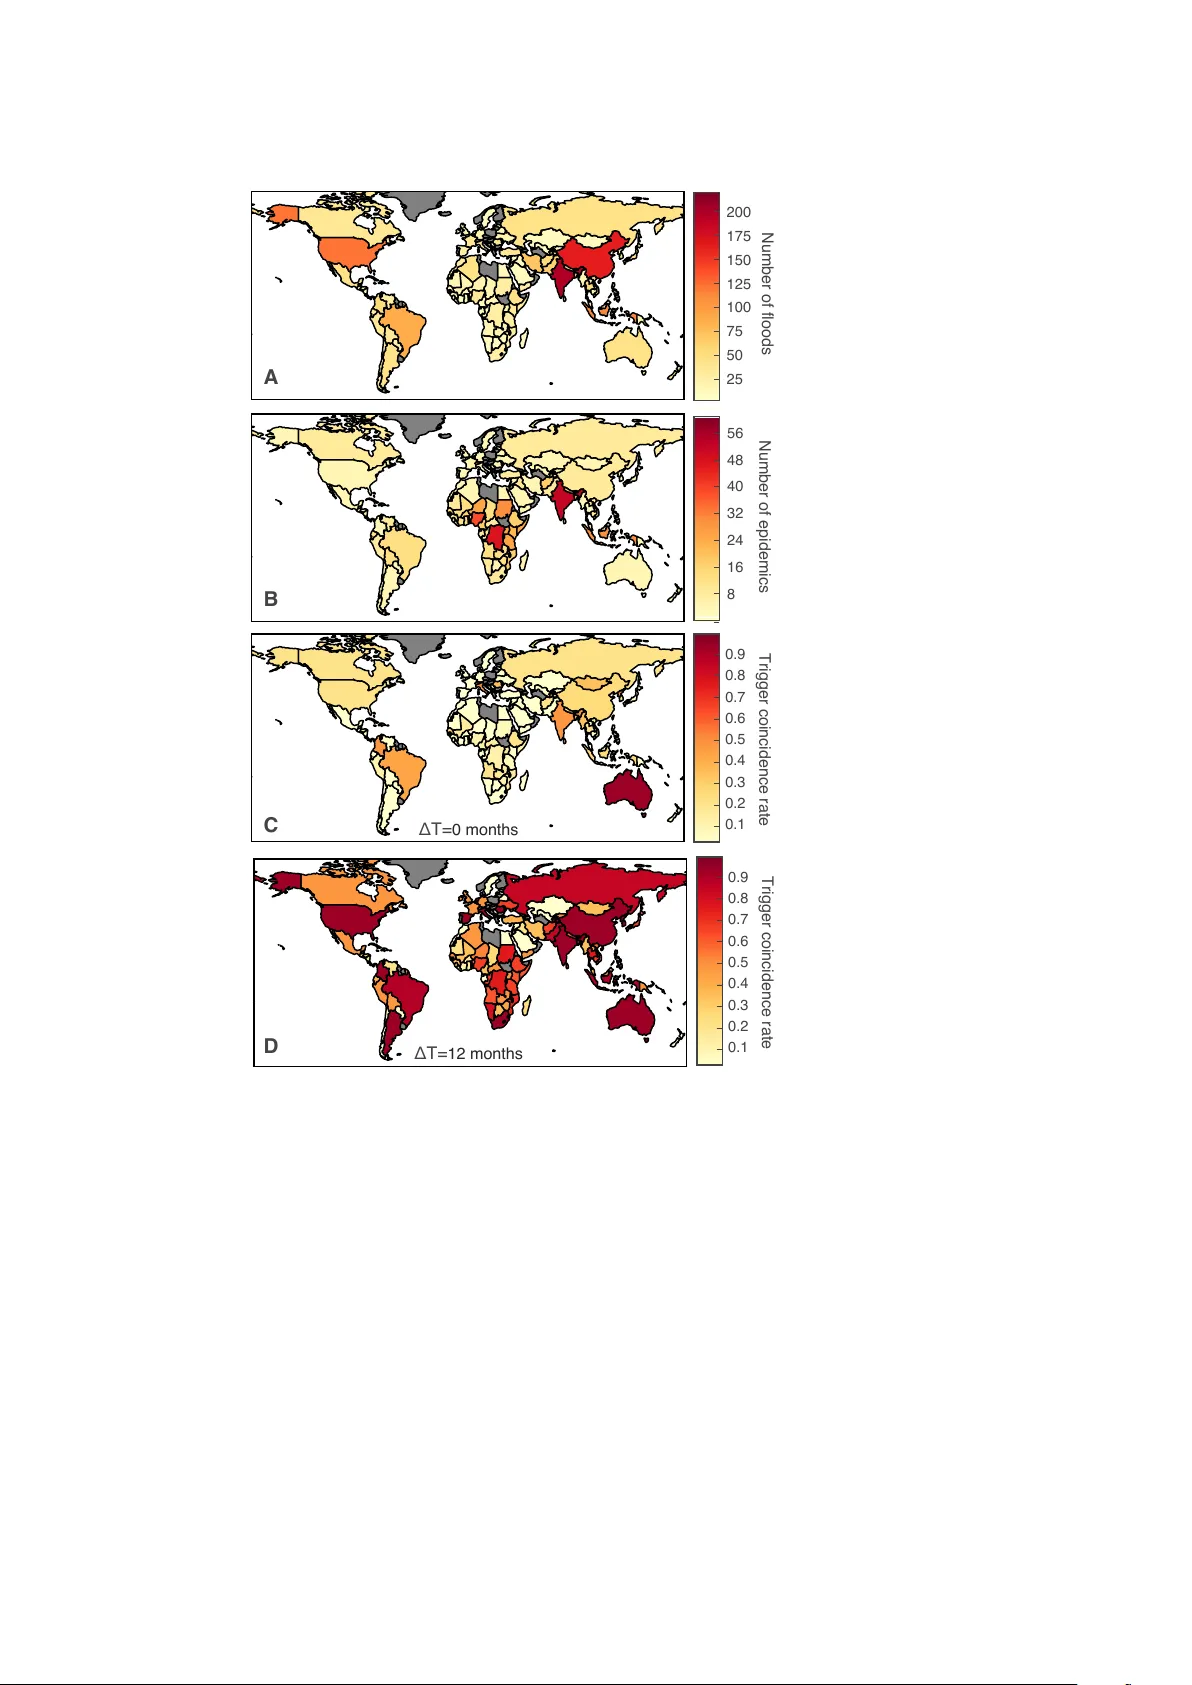
Original Paper
Loading high-quality paper...
Comments & Academic Discussion
Loading comments...
Leave a Comment