Efficient Attack Graph Analysis through Approximate Inference
Attack graphs provide compact representations of the attack paths that an attacker can follow to compromise network resources by analysing network vulnerabilities and topology. These representations are a powerful tool for security risk assessment. B…
Authors: Luis Mu~noz-Gonzalez, Daniele Sg, urra
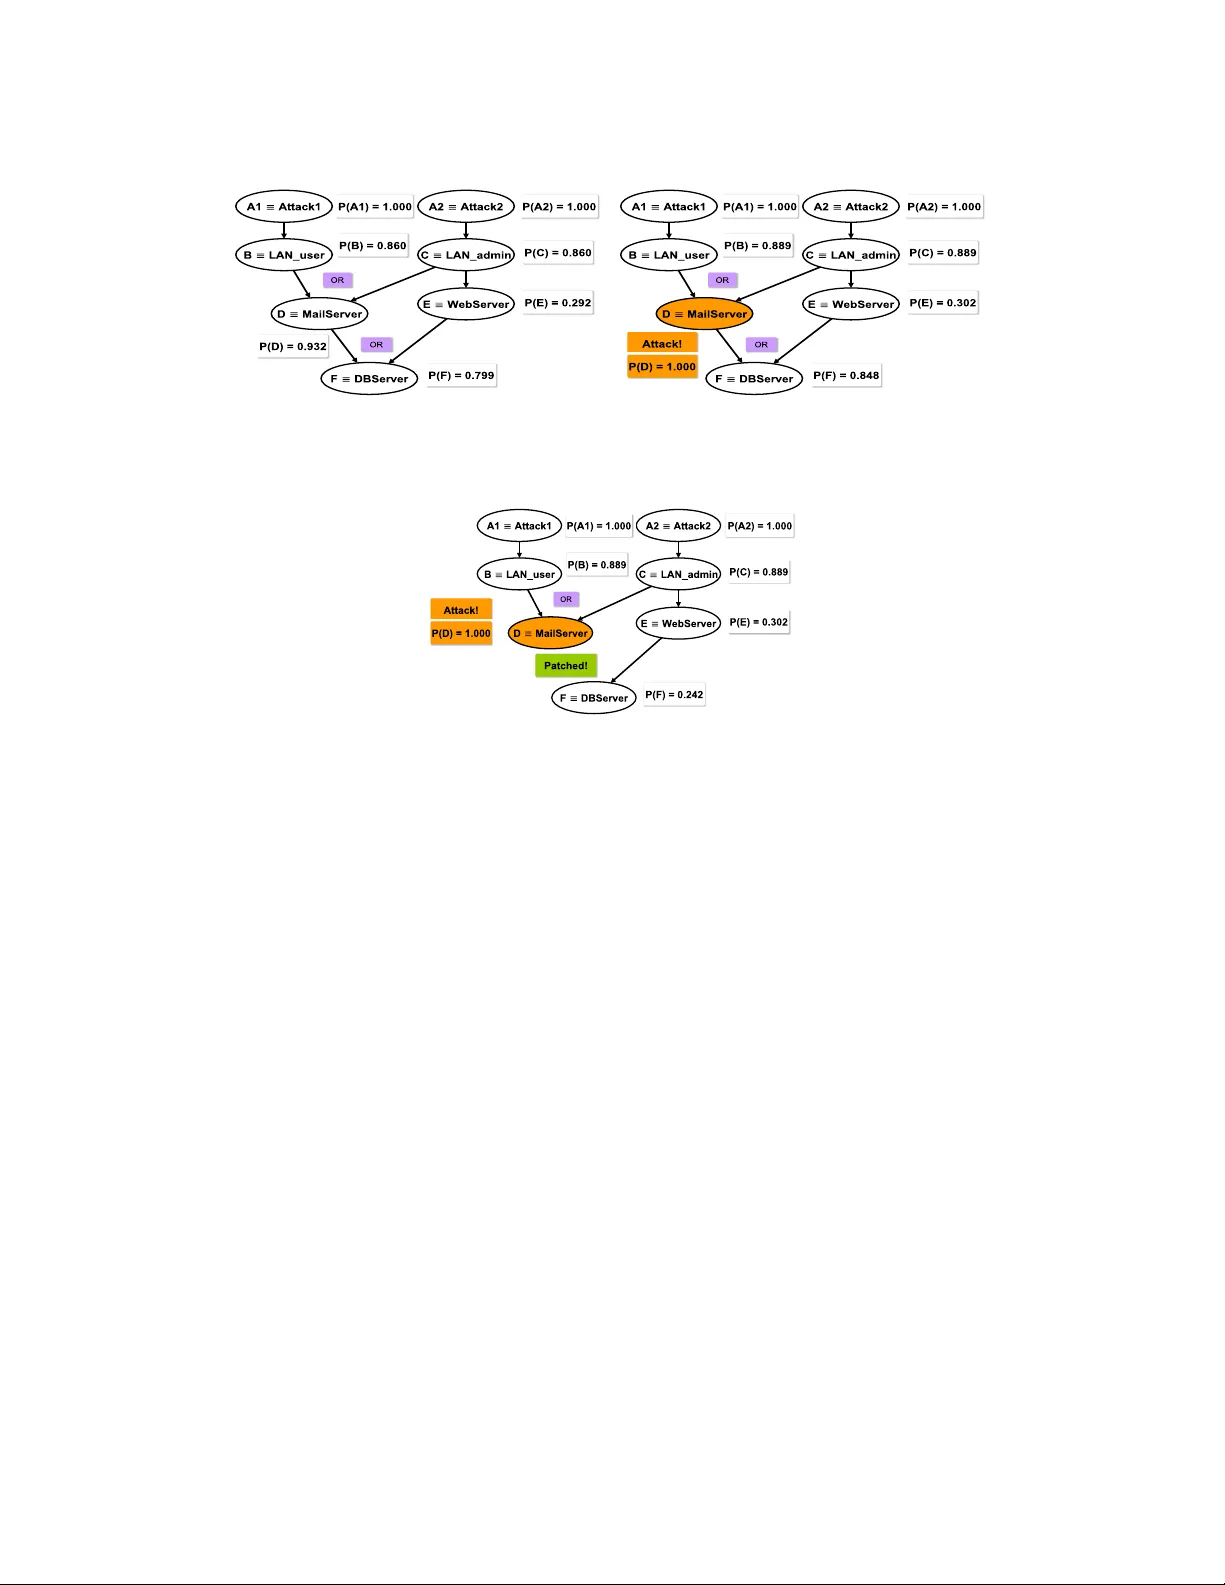
0 Efficient Attac k Graph Analysis thr ough Appro ximate Inference LUIS MU ˜ NOZ-GONZ ´ ALEZ , Imperial College London D ANIELE SGANDURRA , Imperial College London ANDREA P A UDICE , Imperial College London EMIL C . LUPU , Imperial College London Attack graphs provide compact representations of the a t tack pat h s that an attacker can follow to compro- mise network resources by analysing network vulnerabilities an d topology . These representations are a powerful tool for security risk assessment. Bayesian inference on att a ck graphs enables th e estimation of the risk of compromise to th e system’s components given their vulnerabilities a n d interconnections, and ac- counts for multi-step att a cks spreading th roug h t h e system. Whilst stat i c analysis considers th e risk posture at rest, dynamic an alysis also accounts for evidence of compromise, e.g . from SIEM software or forensic in - vestigation. However , in this context, exact Bayesian in ference techniques do not scale well. In this paper we show how Loopy Belief Propagation - an approximate in ference technique - can be applied to attack g raphs, and tha t it scales lin early in the nu mber of n odes for both static and dynamic a n alysis, making su ch analy- ses viable for larger networks. W e experiment w ith different topologies and netw ork clustering on s ynthetic Bayesian attack gr aphs with thousan ds of node s t o s how that th e algorithm’s accuracy is acceptable and converge t o a stable solution. W e compare sequential and parallel versions of Loopy Belief Propagation with exact inference tec hn iques for b oth static and dynamic analysis, showin g th e advanta g es of ap proximate inference techniqu es to scale to larger attack graphs. General T erms: Security risk assess ment, attack g raphs, dynamic analysis Additional K ey W ords and Phrases: Bayesian networks , probabilistic graphical models, approximate infer - ence 1. INT RODUCTION Despite significant ef forts to pr otect networks against cyber-att acks [Gartner , Inc. 2014], system administrators cann ot cop e with the sop histication of mo d ern threats , as shown by the history of breaches that organizations have suffered in recent years [Lord 2015]. One of the most comm o n strategies to pro tect networks is to identify and patch v u lnerabilities . How ever , this is often not systematically done, either for lack of manpower o r be cause it r e quires interrupting critical systems. A risk-drive n approach is the refore neede d to optimise resources for network protection. Such an approach requires assessing the ne tworks risks, prior itizing the most critical threats , and the n estimating the risk exposu res , give n the likelihood of thre ats and the severity of the impacts [ Wheeler 2011]. Finally , these values are used by administrators to se le ct ap- propriate counterme asures . But often this analy sis is carried out separately for each of the networ k co mpone n ts ig n oring interdepe ndencie s be tween v u lnerabilities , i.e. h ow successfully ex ploiting a vulne rability allows an attacker to explo it other v ulnerabili- ties , thus mo ving acro ss the network and acquiring privileges at every step. These shortcomings can be addressed using Attac k Graphs (AGs) [She yner et al. 2002; Albanese e t al. 2012], a well-established technique to represent the possible paths of an attacker thro ugh the system by exploiting successive vu ln e rabilities . AGs allow system administrators to reason abou t threats and risks in a formal way to better select counterme asures [Ingols et al. 2009]. Two typ es of analysis can be undertaken. Static a nalysis dete r mines the a p riori risks to which network c ompone nts are e x- This work has been supported by th e UK government un der EPSRC grant EP/L022729/1. Authors’ address: Department of Computing, Imperial Colleg e London, 180 Qu een’s Gate, SW7 2AZ, London, UK. E-mail: { l.munoz, d.sgan durra, a.paudice15, e.c .lupu } @imperial.ac.uk. 2016 1094-9224/2016/06-ART0 $15.00 DOI: http://dx.doi.org/10.1145/0000000.0000000 ArXiv preprint, V ol. 0, No. 0, Article 0, Pu blication date: June 2016. 0:2 L. Mu ˜ noz-Gonz ´ alez et al. posed. Dyna mic analysis updates tho se risks in ligh t of any indication that some of the network compo nents may h ave been compro mised, e.g. f rom Security Inf ormation and Event Managem ent (SIEM) and I ntrusion Detection Systems (ID S). Dynamic analysis also allows administrators to p rofile the attacker’ s paths, to determine the n o des that are m o re likely to be attacked in the n e xt steps. This en ables administrators to e valu- ate the security risk for valuable resour c es in the n etwork and re ason about the node s that may h ave been already compro mised when we observe e vidence of an o ngoing at- tack. As org anizations are often under attack, dyn amic analysis giv e s administrators important in sigh ts on the most vulne r able targets and w here the y should spend their efforts at run-time. Altho ugh several metrics h ave been proposed to pe rform secur ity risk assessment using AG s [Idika and Bhargava 2012; Noel and Jajodia 2014], tak- ing into consideration the length and the number of paths that le t the attacker reach a goal, o r the global impact of the e x isting v ulnerabilities in the netwo rk, they fail to con- sider the difficu lty of exp loiting each vu ln erability and the depend encies between the differen t attack p aths . In this sen se, it is easy to observ e that both static and dynamic analysis of AG s have inheren t probabilistic characteristics give n the uncertainty about the attackers’ ability to successfully exploit vu lnerabilities . Therefo re, considering the depend encies betwe en vu ln erabilities , Bayesian N etworks (BNs) p rovide an appr opri- ate framew ork to mode l AGs, since they dep ict cau sal relationships betwe en random variables in a comp act way , so that they can model the uncertainty about the attacker’s behaviour and cap abilities . Bayesian Attack Graph s (BAGs) can be analysed through efficie nt algorithms, such as V ariable Elimination o r Junction Tree (JT), to make exact infere n ce , i.e. to co mpute the unc onditional probabilities of all the nod es in the BAG, i.e. the p robabilities that an attacker can reach the diff erent security states in the AG [Mu ˜ noz-Gon z ´ alez et al. 2015]. However , computing these probabilities in BNs is kno wn to be an NP-Hard problem [Co oper 1990], and this limits the app licability of ex act inf erence techniques to me dium-size graphs (in the orde r of 100-1,000 nod es), especially when the structure of the graph is d ense [Mu ˜ noz-Gon z ´ alez e t al. 2015]. However , em pirical inve stigations show that networks are h ighly com p lex: estimates of mean corp orate network size are in the order o f tho usand o f n odes [Sharma e t al. 2011; Raftop oulos and D im itro poulos 2013]. Moreov er , each host may have somewhe r e betwe en 2 and 11 vulne rabilities according to [WhiteHat Secu rity 2015]. F or example, W ebsites are repo rted to have an average of 6.5 vulnerabilities [Symante c 2015]. This impacts the size of the AGs, as the number o f vulnerabilities also determines the n umber o f po tential attack paths. In this contex t exact infe rence techniques would be very slow and computationally very expe nsive, which limits their app licability for p r actical purpo ses , especially f o r the dynamic analysis of BAGs . F o r this reason, simpler m etrics , co mputationally le ss demanding, have been pro posed fo r tractable analysis o f AG s in re al n etworks [Idika and Bharg ava 2012; Noel and J ajod ia 2014]. However , these metrics do no t consider the depe ndencie s between vulnerabilities. T o sidestep this limitation we propose to use appro ximate inference te chniques to allow us to analyse AGs in large r networks in a tractable way . Although making ap- proximate infer ence in BN s is also NP-Hard [K oller and Friedman 2009], approximate inference algo rithms , such as Loopy Belie f Prop ag ation (LBP) [Pearl 1988], h ave better scalability than e xact infere n ce techniques. W e should not be deterre d by the “appro x - imation” involv ed in this con text for two re asons. First, because the p robabilities are used for pr ioritising thre ats , so eve n if significant diffe rences betwee n them are mean- ingful, their absolute or accurate values are r e latively less impo r tant. Secon d, because the probability of successful exploitation of a v ulnerability is already a rough estimate, often based on Commo n V ulnerability Scoring System (CVSS) [Common V ulne r ability Scoring System, V 3 2015], which ign ores other f actors such as attacker’s skills , know l- ArXiv preprint, V ol. 0, No. 0, Article 0, Publication date: June 2016. Efficient Attack G raph Ana lysis through Approximate Inference 0:3 edge and too ling and, he nce, the y may not be an accurate indication of compro m ise per se . Therefore, notwithstanding their inheren t app roximation, the better scalability of the se algor ithm s makes them highly crucial to pe rform qualitative risk analysis o f large networks. Although the validity o f the results is limited by the error s in the esti- mates o f the probabilities , in our ex perimental ev aluation we show that the accuracy of the pro bability e stimates provide d by LBP is reasonable for static and dynamic risk analysis and mitigation using BAGs. The main contributions of this work are as follows: — T o the be st of our knowledge, we are the first to propose the use of appro ximate inference techniques for the scalable analysis of AGs. Furthermore, we pro pose and compare both the sequential and parallel implem entations of LBP to estimate the probabilities o f comp romise for the netw o rk node s . — W e prov ide a compreh ensive ex perimental ev aluation using synthetic AGs which em- ulate the comple x ity of real scen ario s . These exp eriments allow us to assess the ap- plicability of sequen tial and parallel impleme ntations of LBP for the analysis of AGs with thousands of nod es, and show the limitations of existing e xact infer e nce ap- proaches, such as the JT algorithm [She noy and Shafer 1990]. — W e show through exper ime nts that LBP scales linearly in the number of n odes for both static and dynamic analysis of BAGs, which contrasts w ith the e xponen tial scal- ability of exact infere nce (e.g. JT) in some cases , e specially when the AG is dense. The experime nts further show that the accuracy o f LBP is sufficien t fo r many practical needs ex hibiting a rooted me an squared error smaller than 0 . 03 . — Finally , we show that it is p ossible to get accurate results be fore the LBP algorithm fully co nverge s , by allowing administrators to mo nitor the p robability e stimates at each iteration, and enabling the m to start planing risk mitigation strategie s in ad- vance. This is not possible w ith ex act inference technique s. The re st o f the paper is org anised as fo llo ws. In Section 2 we discuss the related work, and in Se ction 3 we describe the two typical representations o f AGs. In Se ction 4 we introduc e the Bayesian AG mode l, including an examp le of a small typical corp orate network as a use case. The use of Belief Propagation and LBP fo r the analysis o f BAGs is d escribed in Se ction 5. W e discuss the Junction Tree algorithm proposed in [Mu ˜ noz- Gonz ´ alez et al. 2015] in Section 6. I n Se c tio n 7 we present the e xperime n tal re sults for the static and dynamic analysis of synthetic AGs. Finally , in Section 8 we presen t the main conclusions and ou r plans f or furthe r work. 2. REL A TED WORK AG repre sentations are built by analysing the interd epend e ncies betwee n the vulner- abilities and the secu rity conditions iden tifie d in a ne twork. Two representations are commonly en countered in the literature : State-based repre sentations [Jha et al. 2002; Phillips and Swiler 1998; Sheyne r e t al. 2002; Sheyner and Wing 2004; Swile r et al. 2001] depict the who le state o f the netwo rk in each node in the gr ap h whilst l o gical AGs [A m mann et al. 2002; Jajodia et al. 2005; O u et al. 2006] are bipartite graphs rep- resenting the dep endenc ies betwe en vulnerabilities and security conditions. Although state-based AGs contain all the po ssible attack paths that can allow an attacker to reach a target security con dition, the y scale e xpone ntially with the numbe r of vulner- abilities and nodes in the network, which limits their application to ve ry small net- works. Relyin g on the mono tonicity principle, lo gical AGs eliminate duplicate paths and prov ide a more co mpact repr e sentation that scales po lynomially with the nu mber of vuln e rabilities [Ammann et al. 2002; Jajodia et al. 2005]. AGs are a po w erful tool to perf orm risk assessment and diff erent metrics have been proposed in the literature. [Lippmann et al. 2006] prop o se to use the percentage of ne t- ArXiv preprint, V ol. 0, No. 0, Article 0, Publication date: June 2016. 0:4 L. Mu ˜ noz-Gonz ´ alez et al. work assets an attacker has co mpromised. How ever , this m e tric is not goal-o riented, as it is the case o f AGs. [P amula et al. 2006] propo se the weakest adversary metric, i.e. measure the risk acco rding to the w e akest attack path in the graph. Simpler ap - proaches are used in [Phillips and Swiler 1998; Ortalo e t al. 1999; Li and V aughn 2006], where they pro pose to use the shortest path, the nu m ber o f paths, and the av- erage path len g th as metrics to me asure risk. In a similar way , [Id ika and Bh argava 2012] propo se the nor m alized me an, standard deviation, mod e, an d median of the p ath lengths as a set of me trics to assess risk in AG s. In [Noe l and Jajodia 2014] p r o pose a metrics suite for AG that takes into accoun t the CVSS score s of the vulnerabilities in the AGs as well as topo lo gical aspects of the graph, such as the connectivity , the number of cy cles , and the dep th. How e ver , m ost of these metrics fail to account fo r the depend encies o f the vulnerabilities and attack paths, as well as the difficulty to ex - ploit the v ulnerabilities . These limitations can be addressed with pro babilistic mod e ls , which allow to comp ute the probabilities of e ach no de in the graph to be compro m ised by an attacker whe n the network is at rest or under attack. Probabilistic mo dels for AGs h ave been already propo sed in the literature: F or ex am- ple, [Frigault e t al. 2008; W ang et al. 2008] pre sent mechanisms to c alcu late the con- ditional probability tables , which re p resent the pro babilities o f com promising a n o de given all po ssible states o f the pare nt nodes (or precondition s). Howev er , no mecha- nism is pro posed to calculate the uncondition al probabilities , i.e. the pro babilities of compromising the nodes in the ne twork regardless o f the state of their corr e spond- ing pre conditions. A more co mplete Bayesian mo d el is described in [Xie et al. 2010], which takes into accoun t non-p erfect behaviour of the alert corre lation system and the impact of zero-d ay v ulnerabilities. How ever , no inferenc e te chnique is proposed to cal- culate the u nconditional probabilities and the ex perimental e valuation does no t show the applicability of the ir mo del to n etworks o f diffe rent sizes . Several techniques have also been p r o posed in the literature f o r ex act inference on BAGs . F or examp le, forward-backward p ropagation is proposed in [Poolsappasit e t al. 2012] to comp ute the uncond itional p robabilities . Ho w ever , this pro cedure is only valid for chains [ Rabiner and Juang 1986; Murp hy 2012] and c annot be ap p lied to g eneral AGs. [Liu and Man 2005] propose to use V ariable Elimination ( V E) [D echter 1996] f or exact inferen c e on BAGs. Although this is an ef ficient technique, it is h ighly depe ndent on the he uristic fo r the elimination orde r ing and no heuristic is sugg ested in [Liu and Man 2005]. Further m ore, none o f the se papers re ports an e xperimen tal evaluation of the time and memo ry required by the techniques p r o posed to assess their suitability for static and dynamic analysis of AGs. More rec e ntly , the JT algorithm was pro posed in [Mu ˜ noz-Gon z ´ alez et al. 2015] for exact in f erence in BAGs. This technique allow s us to efficien tly compute the exact uncondition al probabilities by using a probabilistic message p assing scheme on a clique tree representation of the original g raph [Shenoy and Shafe r 1990; Shafer and Sheno y 1990]. The exper im e ntal evaluation in [ Mu ˜ noz- Gonz ´ alez et al. 2015] show s the advantages of JT over VE in terms of the time and the me mory required . Howeve r , the applicability of JT to large netwo rks is limited, especially whe n the AG s are dense, i.e. there are a lot of attack paths. [Baiardi et al. 2014], [Baiardi and Sgandurra 2013] present a Monte Carlo-based method to generate AGs by simulating intelligent attackers’ plans. By co llecting sam- ples in these simulations , the pro p osed too l returns a dataset used to co mpute statistics of intere st for the assessment, such as the success pro bability of the agents or their av- erage impact. [Sommestad et al. 2009] pre se n t a Bayesian framewo r k to expre ss AGs that e nables the comp utation o f the pro bability that attacks w ill succee d, and the cor- responding e xpected loss g iven the instantiated architectural scenario. [Cupp ens et al. 2002] propo se a framewo r k to correlate attacks with intrusion goals, and introduce the notion of anti-corre lation, which is usefu l to d ecide whe ther a sequence of correlated ArXiv preprint, V ol. 0, No. 0, Article 0, Publication date: June 2016. Efficient Attack G raph Ana lysis through Approximate Inference 0:5 actions can lead to an intrusion. He nce, it can also be used to e liminate f alse po sitives . [T an et al. 2003] introduce s two algorithms to cluster ho sts based on their observed connection patterns considerin g that they can change ove r time. The e xperime ntal re- sults obtained for r eal networ ks show that the number of clusters can be two orders of magnitude smaller than the n umber o f hosts. There fore, w e can use these clusters to produce smaller AGs that can accurately summarise the state o f the n etwork. 3. A TT A CK GRAPHS AGs are gr ap hical mo dels that r e present the kno wledge abou t ne twork vulne rabilities and their interactions, sho wing the diff erent paths an attacker can f ollow to reach a given goal by exploiting a set of vulnerabilities. Alo ng each attack path, vulne rabilities are exploited in seque nce, so that each successful explo it give s the attacker more priv- ileges towards his go al. In the literature of AGs we can distinguish two main types of representations, namely state-based and lo gical AGs. Definition 3.1 . A state-based AG is a tuple AG = { S, τ , S 0 , S t } , whe re S is a set of states , τ ⊆ S × S is a transition re lation, S 0 ⊆ S is a set of initial states , an d S t ⊆ S is a set of target states [Sheyner et al. 2002]. State-based re presentations of AGs [ Jha et al. 2002; Phillips and Swiler 1998; Sheyner et al. 2002; Sheyne r and Wing 2004; Swile r et al. 2001] result in directed graphs, w here e ach no d e repre sents the state o f the who le ne tw ork after a successful atomic attack. This approach has two main shortcoming s: First, the number o f states and variables combinatorially explode s when incre asing the nu mber of nodes in the network. Sec ond, these represen tations contain duplicate attack paths that diffe r only in the ord er of the attack steps, w hich increases the comple xity of the graph . This lim- its the applicability o f state-based rep resentations to very small networks [Amm an n et al. 2002; Jajodia et al. 2005; Ou et al. 2006]. The scalability problems of state-based representations are overco m e with lo gical AGs , which are bipartite graphs which repre sent de p endenc ies betwee n ex ploits an d security cond itions [Ammann e t al. 2002; Jajodia e t al. 2005]. More formally: Definition 3.2 . A log ical AG is a d ire cted bipartite graph G = ( E ∪ C, R r ∪ R i ) , where the v ertices E and C are the sets of exploits and security con ditions, re spectively , and the edg e s R r ⊆ C × E and R i ⊆ E × C are require and imply relations [Albanese et al. 2012]. These represe n tations re ly on a mono tonicity pr inciple: that the attacker nev er r e- linquishes privileg es once obtained. Althoug h no t always app licable, this assumption is reasonable in most cases, as discussed in [Ammann et al. 2002]. Monotonicity al- lows to remove duplicated paths and to generate AGs that gr o w polynom ially with the number of vulnerabilities and the nu mber of conne cted pairs of hosts [Albanese et al. 2012]. 4. BA YESIAN A TT ACK GRAPHS Some of the literature on AG analysis assumes that mono tonicity induces a Direc ted Acyclic Graph (D AG) structure of logical AG s [Liu and Man 2005; P oo lsappasit et al. 2012; Mu ˜ noz-Gon z ´ alez et al. 2015]. Althou g h mo notonicity helps to g et rid of many cycles re lated to duplicate attack paths (that appe ar in state-based re p resentations) some cycles still remain. Ho wever , [ W ang e t al. 2008] explain how to handle an d e limi- nate cycles w ithout loss of integ rity . In this pape r , we consider AGs with a DAG struc- ture. Where cycles appe ar , we refer to [W ang et al. 2008] to build the correspondin g conditional p robability tables in the n odes affected by the cy cle. The DAG structure of logical AGs, the un certainty about the attacker’ s behaviour and capabilities , make ArXiv preprint, V ol. 0, No. 0, Article 0, Publication date: June 2016. 0:6 L. Mu ˜ noz-Gonz ´ alez et al. BNs a suitable alternative to mo del AGs and pe rform static and dynamic analysis. In particular , BNs allow us to calculate the probability of an attacker to reach a security condition ( state) in the AG. Definition 4.1 . A BN is a directed acyclic g raphical model wh ere the no des repre- sent random variables and the directed edg es repr e sent the d epende ncies between random variables. Let X = { X 1 , ..., X n } be a set of (co ntinuous or discrete) random variables . The joint pro bability distribution c an be written as: p ( X ) = n Y i =1 p ( X i | pa i ) (1) Then, un der the BN rep resentation, f or e ach no de X i there is a d ire cted edg e fr om e ach node in pa i , the set of parents node s of X i , po inting to X i . In the contex t of the BAG , the node s represent the diffe rent security states that an attacker c an reach. W e mode l the be h aviour of these states as Bernoulli random variables . Hence, the probability o f an attack e r to comp r omise a node X i is Pr ( X i = T ) = p , wh ereas the probability of an attacker not to comp r omise that node is Pr ( X i = F ) = 1 − p , with p ∈ [0 , 1 ] 1 . The probabilities of an attacker successfully explo iting a vulne rability , neede d to compute the cond itional probabilities p ( X i | pa i ) in (1), are represente d as p aram e ters of the model, since these value s varies slowly across time (in the order of days or wee ks). 4.1. Mode l Assumptions In line with much o f the r e lated work [Liu and Man 2005; Frigault et al. 2008; P o ol- sappasit et al. 2012; Mu ˜ noz-Gon z ´ alez e t al. 2015], we make some assumptions on o ur model: — W e consider that the probability of successfully explo iting a single vulne rability does not affect the pro babilities that the attacker can succe ssfully ex ploit other vulne r - abilities . W e also assume that these probabilities remain nearly con stant in time. Although in [Frigault e t al. 2008] the dynamic aspects of vulnerabilities are mod- elled with a dy n amic BN , in p ractice change s to the probabilities typ ically o ccur over periods of days or we eks. Theref ore, we argue that it is be tter to recomp ute the mode l when changes occu r rather than to incre ase the comp lexity o f the m o del to include the dynamic aspects of these p robabilities . — W e assume that the p robability of succe ssfully ex ploiting a vu lnerability is the same regardless of the attac ker . However , these probabilities can be updated according to other models that take into account the attackers’ capabilities and pref erences [Baiardi and Sg an d urra 2013]. F or e xample, we can use diff erent sets o f AG param- eters correspo nding to differe nt attacker mo dels identifie d as propo se d in [Baiardi and Sgandurra 2013]. W e can then select, acc ording to the attacker model, the corre - sponding parameter s to pe rform the dynamic analysis of the A G. — W e also assume that the topolo gy of the netwo rk, host connectivity ( in cluding ope n ports) and the set of vulner abilities do n o t change d u ring the dynamic an aly sis of the BAG . This would require dynamic AG g e neration, which is out of the scope o f this paper . Howeve r , if ex isting v ulnerabilities are patched at run- time, our BAG repre - sentation can be easily up dated by setting the probability o f successful ex ploitation of the patched vulnerabilities to zero. O n the contrary , if new vu lnerabilities are dis- covere d or new nodes are added to the network, a new AG ne eds to be gen erated. 1 T o simplify the mathematical n otation we will refer to t he unconditional probability of a node to be com- promised as Pr ( X i ) in stead of Pr ( X i = T ) ArXiv preprint, V ol. 0, No. 0, Article 0, Publication date: June 2016. Efficient Attack G raph Ana lysis through Approximate Inference 0:7 — W e do no t co nsider zero- day v ulnerabilities , social engine ering attacks , and insider threats . Altho ugh it is easy to inco rporate these kind s of thre ats in the AG by add ing one extra attack path to e ach security cond ition in the gr aph, as p r o posed in [P oo l- sappasit et al. 2012; Xie e t al. 2010], the difficu lty lies in estimating a reasonable probability of successful exploitation o f those ze ro-day vulne rabilities and social en- gineering attacks . In fact, no mechanism fo r the estimation of these p robabilities is proposed in the literature, e x cept from letting the n etwork administrator quantify their effe cts ( in a subjective way) [ P oolsappasit e t al. 2012; Xie e t al. 2010], which is howeve r a challenging task. A mo re d e tailed description of the dif fi culties to e stimate the imp act of zero-day vulner abilities in AG s can be found in [Albanese et al. 2013]. 4.2. Cond itional Probability T ables The information available at each nod e X i in a BAG is the co nditional pro bability distribution p ( X i | pa i ) , the probability of a node to be compr o mised g iven the state o f its parent n odes pa i . Thu s , these condition al probabilities rep resent the probabilities of an attacker to re ach a security state X i given the o bservations of its pre conditions pa i and the vulne rabilities v i that can be e xploited to com p romise X i . In this sense, we consider that the probabilities of successfully exploiting v ulnerabilities are paramete r s of the BAG m odel that are used to calculate p ( X i | pa i ) . A c ommon app roach to estimate p v i , the probability o f an attacker successfully ex- ploiting a vulne r ability v i , is based upon CVSS [Com m on V ulnerability Sco ring Sys- tem, V3 2015]. Although CVSS score s are intende d to estimate the imp act of a vulner- ability rather than its average pro bability of being successfully exploited , CVSS sco r es (or some of the ir submetrics) are o ften used in the literature to estimate p v i [Frigault et al. 2008; P oolsappasit e t al. 2012; Mu ˜ noz-Gon z ´ alez et al. 2015]. In this sense, the exploitability submetric of CVSS can be considere d more ap p ropriate to estimate p v i , since it tries to measure the d ifficulty of exploiting a vulnerability . Finally , g iven an estimate of the probabilities o f ex ploitation of the vulne rabilities that allow an attacker to reach a secur ity state X i from states pa i , w e consider two pos- sible cases to build the con ditional p robability tables [Poolsappasit et al. 2012; Mu ˜ noz- Gonz ´ alez et al. 2015]: AND and OR cond ition al probability tables . In the first case, all the preco n ditions need to be satisfied to be able to co mpromise X i , i.e. the attacker needs to compromise all the node s in pa i before being able to perfo rm an attack to com- promise X i . In the case o f OR co nditional pro bability tables , the attacker o nly ne eds to co mpromise o ne of the node s in pa i to attempt an attack to reach the security state X i . Considering that the alert system is no t pe rfect (the ID S can trigger false alarms or miss events, and that some othe r e vents maybe stealthy) and that its estimated error rate is p e , AND c onditional pro bability tables can be calculated as: p ( X i | pa i ) = ( p e , ∃ X j ∈ pa i | X j = F 1 − (1 − p e ) (1 − Q j : X j p v j ) , otherwise (2) whereas for O R conditional pro bability tables, using the noisy-O R fo rmulation [K oller and Friedman 2009], we have: p ( X i | pa i ) = ( p e , ∀ X j ∈ pa i | X j = F 1 − (1 − p e ) Q j : X j (1 − p v j ) , otherwise (3) Estimating the e rror p robability , p e , o f the alert corre lation system is diffi c u lt due to the dy n amic aspects o f the system behaviour . I n this sense, several appro aches esti- mate this e rror probability based on ad hoc method ologies and test the system un der ArXiv preprint, V ol. 0, No. 0, Article 0, Publication date: June 2016. 0:8 L. Mu ˜ noz-Gonz ´ alez et al. particular conditions [Milenkoski et al. 2015]. More recently , [Juba et al. 2015] propo se a nove l approach to evaluate alert co rrelation systems prov iding statistical guarantees on the measured perfor mances. Combining (2) and (3) w e can exten d the c o nstruction of co nditional pr o bability ta- bles to interme diate cases, where differe n t subsets of p recond ition s need to be satisfied before tryin g to co mpromise X i . As prop o sed in [Xie et al. 2010], the non- perfec t be - haviour of the ale rt system can also be mod elled by adding an e xtra node O i to describe the observation from the alert system. Thus, X i , w hich d escribes the actual state of the node, would be the pare nt of O i . Then, the condition al pr obability table p ( O i | X i ) can be built taking into accou nt the estimation of the false alarm and detec tio n r ates of the alert system. 4.3. Prior on the Attacker’ s Initial State In AG r epresentations, there is usually a leaf node repre senting the initial state o f the attacker when the attacker has not co mpromised any nod e in the network ye t. F o llo w- ing the mo del in [Mu ˜ noz-Gon z ´ alez et al. 2015], we consider that this node is not really a rand o m variable, since it only represents that the attacker has full righ ts on his ow n machine. Under the Bayesian represen tation, we can consider that the Berno ulli ran- dom variable X 0 representing the initial state o f the attacker has Pr ( X 0 ) = 1 . Although [P oolsappasit et al. 2012] prop ose to u se this initial node to refl ect some subjective prior kno w ledge of the attacker capabilities (by letting the ad m inistrator set the value of Pr ( X 0 ) ), this can lead to misleading conclusions, especially when reasoning using new e vidence about the no des that an attacker may have alread y compr omised, as dis- cussed in [Mu ˜ noz-Gon z ´ alez et al. 2015]. Finally , to obtain mo r e accurate e stimations of the uncon ditional p robabilities n e eded for the analysis of BAGs , w e can break lo ops in the BN by instantiating one initial node for each p ossible initial attack p ath. This does not affect the value of the uncon ditional probabilities of the r e st o f the no des but can favour the con v ergenc e and the accur acy of LBP estimates [Murphy e t al. 1999]. 4.4. Stat ic and Dynamic Analysis of the B A G F or the static analysis o f AG s we are intere sted in calculating the u nconditio nal prob- ability distribu ti o ns p ( X i ) , rather than p ( X i | pa i ) . Thus, p ( X i ) corr e sponds to the p r ob- ability of an attacker to reach a given security co ndition and, he nce, is an indicator o f the risk. Using Bayes rule, it is p ossible to calculate p ( X i ) f r om the product of condi- tional pro bability distributions: p ( X i ) = X X − X i p ( X ) = X X − X i n Y j =1 p ( X j | pa j ) (4) where X − X i indicates that we sum o v er all the set of r an dom variables X excep t X i . In contrast, fo r the d y namic analysis of AG s , given evid e nce of attacks on a set of no des X e , e.g. through SIEM ale r ts, we ne e d to comp ute the posterior probability p ( X i | X e ) , i.e. the pro bability of an attacker to compromise the node X i given that w e have observe d evide nce of attack at nod e s X e . Ag ain, using Bayes rule, we can c o mpute this p o sterior distribution from the joint pro bability distribution: p ( X i | X e ) = p ( X i , X e ) p ( X e ) = P X −{ X i , X e } p ( X ) P X − X e p ( X ) (5) Howeve r , the exact calculation of (4) and (5) is an NP-Hard pro ble m [K oller and Friedman 2009]. Thus , ap plying bru te for ce and c o mputing the j o int probability dis- tributions to m ake inferenc e in p r obabilistic g raphical mo dels is n o t a r e asonable ap- proach in terms of compu tational time and memory . Thus, e fficient algorithms, such ArXiv preprint, V ol. 0, No. 0, Article 0, Publication date: June 2016. Efficient Attack G raph Ana lysis through Approximate Inference 0:9 as V ariable Elimination (VE) [D echter 1996] or Junction Tree (JT) [ Shenoy and Shafer 1990; Shafer and Sheno y 1990], are necessary eve n f o r small graphs. How e ver , the applicability of these techniques is limited, e specially w h en the graphs are dense, de- manding a lot of memory to co mpute the unconditional pro babilities . In these cases, approximate inf e rence is a reasonable altern ative to enable a tractable estimation of the uncon ditional and po sterior probabilities. Althoug h approxim ate infe rence in BNs is also NP-Hard [K oller and Friedman 2009], e fficient techniques like LBP [P earl 1988] allow u s to e fficiently estimate the un conditional and the p osterior probabilities in (4) and (5) for large netwo rks . In Sec tio n 5 w e describe how to use LBP for the analysis of BAG . 4.5. Applyin g Bayesia n Atta ck Gr a phs for Se curity Risk Assessmen t and Mitig ation The BAG mo del can be app lied in practice by system administrators to perf orm se- curity risk assessment and risk mitigation strategie s . F or both ap p lications we also distinguish two kind of analysis: static , i.e. co n sidering the security posture of the net- work at rest, and dyna m ic , i.e. when the netwo rk is op e rative and attack s may occur . F or risk as sessment , the BAG mode l can be built from the networ k topo logy , network reachability , and the results of a vulnerability analysis. Then , we can c ompute the conditional probability tables fo r the n odes in the BAG by determining the v alues o f the succe ssful explo itation of vulne r abilities. As show n bef ore, this c an be done using the exp loitability submetric of the C V SS score. On the resulting BAG we c an use ex act or approximate inference technique s , such as the JT alg o rithm or LBP , to perform static risk assessment by computing the u nconditional pro babilities of all the n o des. These p robabilities can be used as risk e stimates to d etect weak areas in the netw o rk and serve as an input f or netw o rk hardenin g o r static risk mitigation technique s . F or dyn amic risk assessment, we recompu te the pr obabilities of the BAG mo del at run-time taking into acc o unt indication s that some of the networ ks compo nents can have been com promised, for example fr om IDS or SIEM. Thus, the state of the rando m variables represented by the correspond ing node s for w hich we observe e vidence of compromise are set to 1 (the true state). Then, the posterior pr obabilities of the rest of the nodes given the ev id ence of the co mpromised no des are computed. This allows system administrators to dy namically profile the po ssible attack paths . On the other h and, the un conditional and po sterior probabilities prov ided by the BAG model can be used to mitigate the potential or existing risks in the network by proposing security cou ntermeasures to effe c tive ly re duce the risk of the target no des to be co mpromised. In this sense, the ne twork hard e ning technique s prop osed in [No el et al. 2003; Albanese et al. 2012; Dewri et al. 2007] aim to eliminate or reduce the risk of compr o mising a target node by pro posing a set of counterme asures. In [N oel et al. 2003; Albanese et al. 2012], this is achieve d using mo notonic log ic heuristics, whereas in [Dew ri et al. 2007] the au tho rs also c onsider a cost model of impleme n ting the coun- termeasures. Howe v er , these techniques are re stricted to static risk mitigation. In con- trast, [Poolsappasit et al. 2012] mode l risk mitigation as a d iscrete reasoning pro blem solved using a gene tic alg o rithm that can be applied for dy namic risk mitigation in combination with the o u tput provid e d by a BAG mode l. 4.6. Exa mple In this subsection we sho w an example of analysis of a BAG in the scen ario de picted in Fig. 1, wh ich represents a typical small co rporate network. W e will also use this example to illustrate and ex p lain the infe rence algorithms described in Sections 5 and 6. In detail, for the ne twork in Fig . 1 w e have an internal LAN fo r cor porate employee s , and a DMZ hosting the co mpany’s serv ers, n ame ly , a public W eb serv er , a Mail server , ArXiv preprint, V ol. 0, No. 0, Article 0, Publication date: June 2016. 0:10 L. Mu ˜ noz-Gonz ´ alez et al. Fig. 1 . Example of a Small Network with one LAN , a M ail server , a W eb server , and a Datab a s e server . and a local Database server (used to store public and p r ivate data). F o r each nod e, we have ind icated the set of reachable ports , and f rom w hich o ther node s they are reachable: this set includes tho se por ts op e n/filtered by the firewall, as w ell as those open/closed by loc al firewalls, switches , ro uters, etc. In addition, we have hig hlighted some vulne r abilities that migh t be present on the netwo r k n odes. As an examp le, the W eb server can be accessed on port 80 and port 43 by any othe r no de (and also fro m the Inte rnet), whereas it can be reached on po r t 22 (SSH server) o nly from the IP ad- dresses belonging to the “ Adm in PC” no d e in the LAN 2 . Further , we suppose this node has a v ulnerability affecting the SSH server ( CVE-2015-6564). F or each vuln e rability , we show in Fig . 1 over which port it can be e x ploited (in case the vulne rability is a remote one) , the CVE ide ntifier , the type of vulnerability (Do S, elevation of privileg e, etc.), an d the likelihood o f explo iting such a v ulnerability . W e have based this likelihood on the CVSS Exploitability Subscore, which we have divide d by 10. In our p articular example, w hen the co rrespond in g score is 1.0 (which means, an e xploit already e xists and it is re ady/easy to use), we have de cided to lo wer the value to 0.95, since a p roba- bility of successful exp lo itation of 1.0 means that the attacker has alread y re ached the next security state, without necessarily exploiting the vulne rability , which is not true. Finally , w e suppose a ge neric attacker exists that is willing to launch attacks fro m the Internet. The BAG representation for this e xample is shown in Fig. 2. F ollowing the guidelines described bef ore, w e have two nodes A 1 and A 2 that re present the initial attacker’ s state f o r the two possible initial attack paths, and the final o bjective o f the attacker is to compro mise the D atabase server (no de F ). With these settings, the joint pro bability for all the n odes in the BAG can be written as: p ( A 1 , A 2 , B , C , D , E , F ) = p ( A 1 ) p ( A 2 ) p ( B | A 1 ) p ( C | A 2 ) p ( D | B , C ) p ( E | C ) p ( F | D, E ) (6) In Fig . 2.( a) we sho w the r esult o f the static analysis of the BAG , where we are interested in c o mputing the un conditional probabilities when no e vidence of attack is observed . In this case, w e observe that the Database serve r can be compromised with a pro bability of 79 . 9% and that this high risk is due to the high p robability of compromising the Mail server . W e can use this analysis to prioritize patching o f the 2 If n ot explicitly indicated, it means that an y other port is closed. ArXiv preprint, V ol. 0, No. 0, Article 0, Publication date: June 2016. Efficient Attack G raph Ana lysis through Approximate Inference 0:11 (a) (b) Fig. 2 . BAG example: (a) Unconditional probabilities for the static analysis. (b) Posterior probabilities when there is evidence of attack at the Mail S erver . Fig. 3 . Updated posterior probabilities when the vuln erability from the Mail Server to the Data Base server has been patched in the BAG example in Fig . 2. most critical vulner abilities present in the ne twork, as pro p osed in [Albanese et al. 2012]. An example of dynamic analysis of the BAG is shown in Fig. 2.(b), where we consider that the alert co rrelation system trigg ers an alarm o n the Mail server . F or the sake of clarity , we have consider e d here a perfe ct behaviour of the ale rt correlation system. Fig . 2.(b) shows the posterio r p robabilities for all the n e twork node s give n the evide n ce of compr o mise at n ode D . As exp ected, we o bserve that the risk of com p romising the Database serv e r incre ases to 8 4 . 8% . Whe n reasoning about the po tential attack path allowing the attacker to co mpromise the Mail serve r , the posterior probability of both nodes B and C is the same - in this e xample the paths are equally likely . In Fig. 3 we show the up d ated po sterior p r obabilities whe n the system administrator has patched the v ulnerability fro m the Mail Server to the Data Base Server , so that the co rrespondin g attack p ath has been remo ved in the BAG representation. T o re - compute the p osterior probabilities, we just n eed to update the conditional probability table for nod e F (the Data Base server) by considering that the probability o f succe ss- ful explo itation of the vu lnerability from the Mail Serv e r is zero. Then, we recompu te the posterior probabilities give n the evide nce of attack in the Mail Serv er . As shown in Fig. 3, this cou n termeasure re duces the risk of the Data Base server being compro - mised from 84 . 8% to 24 . 2 % . In the next section we describe how these pro babilities can be efficie ntly c omputed. 5. SCAL ABLE INFERENCE ON B A YESI AN A T T ACK GRAPHS In this section we introduce two efficie nt techniques to make infe r e nce in BAGs: Be- lief Pro pagation (BP) and Loopy Belief Propagation (LBP). Both algo r ithms are based ArXiv preprint, V ol. 0, No. 0, Article 0, Publication date: June 2016. 0:12 L. Mu ˜ noz-Gonz ´ alez et al. Fig. 4 . F actor Graph representation for the BAG in Fig. 2 removing the attack path from the LAN admin to the Mail server . on message passing schemes that allow to comp ute the unconditional p r obabilities of the no des in BNs or Markov Rando m Fields (MRFs). While BP is a method for ex act inference, it is restricted to tree o r polytree grap h structures. O n the contrary , LBP is an appr oximate inferen ce technique that can be applied to grap hs with lo ops. 5.1. Beli ef Propagation As mentioned earlier , BP allows to compute the uncond itional probabilities in a BN or a MRF when the graph is a tree o r a polytree [P earl 1982; 1988]. Althou gh this structure is re strictive for AGs in g eneral, BP can be applied for inferen c e o n Attack Trees [Schneier 1999]. Furthermore, fo r graphs w ith a ge neral structure we can use the JT algorithm as an ex tension of BP , as we de scribe in Section 6. T o d escribe the BP algorithm, we intro duce the conce pt of factor graph s using a formulation similar to that given in [ Bishop 2006]. BNs and MRFs allow us to ex press the j o int probability distribution of a set of r andom variables as a prod uct of factors over subsets o f those variables . F actor graphs make this factor dec o mposition explicit by in tro ducing addi- tional node s fo r the factors themselve s , in ad d ition to tho se repre senting the variables, thus resulting in bipartite grap h s . Referring to the example shown in Fig. 2, if we r e move the attac k path from the LAN admin to the Mail server ( for e xample, by patching the v ulnerability), the resulting AG is a tree and we can u se BP f or infere nce. F o r this r e duced BAG, the jo int probability distribution can be factorised as: p ( A 1 , A 2 , B , C , D , E , F ) = 5 Y i =1 f i ( X i ) (7) where the corre sponding factors f i ( X i ) are: f 1 ( A 1 , B ) = p ( A 1 ) p ( B | A 1 ) f 2 ( A 2 , C ) = p ( A 2 ) p ( C | A 2 ) f 3 ( B , D ) = p ( D | B ) f 4 ( C, E ) = p ( E | C ) f 5 ( D , E , F ) = p ( F | D, E ) (8) Note that seve ral factor graph re presentations may exist for a give n BN (or MRF) [Bishop 2006]. Howe v er , the selection of a specific re presentation does not significantly impact the perf ormance of BP . In our example, the correspond ing factor graph accord- ing to (8) is shown in Fig. 4. BP wo rks by passing real valued functions c alled m essages amo n g the neig h bouring nodes in the graph. Since f acto r graph s are bipartite, there are two po ssible type s o f messages: From v ariable to factor , and from factor to variable. The message from a ArXiv preprint, V ol. 0, No. 0, Article 0, Publication date: June 2016. Efficient Attack G raph Ana lysis through Approximate Inference 0:13 variable X i to a factor f j in the neig hbourhoo d of X i is given by: µ X i ,f j ( X i ) = Y f k ∈{ F i − f j } µ f k ,X i ( X i ) (9) where µ f k ,X i ( X i ) are the m e ssages from the factor n o des in the n eighbourh ood of X i except f j . On the other hand, the message fro m a factor no de f i to a variable no de X j in the neighbour hood of f i is calculated as: µ f i ,X j ( X j ) = X X k ∈ X s f i ( X j , X s ) Y X k ∈ X s µ X k ,f j ( X k ) (10) where X s is the set o f variable nodes in the neighbou rhood of f i except X j . When a variable X i is a leaf no de, the correspo nding me ssages to the factors in its neighbourh ood are equal to o ne, i.e. µ X i ,f j ( X i ) = 1 . On the contrary , if a f actor f i is a leaf nod e, the message to a variable node in its neighbourh ood is give n by µ f i ,X j ( X j ) = P X k ∈ X s f i ( X j , X s ) . T o comp ute the unc onditional probabilities for all the nod es in the graph , BP needs to co mpute all the messages fro m all no de variables to their corr e sponding factor s and vice v ersa. BP proce eds starting from the leaf nod es (either variable or factor no des) and propag ates the messages across the graph such that a variable n ode X i cannot send a message to a factor f j until X i receives all messages fro m its ne ig hbouring factors except f j . The same ap p lies when sending messages fro m factors to variable nodes. F o r ex amp le, in the factor graph in ( 4) , we can n ot send a me ssage fro m factor f 5 to variable F until f 5 receives a message from variables D and E . Once all messages are compu ted, the unc o nditional probability for a node X i , whe n the graph is a BN 3 , can be calculated as: p ( X i ) = Y f j ∈ F i µ f j ,X i ( X i ) (11) where F i are the factor nodes in the neighbou rhood o f X i . Ther e fore, BP can efficie ntly calculate all the m arginal pro babilities by compu ting all the messages once and storing them. F or the dynamic analysis , when we o bserve ne w e vidence of compromise in som e nodes, we only n eed to recomp ute the factors that d epend o n the v ariables that have changed in order to o btain the posterior pro bability on all the nodes of the netwo rk given the evid ence o f compro mise. Furthe r details are e xplained in [ Kolle r and Fried- man 2009]. Finally , the de tails abo ut the co m putational complex ity of BP will be d is- cussed in Section 6 along with the corr esponding discussion f or the comp lexity o f JT , as BP can be considere d as a particular case o f JT . 5.2. Loo py Belief Pr opagati on LBP is a simple extension o f BP [ P earl 1988] applied to graph s (BNs o r MRFs) that contain loops. The differen c e is that, in the p resence o f loops, the results of LBP are approximate estimates of the uncond itional probabilities of the nodes in the graph. LBP uses the same f actor graph represe n tation as BP . In Fig. 5 we show the corre - sponding factor graph repre sentation for the BAG dep icte d in Fig. 2, wh ere we observe that there is one loop due to the attack p ath from the LAN admin n ode to the Mail server . The corre spo nding factors f i ( X i ) are the same as in (8) exc ept for f 3 , w hich in this case also depend s on variable C , so that f 3 ( B , C, D ) = p ( D | B , C ) . 3 F or MRFs we n eed to include a normalization factor . ArXiv preprint, V ol. 0, No. 0, Article 0, Publication date: June 2016. 0:14 L. Mu ˜ noz-Gonz ´ alez et al. Fig. 5 . F actor Graph representation for the BAG in Fig. 2. ALGORITHM 1: Initi alize messages for L BP Input : Set of n odes X , set of factors F . Output : Messa ges from nodes to f a ctors, µ X i ,f j , a nd from f actors to nodes, µ f i ,X j . for each n ode X i in X do for each factor f j in F i (the neigh b ourhood of X i ) do µ X i ,f j ( X i ) ← 1 ; end end for each fa ctor f i in F do for each node X j in X s (the neigh b ourhood of f i ) do µ f i ,X j ( X j ) ← P X k ∈ X s f i ( X j , X s ) ; end end There are two po ssible impleme ntations of LBP according to how m essages are co m - puted, namely Sequential LBP (S-LBP) and P aralle l LBP (P-LBP) [Murph y 2012] ( they sometimes are also referre d as asynchronous and synchron ous LBP respe c tively). F o r S-LBP we iteratively comp ute the m e ssages in (9) and (10) fo llowing some arbitrary schedule, u ntil the uncon ditional probability estimates obtained w ith (11) co n verge or until a max imu m number of iterations has be e n reached. Althoug h the re is n o restric- tion on the ord er in which we update the m essages ( 9) and (10), and the beliefs (11), depend ing o n the structure of the gr aph, there are some scheduling techniques that can be applied to favour conv ergence and reduce the time to achieve it [Ko ller and Friedman 2009]. In Algorithm 2 we have detailed the steps to compute and update the messages in S-LBP . In contrast, P-LBP u pdates all the messages for all factors and variable nodes at the same time, u sing the v alues of the messages at the previou s iteration. Thus, at iteration t , we first u pdate the m essages from n odes to f actors. The update equation for the message f rom a node X i to a factor f j can be written as: µ ( t ) X i ,f j ( X i ) = Y f k ∈{ F i − f j } µ ( t − 1) f k ,X i ( X i ) (12) In a secon d step we upd ate the messages from factors to variable node s w here the equation the message f r om factor f i to no de X j is g iven by: µ ( t ) f i ,X j ( X j ) = X X k ∈ X s f i ( X j , X s ) Y X k ∈ X s µ ( t ) X k ,f j ( X k ) (13) Finally , we comp ute the new estimates o f the m arginal probabilities w ith (11) with the updated m essages o btained using (13). As in the previous case, the algo rithm is ArXiv preprint, V ol. 0, No. 0, Article 0, Publication date: June 2016. Efficient Attack G raph Ana lysis through Approximate Inference 0:15 ALGORITHM 2: Sequenti al LBP Input : Set of nodes X , set of factors F , convergence tolerance ǫ , maximum number of iterations max iter . Output : Unconditiona l probabil ities p ( X i ) for all th e nodes in X . i ter = 0 ; Initiali ze messages according to Algorithm 1; repeat i ter ← i t er + 1 ; for each node X i in X do p ( X i ) o ld ← p ( X i ) ; end for each node X i in X do for each fa ctor f j in F i (the neigh b ourhood of X i ) do µ X i ,f j ( X i ) = Q f k ∈{ F i − f j } µ f k ,X i ( X i ) ; end end for each factor f i in F do for each n ode X j in X s (the neighbourhood of f i ) do µ f i ,X j ( X j ) = P X k ∈ X s f i ( X j , X s ) Q X k ∈ X s µ X k ,f j ( X k ) ; end end for each node X i in X do p ( X i ) = Q f j ∈ F i µ f j ,X i ( X i ) ; end until P N i =1 | p ( X i ) − p ( X i ) old | < ǫ OR ( i ter ≥ m ax iter ) ; repeated until the unco nditional probabilities con v erge or a maximum nu m ber of iter - ations is reached. The details of P-LBP are show n in Algorithm 3. F or the first iteration in both S-LBP and P-LBP w e initialize the messages f r om nodes to factors to 1 . The messages fro m a f actor f i to a node X j are initialized as µ f i ,X j ( X j ) = P X k ∈ X s f i ( X j , X s ) . This proce dure is de scribed in Algorithm 1. According to [K oller and Friedman 2009], S-LBP u sually w orks better than P-LBP , although they re quire schedu ling me ssages in a guide d way . How ever , the expe rimen- tal results on synthetic BAGs, pre sented in Section 7, show a similar behaviour f or both impleme n tations in terms of acc u racy . In Fig . 6 w e show the corre sponding estimates f o r the u n conditional probabilities in the BAG dep icted in Fig . 2.(a) w hen there is no e vidence of attack. It can be o bserved that there is n o diff erence (at least in the 3 first decim als) betwe en the true and the estimated probabilities for no des A - E and that, f or node F , the marg inal p robability estimated with LBP 4 is 0 . 805 wh ile the tru e pro bability is 0 . 7 99 . When e vidence of at- tack is observed at the Mail serv er ( n ode D ), show n in Fig. 2.(b), the LBP un conditional probability estimates match the ex act probabilities. The reason for this ex act result is that, giv e n the evid e nce of attack, D can be considered as a de te rministic no de. This splits the graph into two tree structure s w ith the remaining unobser v ed nod es: { A 1 , B } and { A 2 , C , E , F } and the message passing scheme produ c es ex act results fo r the two trees. One of the drawbacks of LBP is that, in gener al, co nverge nce is not gu aran te ed. [W eiss 2000] show that LBP converg es for graphs with a single loop and deriv es an analytical relationship between LBP pr o bability estimates and the true unco nditional 4 In thi s case both S-LBP and P-LBP provide the sa me result. ArXiv preprint, V ol. 0, No. 0, Article 0, Publication date: June 2016. 0:16 L. Mu ˜ noz-Gonz ´ alez et al. ALGORITHM 3: Parallel LBP Input : Set of nodes X , s et of fa ctors F , convergence tolerance ǫ , maximum number of iterations max iter . Output : Unconditiona l probabil ities p ( X i ) for all the nodes in X . i ter = 0 ; Initiali ze messa ges according to Al gorithm 1; repeat i ter ← i ter + 1 ; for each node X i in X do p ( X i ) o ld ← p ( X i ) ; for each fa ctor f j in F i (the neighbourhood of X i ) do µ o ld X i ,f j ( X i ) ← µ X i ,f j ( X i ) ; end end for each factor f i in F do for each n ode X j in X s (the neigh b ourhood of f i ) do µ o ld f i ,X j ( X j ) ← µ f i ,X j ( X j ) ; end end for each node X i in X do for each fa ctor f j in F i do µ X i ,f j ( X i ) = Q f k ∈{ F i − f j } µ o ld f k ,X i ( X i ) ; end end for each factor f i in F do for each n ode X j in X s do µ f i ,X j ( X j ) = P X k ∈ X s f i ( X j , X s ) Q X k ∈ X s µ o ld X k ,f j ( X k ) ; end end for each node X i in X do p ( X i ) = Q f j ∈ F i µ f j ,X i ( X i ) ; end until P N i =1 | p ( X i ) − p ( X i ) old | < ǫ OR ( i te r ≥ m ax iter ) ; Fig. 6 . Estimation of the unconditional probabilities provided by LBP for t h e BAG in Fig. 2.(a) probabilities . F o r more general graphs, [Mooij and Kappen 2005; Ihler et al. 2005] present suf fi cient co n ditions on the con vergen ce of LBP based on the co n cept of α - contractions. Howev e r , applying the corre spo nding analysis is, in general, a difficult task [ Kolle r and Friedman 2009]. It is also important to n ote that c onverg ence d oes no t mean corre ctness , i.e. LBP conv ergence does no t imply that the unco nditional proba- ArXiv preprint, V ol. 0, No. 0, Article 0, Publication date: June 2016. Efficient Attack G raph Ana lysis through Approximate Inference 0:17 bility estimates are accurate. How ever , the emp irical study proposed in [Murph y et al. 1999] show s that usually , when LBP converge s , the appro ximate marginal probabili- ties are close to the e xact value s . One simple way to favour c o nverg e nce is to use damping . Hence, the u pdate of the messages from a variable node X i to a facto r f j have the fo rm: ˆ µ ( t ) X i ,f j ( X i ) = αµ ( t ) X i ,f j ( X i ) + (1 − α ) µ ( t − 1) f k ,X i ( X i ) (14) so that the dampe d message ˆ µ ( t ) X i ,f j ( X i ) is a con vex c o mbination of the message upd ate at iteration t and the message at iteration t − 1 , wher e the d amping factor α is a positive value smaller than 1 . The damped update fo r the messages from facto r s to variable node s is analogous. This technique can be ap plied fo r bo th S-LBP and P-LBP . In the e xperimen ts , in Se ction 7, we analyse the ef fect of damp ing for the conv ergence and accuracy of LBP . It is also possible to make LBP co nverg e to a local minimum using double loo p algo- rithms [Y uille 2001; W e lling and T eh 2001]. U nfortunately , these techniques are slow and complicated and their accur acy is ofte n wo rse than the standard LBP [Murphy 2012], since they are prone to con verge to poor local minima. Similarly , o ther tech- niques, such as the mean field approximation, have been p roved to conv erge but are usually less accurate than LBP , since the non-conv exity of the mean field o bjective function leads to po or solutions [W eiss 2001]. 6. JU NCTION TREE The existing literature on BAGs has f ocused on the use of exact infe rence te chnique s for the static and d y namic analysis of AG s . [Liu and Man 2005] p ropose to use V ariable Elimination as a me chanism to co mpute the u nconditional pro babilities in the graph. [P oolsappasit et al. 2012] pr o pose to u se forward-backward pro pagation, howeve r this technique can only be applied whe n the graph is a chain [Rabiner an d Juang 1986; Murphy 2012], which is no t the case fo r most AGs. Finally , [Mu ˜ noz-Gon z ´ alez et al. 2015] prop o se to use the JT algorithm to efficie ntly co mpute the uncon ditional p r oba- bilities enabling the static and dynamic analysis of AG s w ith h undreds of nodes. The experime ntal ev aluation in [Mu ˜ noz-Gon z ´ alez e t al. 2015] shows the advantage s of the JT comp ared to the V ariable Elimination algo rithm proposed in [Liu and Man 2005] in terms of computational complex ity and memo ry require d. Thus, in this section we de- scribe the JT algorithm, as the state-of- the -art technique to p e rform e xact infe rence for the static and dy namic analysis of BAGs an d serv e s as benchmark fo r the comp arison with LBP . The JT or clique tree algorithm is an ex tension of B P , for e xact infer ence, that can be applied on BNs or MRFs with a gen e ral structure. In this case, BP’ s me ssage scheme is applied to a tree structure wh e re the nodes repre sent clusters of the rando m v ariables in the graph. Ther e are two main variants for the JT: The Shenoy-Shafe r algor ithm [Shenoy and Shaf er 1990; Shafe r and Shenoy 1990] and the Hugin algorithm [Lau- ritzen and Spieg elhalter 1988]. Although both techniques rely on the same principle s, they diffe r in the way the m essages are computed. In the following, we will describe the Sheno y -Shafer m ethod w hich uses the same message p assing scheme as BP . The first step of JT is to create a cluster graph with a tree structure f rom the initial BN (or MRF). This cluster graph (or clique tree ) can be co nsidered an ex tension of factor gr ap hs w ith clusters of several random variables between two factors . In this case, one random variable can appear in more than one cluster node. Howe ver , the cluster graph nee ds to satisfy the runni ng intersection p roperty : if a random variable X i appears in two cluster nodes, X i ∈ C j and X i ∈ C k , the n X i also appears in each cluster node in the unique p ath ex isting between C j and C k in the clique tre e. ArXiv preprint, V ol. 0, No. 0, Article 0, Publication date: June 2016. 0:18 L. Mu ˜ noz-Gonz ´ alez et al. Fig. 7 . F actor Graph representation for clique tree obtained from th e BAG in Fig. 2. In the case of BNs, to create a clique tree we fir st nee d to mo ralize the graph, i.e. make the g raph u n directed and add a link betwee n the node s that have a common child (this step is not ne eded for MRFs). The moral graph is then triang ulated to o btained a chordal g raph, i.e. one in which eve ry m inimal lo op in the graph is of length thre e. Finally , each maximal clique in the chordal graph is a cluster node in the clique tree. As shown in [K oller and Friedman 2009], we can create the cluster g r aph with the VE algorithm [De chter 1996]. F or the BAG example in Fig. 2, we show in Fig . 7 a factor graph rep resentation of the corre sponding clique tree obtained using VE. F or this factor gr ap h re presentation, the assignment of the diffe rent terms in (6) to the factors in Fig. 7 is: f 1 ( A 1 , B ) = p ( A 1 ) p ( B | A 1 ) f 2 ( A 2 , C ) = p ( A 2 ) p ( C | A 2 ) f 3 ( B , C, D ) = p ( D | B ) f 4 ( C, D , E ) = p ( E | C ) f 5 ( D , E , F ) = p ( F | D, E ) (15) With the factor g r ap h rep resentation of the clique tre e w e can calculate the uncon- ditional p robabilities u sing the same message passing scheme as in BP . The differe nce is that, in this case, the scopes of the me ssages give n in equations (9) and ( 10) de pend on multiple random variables rather than j ust one, as in the case of BP . Once all the messages are co mputed, the unco nditional joint pr obability for the vari- ables in a cluster node X s (provide d that the graph is a BN) is calculated as: p ( X s ) = Y f j ∈ F s µ f j , X s ( X s ) (16) where F s are the factor node s in the neig hbourhoo d o f the cluster no de X s . T o calculate the marg in al probability for one rando m variable X i in the cluster X s , w e just sum over the rest of the variables in X s : p ( X i ) = X X j ∈{ X s − X i } p ( X s ) (17) Evidence of compr o mise can be easily included wh en using JT , in the same way as in BP . Further details can be found in [Ko ller and Friedman 2009]. The computational complexity of JT is expo nential in the scop e of the biggest factor in the clique tree. Concretely , if all the variables in the graph are discrete and have K possible value s each ( in our case, K = 2 ), JT scales in time and space as O ( | F | K s ) , where | F | is the number of factors and s is the size of the sco pe of the largest factor in the clique tre e (3 in the examp le in Fig . 7). Moreov er , the computational complex ity of applying VE algorithm to build the clique tree is also exp onential. This can limit the application of JT for large graph s, althoug h it d epends on the structure of the graph, as we w ill show in the ex p eriments. The scalability for BP and LBP is similar to that of JT , i.e. they scale in time and space as O ( | F | K s ) . How ever , since BP and LBP do no t cluster variables , the factors are usually smaller , so we ex pect to have smaller s . ArXiv preprint, V ol. 0, No. 0, Article 0, Publication date: June 2016. Efficient Attack G raph Ana lysis through Approximate Inference 0:19 7. EXP ERIMENTS In this section we present an exp erimental evaluation comparing the accuracy and perform an ce of seque ntial and parallel implem e ntations o f LBP with that of the JT algorithm used in [Mu ˜ noz-Gon z ´ alez et al. 2015]. I n de tail, we first analyse the accuracy of LBP whe n computing the unco nditional and posterior probabilities for the static and dy namic analysis of AGs , and the n comp are the time re quired to estimate the se probabilities with that required by JT . This allows us to de termine if LBP is a suitable alternative fo r tractable analysis of large AGs, and if the risk estimates are sufficie ntly accurate to help admin istrators pro pose risk mitigation strategies. F or JT we have used VE to build the clique tree, selecting the elimination order- ing according to the min-wei ght he uristic [K oller and Friedman 2009]. As sho wn in [Mu ˜ noz-Gon z ´ alez et al. 2015], the e limination order in g has an impact on the perfor- mance of the algorithm, redu cing the memory requ ire d and the time to c o mpute the unconditional probabilities . F or S-LBP and P-LBP we have used a tole rance threshold of 10 − 3 for the c onverg ence of the algo rithm, i.e. we assume that the algorithm has converg ed if the biggest change in the unco nditional probabilities is less than 10 − 3 . W e have used the Bayes N et toolbox for Matlab 5 for all the algo rithms. T o provide a co mprehe nsive ev aluation w ith diff erent graph sizes, d ifferen t possible network topolog ies, and inter depend encies, we h ave generated synthetic AGs in the experime nts . Note that, currently , there are no co llections of AGs of similar varie ty obtained empirically from r e al systems; in fact, no collections of e mpirically obtained AGs exist in the public domain at all. Furthermo re, from the e xamples reporte d in the literature it is hard to determine the typ ical graph structures of AGs, e.g. fo r large corporate netwo rks . W e expec t the se graph structures to vary significantly since they depend o n the netwo rk topolo g y and the distribution and type of vulne rabilities across the ne twork co mponen ts . F or these re asons, we have u sed the structures prop osed in [Mu ˜ noz-Gon z ´ alez et al. 2015] to gen erate the synthetic AGs: pseudo-ra ndom graphs , where we c o ntrol the in-d egree of the nodes, wh ich is related to the n umber of vulnera- bilities that a node in the ne twork can have; and cluster graphs , which model scenarios with differ ent subnetwo r ks that are we akly conne cted. Then, for each subnetwork, w e generate the AG w ith a pseudo-r andom structure. The value s for the probabilities of succe ssful ex ploitation of vulner abilities are drawn at random from the distribution of CVSS sco r es extracted from [cvs 2015]. W e normalize the scores dividin g them by 10 . In Fig. 8 we show the d istribution o f CVSS scores. The value of these probabilities can have an impact in the accuracy of the un - conditional probability estimates, and in the con vergen ce of the algorithms. Although we think that the explo itability subme tric o f CVSS scores is a better ind icator of the difficulty of exploiting a v ulnerability , it is d ifficult to g et the d istribution of this sub- score, and so we have used the distribution of the whole CVSS score instead. Finally , since we do not have data to estimate the error p robability o f the ale r t systems , and their accuracy changes in time and with the topo logy of the netwo rk, we have con sid- ered in our e xperimen ts that the alert system do e s no t trigg er false alarms. Although we recognise that the false alarm rate is usually very high, we conside r that these will be pro cessed and diagno sed before being considered as ev idence of co mpromise. In this sense, we can co nsider d ifferent app roaches to r e duce and simplify the analysis of IDS alerts: On one side, w e can use fi lte r in g techniques to redu ce the nu mber of alerts to be inspected by discarding tho se likely to be false positives [ Cotroneo et al. 2015; Spathoulas and K atsikas 2010]. On the othe r hand, we can use co rrelation sys- tems to identify and cluster alerts p ertaining to the same even t [ Raftopoulos and Dim- 5 https://github.com/ba yesnet/bnt ArXiv preprint, V ol. 0, No. 0, Article 0, Publication date: June 2016. 0:20 L. Mu ˜ noz-Gonz ´ alez et al. 0 5 10 15 20 25 30 1 2 3 4 5 6 7 8 9 10 % CVSS score Fig. 8 . Distribution of the CVSS scores [cvs 2015]. T able I. A ver age RMSE pl us/minus one standard deviation for PLBP on pseudo-random BA Gs with m = 3 a nd 40 nodes varying the damping fac tor α an d the probab ility of having AND-type conditional probability tables, p(AND). p(AND) α = 0 . 0 α = 0 . 1 α = 0 . 3 α = 0 . 5 0 . 0 0 . 0315 ± 0 . 0223 0 . 0272 ± 0 . 0187 0 . 0291 ± 0 . 0194 0 . 0266 ± 0 . 0175 0 . 2 0 . 0218 ± 0 . 0141 0 . 0222 ± 0 . 0143 0 . 0266 ± 0 . 0206 0 . 0276 ± 0 . 0183 0 . 5 0 . 0182 ± 0 . 0103 0 . 0150 ± 0 . 0067 0 . 0165 ± 0 . 0123 0 . 0175 ± 0 . 0083 0 . 8 0 . 0081 ± 0 . 0069 0 . 0108 ± 0 . 0097 0 . 0131 ± 0 . 0100 0 . 0112 ± 0 . 0064 1 . 0 0 . 0081 ± 0 . 0058 0 . 0069 ± 0 . 0047 0 . 0107 ± 0 . 0096 0 . 0089 ± 0 . 0085 itropoulos 2011; Pecchia et al. 2011]. W e can also redu ce the number of false positives with SIEM by combinin g multiple source s of info rmation (e.g., IDS) to flag potential breaches and by en suring that the event has bee n discovered by o ther monitoring co m- ponents in the ne tworks [ V aleur e t al. 2004]. F or the e x perimental evaluation we start analysing the accuracy , con vergen ce, and scalability of S-LBP and P-LBP for the p seudo-rand om AGs. Then, fo llowing a similar treatment we presen t the exp erimental results on cluster AG s . 7.1. BA Gs with ps eudo-ra ndom struc ture T o bu ild this kind o f BAGs we generate rando m DAGs wh ere we limit the m aximum number o f parents that a node can have. This corre sponds to restricting the maximum number of vulne rabilities that can lead an attacker to re ach a certain security cond i- tion. Since in real scen arios w e expec t to have a re duced n umber of vulne rabilities that allows an attack e r to compromise a ne twork node [WhiteHat Secu rity 2015; Symantec 2015], we consider that this structure is reasonable. Thus, for e ach node in the graph X i , we randomly select its nu m ber of pare nts by drawing a r andom intege r n p in the interval [1 , m ] uniformly , wh ere m is the max imum nu m ber of possible paren ts allowe d. Then, w e rando mly select the n p parent nod es fo r X i from the set of no d es in the BAG for w hich X i is not a paren t node already . This avoids direc ted cycles an d pr e serves the DAG structure. In Fig. 9 we show an e xample of a random BAG with 20 node s and m = 4 . 7.1.1. A ccuracy a nd Conv er gence. In ou r first exp eriment we want to me asure the acc u - racy and the conv e rgence o f bo th S-LBP and P-LBP fo r pseudo- random AGs. W e have therefore gene rated synthe tic AG s with 4 0 nodes and m = 3 , w here we have varie d the pro portion of OR and AND conditional pro bability tables . W e have also explor e d differen t v alues for the damping factor α in the rang e [0 , 0 . 5 ] . W e have measured the accuracy using the Ro oted Mean Squared Erro r (RMSE), comparing LBP estimates with the exact unco nditional probabilities pro vided by JT . F o r e ach c ombination of pa- ArXiv preprint, V ol. 0, No. 0, Article 0, Publication date: June 2016. Efficient Attack G raph Ana lysis through Approximate Inference 0:21 Node 1 Node 2 Node 3 Node 4 Node 5 Node 6 Node 7 Node 8 Node 9 Node 10 Node 11 Node 12 Node 13 Node 14 Node 15 Node 16 Node 17 Node 18 Node 19 Node 20 Fig. 9 . Example of random BAG with 20 nodes and m = 4 . rameters e xplored we have average d the RMSE obtained for 20 inde pende n t BAGs. From the results in T ab. I we observe that the RMSE is le ss than 0 . 03 in most cases, which is a reasonable accu racy to estimate the risks o f compro mising the diff erent nodes in the AG , especially when considering that the probabilities of succe ssful e x - ploitation of vu lnerabilities are not accurate, since the y are estimated with the CVSS scores. Thus, the acc u racy o f LBP is eno ugh to allow system administrators to decide the actions that n eed to be taken (both f o r the static and the dynamic analysis of the network). I t is also intere sting to o bserve that a little bit of dampin g, i.e. small values of α , slightly improv e the accuracy . Further m ore, it is rem arkable that the RMSE is lower whe n the p roportion of AN D-type co nditional p r o bability tables is higher . This effect is due to the different co upling effect between the variables in the loops of the BAG depen d ing on the type o f conditional p robability table. In T ab. I we only show the RMSE for P-LBP , since the differe nces w .r .t. S-LBP were ne gligible. More over , we h ave also observ e d that bo th implemen tations of LBP conve rged in all cases. 7.1.2. Accuracy with the Number of Iterations. In our second e xperime n t w e have analysed how the accuracy o f the LBP probability e stimates changes with the number of ite r a- tions . LBP allows us to monitor the intermediate estimates of the unconditional p rob- abilities , which is no t po ssible with JT . This can help system administrators to redu ce the time to re spond to an attack, since they d o not need to wait until the algorithm has completely con verged . In Fig . 10 we show the average RMSE o f P-LBP and S-LBP as a function of the number of iterations for 25 pseu do-rando m BAGs w ith 100 node s and m = 3 . The probability of having AND -type conditional pr obability tables has been set to 0 . 5 , and we have used a d amping factor o f α = 0 . 2 in both LBP imple mentations. From the results in Fig. 10 w e can o bserve that the algorithms conve rge o n average in less than 15 iterations, although P-LBP seems to co nverge faster , and gets better estimates o f the unconditional probabilities after the fi rst iteration (altho ugh the final result is similar to S-LBP). From Fig. 10 it is important to note that, af te r 5 iterations, the RMSE for ArXiv preprint, V ol. 0, No. 0, Article 0, Publication date: June 2016. 0:22 L. Mu ˜ noz-Gonz ´ alez et al. 0 5 10 15 20 25 0 0.05 0.1 0.15 0.2 0.25 0.3 0.35 0.4 P-LBP S-LBP Iterations RMSE Fig. 10 . Average RMSE of P-LBP and S-LBP with the number of iterations for 25 pseudo-random BAGs with 100 nodes and m = 3 . P-LBP is abou t 0 . 0 5 . This accuracy can be c o nsidered reasonable to start plann ing risk mitigation strategies at run-time without waiting for LBP to conve rge. 7.1.3. T ime Scalab ility. Ou r last experimen t w ith p seudo-rand o m BAGs is aimed at evaluating the time scalability of LBP and JT for the static and d ynamic analysis of AGs. W e h ave analysed networks with diff erent sizes and differen t de nsities: F or m we have explore d the values 3 and 4 , while for n , the nu mber of node s in the BAG, we have used values in the range [20 , 300 0] . Howev er , for JT w e have limited the value of n to 12 0 fo r m = 3 and to 80 for m = 4 because of physical memory limitations 6 . The probability of having AND-type co nditional probability tables is set to 0 . 5 . F or each value o f n and m we h ave gene rated 20 pseudo -random BAGs and, for each BAG, we compute the uncon d itional pr o babilities fo r all the nod es with both LBP and JT . In Fig. 11 w e show the average time re quired to comp ute the unconditional pr oba- bilities for all the nodes in the BAG for P-LBP , S-LBP , and JT . In the case of JT , the measured time includes the time r equired to build the clique tree, and compute all the m e ssages and all the unconditional p robabilities . F or LBP , this time conside rs the computation of all the messages and the pro bability estimates . Therefore, we are, in essence, m e asuring the time re quired to p erform the static analysis of the BAG . F or both LBP variants we use α = 0 . 2 and set the maximum number of iterations to two times the number of no des in the netwo rk. As in the prev ious expe r iment, both LBP implementations co n verge d in all cases. From the results shown in Fig . 11 we can observ e the expo nential increase of JT with the number of no des, where as both P-LBP and S-LBP scale line arly . Although the time to compute the unco nditional probabilities by JT is lower for small AG s ( less than 100 nodes), it appe ars that LBP is a suitable altern ative to make infere nce in larg e BAGs, where the ex ponential scalability of JT makes its use impractical. It is also in te resting to no te that P-LBP is faster than S-LBP . Moreover , when increasing the co mplexity o f the netwo rk (by incre asing m ) the perform an ce of P-LBP remains similar , whe reas w e can o bserve larger differe nces fo r S-LBP . F or the dynamic analy sis of AGs, when we o bserve evidence of co mpromise in some nodes, we need to re compute all the m e ssages taking into accoun t the eviden ce as well as the po sterior pr o babilities in all the graph nodes. This app lies e qually well to JT and LBP . Howev e r , f o r JT , we do not need to bu ild the clique tre e again. So, to analyse the pe rformance of the algo r ithms for the dynamic analysis of AG s , we have randomly selected 3 nod e s in e ach grap h where we consider that evid e nce of attack has 6 The ex periments have been conducted in a 16 GB computer with an Intel Core i7 processor at 3.40 GHz. ArXiv preprint, V ol. 0, No. 0, Article 0, Publication date: June 2016. Efficient Attack G raph Ana lysis through Approximate Inference 0:23 0 50 100 150 200 250 300 350 400 450 500 0 5 10 15 20 25 P-LBP-3 P-LBP-4 S-LBP-3 S-LBP-4 JT -3 JT -4 Number of nodes Time (s) Fig. 11 . Average time to compute th e unconditiona l probabilities for P-LBP , S-LBP , an d JT for pseu do- random a t tack graphs. The notation P-LBP- m , S-LBP- m , and JT - m s tands for th e valu e of m , the maximum number of parents allow ed for each node, us ed to g enerate th e graphs in each case. been observed. Then, we have measured the time require d to recompu te the posterior probabilities fo r P-LBP , S-LBP , and JT . W e have o mitted the r e sulting fi g ure, since the results are very similar to those obtained fo r the static analysis (shown in Fig. 11). The measured times for the dyn amic analysis are slightly low er f o r all the me tho ds and the differen ces are n o t very significant. In the case of the JT , this means that for this kind of g raphs the bottleneck of the algorithm is the computation of the me ssages rather than the time re quired to build the clique tree [Mu ˜ noz-Gon z ´ alez et al. 2015]. This is due to the strong interconne ction o f the nodes in the graph, which makes some clusters in the clique tre e to have a high number o f variables. F or LBP imple m entations, the similarity of the re sults sug g ests that the n u mber of iterations n e eded to conv erge are similar . F or the sake o f clarity , we have omitted in Fig . 11 the re sults obtained with LBP for networks f rom 500 to 30 00 nodes. Howe ver , we h ave observ ed that the linear scalability of LBP hold s. Thus, fo r BAGs with 3000 no des the average time to perf orm the static (or dynamic) analysis or the graph is about 60 seconds on a standard laptop. The line ar scalability o f LBP for this kind o f graphs make it usef ul for both static and dy namic analysis of AGs, especially when the graphs are large. It is thus possible to analyse AGs with thousands of no des, which can co rrespond to netwo rks w ith te ns or hu n dreds of thousands of n odes (d e pending on the nu m ber of vulnerabilities). 7.2. BA Gs with clus ter st ructure F or the exper ime ntal e valuation w e have also studied the eff ect of clustering o n the analysis by using syn the tic graphs with a cluster structure. Typical corpo rate net- works are structured into subnetworks [T an et al. 2003] and contain several hosts with co mmon software installations so we can exp ect some form o f cluster structure in the correspo nding AG . T o gene rate this kind o f graphs we have co nsidered ne tworks with clusters o f the same size n c . Then, for each cluster , following the same proce - dure as before, we have gener ated pseudo- random subgraph s , limiting the maximum number of parents f or each no de to m . Finally , to include the depend encies betwee n clusters , we have add ed o ne edge f rom one node in e ach cluster to one node in each of the other clusters , p rovided that the DAG structure required for BNs is pre served. F or our e xperime nts w e have ge nerated synthetic clustered graphs with n c = 20 and 50 , vary in g the total number o f netwo rk node s from 100 to 1 000 . In Fig. 12 we show an ArXiv preprint, V ol. 0, No. 0, Article 0, Publication date: June 2016. 0:24 L. Mu ˜ noz-Gonz ´ alez et al. Node 1 Node 2 Node 3 Node 4 Node 5 Node 6 Node 7 Node 8 Node 9 Node 10 Node 11 Node 12 Node 13 Node 14 Node 15 Node 16 Node 17 Node 18 Node 19 Node 20 Node 21 Node 22 Node 23 Node 24 Node 25 Node 26 Node 27 Node 28 Node 29 Node 30 Fig. 12 . Example of clustered BAG with 3 subn etworks and 1 0 nodes per su bnetwork. example o f a clustered BAG w ith 3 subnetworks, with 10 nodes per subnetwo rk, and m = 3 . F or this kind of BAGs we have performe d the same experim e nts as for pseu do- random BAGs. Thus , we first assess the accuracy and co nverge nce of the two LBP implementation; second, w e show how the accuracy ev olves with the number of itera- tions and, finally , we sho w the time scalability for the static an d dynamic analysis of the graphs. 7.2.1. A ccuracy and C onv erg ence. F o r this ex periment we have gen e rated syn thetic cluster AGs with 5 clusters w ith n c = 20 n odes per cluster and m = 3 . As for the p se u do- random BAGs , we have varied the propo rtion of OR and AND co n ditional pro bability tables and w e have explo r ed values for the d amp ing f actor α in the ran g e [0 , 0 . 5] . F or each combination of p aram e ters explo red we have averaged the RMSE obtained fo r 20 independ ent BAGs . The re sults are shown in T ab. II, where we obser v e that the aver- age RMSE is le ss than 0 . 04 in all cases , which means that the probability e stimates provided by LBP are reasonable to perf orm risk assessment with BAGs. W e can also appreciate that the proportion of AN D/OR con d itional probability tables has some im- pact on the accuracy of the probability estimates. Thus, having a bigger pro portion of AND-type conditional probability tables results in m o re accurate estimations for the unconditional probabilities in the BAG . In this case, in co ntrast to the results shown in T ab. I, damp ing d oes not pro vide any clear improve ment in the accuracy . Howe ver , ev en in these cases, it is a goo d practice to include a little bit of damping in LBP updates to avoid potential instabilities in the algorithm. As in the case o f the pseud o -random BAGs , w e o nly show the RMSE for P-LBP , since the re sults obtained from S-LBP are very similar . Finally , we have also observe d that both, P-LBP and S-LBP , con verged in all cases. 7.2.2. A ccuracy with the Numb er of It erations. In Fig . 13 we show how the average RMSE of P-LBP and S-LBP d ecreases w ith the numbe r of ite r ation s . F o r these expe riments we have gene rated 25 cluster BAGs with 5 clusters and n c = 20 node s per cluster , with m = 3 . As in the case of the pseudo-ran d om BAGs, we have set the probability ArXiv preprint, V ol. 0, No. 0, Article 0, Publication date: June 2016. Efficient Attack G raph Ana lysis through Approximate Inference 0:25 T able II. Av erage RMSE plus/minus one s tandard de viation f or PLBP on clustered BA G s with m = 3 , 5 subnetworks and n c = 20 n odes per subnetwork, varying the d amping fact or α and the probability of having AND-ty pe conditional probabil ity tab les, p(AND). p(AND) α = 0 . 0 α = 0 . 1 α = 0 . 3 α = 0 . 5 0 . 0 0 . 0342 ± 0 . 0213 0 . 0376 ± 0 . 0213 0 . 0341 ± 0 . 0157 0 . 0337 ± 0 . 0186 0 . 2 0 . 0216 ± 0 . 0078 0 . 0247 ± 0 . 0105 0 . 0289 ± 0 . 0154 0 . 0229 ± 0 . 0123 0 . 5 0 . 0185 ± 0 . 0062 0 . 0219 ± 0 . 0128 0 . 0193 ± 0 . 0083 0 . 0224 ± 0 . 0091 0 . 8 0 . 0149 ± 0 . 0042 0 . 0136 ± 0 . 0035 0 . 0138 ± 0 . 0078 0 . 0127 ± 0 . 0053 1 . 0 0 . 0109 ± 0 . 0042 0 . 0115 ± 0 . 0039 0 . 0093 ± 0 . 0043 0 . 0107 ± 0 . 0038 0 2 4 6 8 10 12 14 16 18 20 0 0.05 0.1 0.15 0.2 0.25 0.3 0.35 0.4 P-LBP S-LBP Iterations RMSE Fig. 13 . Aver age RMSE of P-LBP and S-LBP with the number of iterations for 25 cluster BAGs w ith 100 nodes (5 subnetworks wit h 20 nodes per subn etw ork) and m = 3 . of having AND-type con ditional p r o bability tables to 0 . 5 and we h ave used a damping factor of α = 0 . 2 . The results in Fig . 13 are v ery similar to those shown in Fig. 10 fo r the c ase of the pseudo-ran d om BAGs . Thus, w e can observe that after 4 iterations , P-LBP produce estimates fo r the unco nditional probabilities with an average RMSE less than 0 . 0 5 . W e also app reciate that, as in the pre vious case, P-LBP con verges faster than S-LBP , although bo th techniques achieve a similar approximation error after converg ence. The result of this exp eriment sho ws that, after a few iteration s , the accuracy pr ovided by LBP can be considere d reasonable to start planning risk mitigation strategie s at run-time before LBP con verges. 7.2.3. Time Scalabil ity. W e repo rt in Fig. 14.(a) the time re qu ired to per form the static analysis for P-LBP , S-LBP , and JT . As in the case of the pseudo- random networks we observe that JT scales e xpone n tially with the number o f nodes, althoug h it is able to perform static analysis on larger netwo rks (comp ared to the pseudo -random AGs). In contrast, both LBP impleme ntations scale linearly with the number of nodes in the BAG , and require less time than JT to comp ute all the u nconditional pr o babilities for graphs with more than 500 nod es. Also in line with the previous ex periment, P-LBP shows a better perf ormance than S-LBP , although the diffe rence is not as significant as before. W e can also appr e ciate that, for both LBP me thods, the increme nt on the size of the clusters implies only a small differe n ce in the time perform an c e of the algorithms. In Fig. 14.(b) w e show the time require d to pe rform the dyn amic analysis whe n we observe evide nce o f attack in 3 nodes chosen at ran d om. W e can observe again that the scalability for both LBP implementations is linear in the numbe r of nodes, and that the time required to com pute all the unco nditional probabilities in the BAG is slightly lowe r than in the case of the static analysis in Fig . 14.(a). Ho wever , in this case the pe rformance o f JT is also linear in the number of nodes and the time required ArXiv preprint, V ol. 0, No. 0, Article 0, Publication date: June 2016. 0:26 L. Mu ˜ noz-Gonz ´ alez et al. 100 200 300 400 500 600 700 800 900 1000 0 50 100 150 P-LBP-20 P-LBP-50 S-LBP-20 S-LBP-50 JT -20 JT -50 Number of nodes Time (s) (a) 100 200 300 400 500 600 700 800 900 1000 0 5 10 15 20 25 30 35 P-LBP-20 P-LBP-50 S-LBP-20 S-LBP-50 JT -20 JT -50 Number of nodes Time (s) (b) Fig. 14 . Time to compute the unconditional probabilities for P-LBP , S-LBP , an d the JT algorithm for clus t er networks with different cluster sizes ( n c = 20 and 50 ) and m = 3 for: (a) the static an alysis and (b) th e dynamic analy sis (when we observe evidence of att a ck at 3 random nodes). to compute the uncond itional pro babilities is much low er than in the case o f two LBP methods. These re sults indicate that, w h en JT is app lie d on clustered netwo rks , the bottlene ck is the gene ration o f the clique tree, while the comp utation of the messages is simple. This sugge sts that the cluster structure of the BAGs p roduces clique tre es with a re- duced number of v ariables in each cluster of the tree. Hen c e, the messages sent acr o ss nodes involve a reduce d number of random variables, allow ing a fast calculation of the posterior pro babilities f or the dynamic analysis of the BAGs . In the case of LBP , the messages are simpler than in the case o f JT . However , the time to compute the unconditional probabilities in the dynamic analy sis is high er since, at each iteration, we n e ed to compute all the me ssages and several ite r ation s are nee ded to make the algorithm co nverge. Altho ugh JT is faster than LBP for the dynamic analysis of clus- tered BAGs , the expo nential scalability f o r the static analysis , w hen the clique tree is generated , limits the tractability of the analysis for large netwo r ks . On the othe r hand, as mention ed before, LBP allow s us to monitor the values o f the po sterio r probabilities at e ach iteration, so that we can obtain accurate estimates for the p robabilities be f ore the algorithm conv e rges. ArXiv preprint, V ol. 0, No. 0, Article 0, Publication date: June 2016. Efficient Attack G raph Ana lysis through Approximate Inference 0:27 8. CONCLUS IONS Bayesian Netwo rks are a po werful tool for the static and dynamic an aly sis of AGs: the unconditional probabilities at each node in the graph (no t only fo r the target) pr o vide useful inform ation to system administrators f or sec urity risk assessment and mitiga- tion. The value s of these pro babilities take into account the depend e ncies between the differen t attack paths and the difficulty of exploiting e ach vulne rability , in co ntrast to other measure s p roposed in the literature to perf orm risk assessment in AGs. Howev e r , the scalability p roblems o f the exact inf erence techniques p roposed in the literature f or the static and dynamic analysis of BAGs limit the applicability of these te chnique s to graphs with a few hundre ds of nodes, far from the size of the AG s w e can e xpect in large corp orate networks. In this pap er w e have show n that LBP , an app roximate inferenc e technique, can be used e f fectively for the static and dy n amic an aly sis of large BAGs . W e have ver- ified thro ugh ex p eriments that the r e duction in the computational cost and memory requiremen ts is signifi c an t. Moreov er o ur ex perimental evaluation shows that LBP scales linearly w ith the nu mber of nodes for both the static a n d the dy namic a n alysis . Overall these results show significan tly better per formance than the techniques pro- posed fo r the analysis of BAGs in the literature so far . W e h ave exp erimented with synthetic AGs with a bro ad variety of topo logies in an e ffort to ensure the applicability of the technique to many ne twork d e ployme n ts . The gains in scalability are obtained at the p r ice of a loss in accuracy on the p robabilities . W e have ho wever v erified thro ugh experime nts that this accuracy loss is very low with an average RMSE of le ss than 0 . 03 , especially taking in to account that the value s for the p r o bability of succe ssful ex ploita- tion of the vulne rabilities , use d to build the BAG models, are non-acc u rate estimates . W e have also shown thro ugh the exper ime nts that LBP co mpares favourably w ith the JT , the state of the art technique f or exact infe rence in BAGs [Mu ˜ noz-Gon z ´ alez et al. 2015]. Although a significant am o unt of literature on the application of AG exists, few studies have considered the computational aspect of making infe rence on them. Furthermore, the lack of scalability has significantly h in dered the ir ap plication. Our results show that by u sing the right te chnique s , both static an dyn amic analysis can be pe r f ormed on AGs w ith tho usands of nod e s , ev en o n a standard laptop com puter . W e have also e valuated the e ffect of clustering on the perfo rmance o f the analysis and shown that this can lead to further significant gains in perf o rmance. Our future re- search plans include mod elling the attacker’s capabilities to estimate the probability of successful ex ploitation o f vuln e rabilities , and the use of Bayesian infe rence te ch- niques to help prio ritizing fore n sic investigation using AGs. A CKNO WLEDGMENTS The a u thors would like to thank British T elecom for their collaboration in t h is research and our colleagues in our research g roup for th eir contribution to this work through many useful discussions. This research has been funded by th e UK government un der EPSRC project EP/L022729/1. REFERENCES 2015. CVE Details. The ultimate security vulnerability datas ource. http://www .cvedetails.c om. (2015). M. Albanese, S. Jajodia, and S. Noel. 2012. Time-Efficient and Cost-Effective Network Hardening usin g Attack Graphs . In In t. Conf . on Dependable Systems and Networ ks . 1–12. M. Al b a n ese, S. Jajodia, A. Singh al, an d L. W ang. 2013. An Efficient Approach to A s sessing the Risk of Zero-Day V ulnerabilities. In Int. Conf . on Security and Cryptography , V ol. 456. 322–340. P . Ammann, D. Wijesekera, and S. Kau shik. 2002. S calable, Graph-Based Network V ulnerability Analysis . In Procs . Conf . on Computer and Communications Security . 217–224. F . Baiardi, F . Coro, F . T onelli, and D. Sgandurra. 2014. A Scenario M eth od to Automatically As sess ICT Risk. In Int. Conf . on P arallel, D istributed and Networ k-Based Processing . 544–551. ArXiv preprint, V ol. 0, No. 0, Article 0, Publication date: June 2016. 0:28 L. Mu ˜ noz-Gonz ´ alez et al. F . Baiardi and D. Sg andurra. 2013. Assessing ICT Ri s k through a Monte Carlo Method. Environment Sys- tems and Decisions 33, 4 (2013), 486–499. C. M. Bishop. 20 0 6 . P attern Recognition an d Machine Learning . Springer , New Y ork, NY . Common V u lnerability S coring System, V3. 2015. Development update. ht tps://www .first.org/cvss. (2015). G. F . Cooper. 1990. The computational complexity of probabilistic in ference u sing Bayesian belief networks. J . of AI 42, 2 (1990), 393–405. D. Cotroneo, A. Paudice , and A. Pecc hia. 2015. Aut omated root cause identi fi cation of security alerts: E v al- uation in a SaaS Cloud. Future Generation Computer Systems (2015). F . Cu ppens, F . Autrel, A. Miege, an d S. Benferhat. 2002. Correlation in an Int rus ion Detection Process. In Internet Security Communication Wor kshop . 153–172. R. Dechter. 1996. Bucket elimination: A unifying framework for probabilistic in ference. In Procs . Int. Conf . on Uncertainty in AI . 211–219. R. Dew ri, N . Poolsappasit, I. Ray, and D. Whitl ey . 2007. Optimal Security Hardening usi n g Mu lti-Objective Optimization on Attack Tree Models of Networks . In Procs . of the 14th Conf . on Computer and Commu- nications Security . 204–213. M. Frigault, L. W ang, A. Sing hal, and S. Jajodia. 20 0 8 . Measuring network security us ing dynamic Bayesian network. In Procs . W orkshop on Q uality of protec tion . 23–30. Gartner , Inc. 20 1 4 . Gartner Says W orldwide Information Security Spending Will Grow Almost 8 Percent in 2014 as Organizations Become More Threat-A ware. http://www .gartner .com/newsroom/id/2828722. (2014). N . Idika and B. Bhargava. 2012. Ex t ending Attack Graph-Based Security M etrics and Ag gregating their Application. IEEE T rans . on Dependable and Secure Computing 9, 1 (2012), 75–85. A.T . Ihl er , J .W . Fisher, an d A.S. Willsky . 2005 . Loopy Belief Propagation: Con v ergence and Effects of Message Errors . J . of Machine Learning Researc h 6 (2005), 905–936. K. Ingols, M. Chu , R. Lippmann, S. W ebster, and S. Boyer. 2009. Modeling modern n etw ork attacks and countermeasures using attack graphs. In Conf . Computer Security Applications . 117–126. S. J ajodia, S. Noel, and B. OB erry. 2005. T opological analysis of netw ork attack vuln erability . In M anaging Cyber Threa ts . 247–266. S. Jha, O. Sheyner, and J . Wing. 2002. Two F ormal Analyses of Attack Graphs. In Procs . of the W orkshop on Computer Security F ou ndations . 49–63. B. Juba, C. M usco, F . Long, S. Sidiroglou-Dou s kos, an d M.C. Rinard. 2015. Principled Sampling for Anomaly Detection. In Network and Distributed System Security Symposium . 1–14. D. K oller and N . Friedman. 2009. Probabilistic Graphical Models: Principles and T echniques . MIT press, Cambridge, MA. S. L. Lauritzen an d D.T . S pieg elhalter. 1988. Local computations with probabilities on g raphical structures and th eir applications to expert s ystems. J . of the Royal Statistic al Society . Series B (Methodological) 50, 2 (1988), 157–224. W . Li and R.B . V augh n. 200 6 . Cl u ster Security Research In volving t he Modeling of Network Exploitation s Using Exploitation Graphs. In Int. Symp . on Cluster Computing and the Grid . 1–11. R. Lippmann, K. Ingols, C. Scott, K. Piwowarski, K. Kratkiewicz, M. Artz, and R. Cunning ham. 2006. V al- idating and Restoring Defense in D epth Using Attack G raphs. In Procs of Military Communications Conf . 1–10. Y . Liu an d H. Man . 2005. Network vu l nerability ass essment using Bayesian networks. In Data Mining, Intrusion Detection, Inform. Assurance , and Data Networks Security , V ol. 5812. 61–71. N . Lord. 2015. The History of Data Breaches. https://digitalguardian.com/blog/history- data- breaches. (2015). A. Mi l en koski, M . Vieira, S. K ou nev, A. Avritzer, an d B.D . Pa yne. 2015. E v aluating Comput er Intrusion Detection Systems: A Survey of Common Practices. 48, 1 (2015). J .M. Mooij an d H.J . Kappen. 2005. S ufficient Conditions for Convergence of Loopy Belief Propagation. In Procs . of the Conf . on Uncertainty in AI . 396–403. L. Mu ˜ noz-Gonz ´ alez, D. Sgandurra, M. Barr ` ere, and E.C. Lupu. 2015 . Exact In ference T echniques for the Dynamic Analysis of Att a ck Graphs. arXiv preprint arXiv:1510.02427 (2015). K.P . Murphy. 2012. Machine Learning: A Probabilist ic P erspe ctive . MIT press , Cambridge, M A. K.P . Mu rphy, Y . W eiss, and M.I. Jor dan. 1999. Loopy Belief Propagation for Approximate Inference: An Empirical Study . In Procs . of the Con f . on Uncertainty on AI . 467–475 . S. Noel an d S. Jajodia. 2014. Metrics Suite for Netw ork Attack Graph Analytics. In Procs . of the 9th Annu al Cyber and Information Security Researc h Conference . 5–8. ArXiv preprint, V ol. 0, No. 0, Article 0, Publication date: June 2016. Efficient Attack G raph Ana lysis through Approximate Inference 0:29 S. Noel, S. Jajodia, B. O’ Berry, and M. Jacobs. 2003. Efficient Minimum-Cost Network Hardening Via Exploit Dependency Graphs. In Procs of the 1 9 th Computer Security Applications Conference , 2003 . 86–95. R. Ortalo, Y . Deswarte, and M. Ka ˆ aniche. 1999. Experimenting with Qu antitative Evaluat i on T ools for Mon- itoring Operational Security . IEEE Tr ansactions on Software En gineering 25, 5 (1999), 633–650. X Ou, WF Boyer, and MA M cQueen. 2006. A scalable approach to attack graph generation. In Procs . Conf . on Computer and Communications Security . 336–345. J . Pamula, S. Jajodia, P . Ammann, and V . Swarup. 200 6 . A W eakest-Adversary Security Metric for Netw ork Configuration Security Analy s is. In Wo rkshop on Q u ality of Prote ction . 31–38. J . Pearl. 1982. Reverend Bayes on inference eng i n es: A distributed hierarchical approach. In Procs . National Conf . on AI . 133–136. J . Pearl. 1988. Probabilistic Reasoning in Intelligent Systems: Networ ks of Plausible Inference . Morgan Kauf- mann. A. Pec chia, A. Sharma, Z . Kalbarczyk, D. Cotroneo, and R.K. Iyer. 2 011. Identifying Compromised Users in Sh ared Computin g Infrastructures: A Data-Driven Bayesian Network Approach. In Procs . of the Int. Symp . on Reliable Distributed Systems . 127–136. C Philli ps and L.P . Sw iler. 1998. A graph-based system for network-vulnerability analysis. In Procs . of the W orkshop on New Security P aradigms . 71–79. N . Po olsappasit , R. Dewri, an d I. Ray. 2012. D ynamic Security Risk M a n agement using Bayesian Attack Graphs. IEEE T rans . on Dependable an d Secure Computing 9, 1 (2012), 61–74. L Rabiner an d BH Juang. 1986. An In troduction to Hidden Markov M odels. IEEE ASSP M agazine 3, 1 (1986), 4–16. E. Raftopoulos an d X. Dimitropoulos. 2011. Detecting, V ali dat ing and Characterizing Computer Infections in th e Wild. In Procs . of the Conf . on Internet Measurement Conference . 29–44. E. Raftopoulos and X. Dimitropoulos. 2013. Un derstanding Network F orensics Analysis in an Operational Environment. In Security and Privacy W orkshops . 111–118. B. Schneier. 1999. Attack trees . Dr . Dobbs journal 24, 12 (1999), 21–29. G. R. Shafer and P .P . Shenoy. 1990. Probability propagation. Annals of M athematics and AI 2 (1990), 327– 352. A. Sh arma, Z. Kalbarczyk, J . Barlow, and R. Iyer. 2011. Analysis of Security Data from a Large Computing Organization. In Int. Conf . on Dependable Systems Networ ks . 506–517. P .P . Shenoy and G.R. Shafer. 1990. Axioms for probability and belief-function proagation. In Procs . Conf . on Uncertainty in AI . 169–198. O. Sheyner, J . Haines, S. Jha, R. Lippmann, and J . Wing. 2002. Automated Generation an d Analysis of Attack Graphs . In Procs . of the IEEE Symp . on Securit y and Privacy . 273–284 . O. S h eyner and J . Wing. 2004. T ools for Gen erating an d Analyzin g Attack Graphs. In F ormal M ethods for Components an d Obj ects . 344–371. T . Sommestad, M. Ekstedt, and P . Johnson. 2009. Cyber Security Risks Assessment with Bayesian Defense Graphs and Architectural M odels. In Hawaii Int. Conf . on System Sciences . 1–10. G. P . Spathoulas and S. K. Katsikas. 2010. Reducing F alse Positives in Intrusi on Detection Systems. Comput- ers & Security 29, 1 (2010), 35–44. L.P . Swi l er, C Phillips, D Ellis, and S Chakerian. 2001. Computer -attack graph generation tool. In Procs . of the DA RP A Inform. Survivability C on f . and Exposition II , V ol. 2 . 307–321. Symantec. 2015. In ternet Security Threat Report - V olu me 20 - Appendices . https://www4.symant ec.com/ mktginfo/whitepaper/ISTR/21347931 GA- i n ternet- security- threat- report- volume- 20- 2015- appendices. pdf. (2015). G. T an, M. Poletto , J . Gut t ag, and F . K a ashoek. 2003. Role Cla s sification of Hosts Within Enterprise Net- works Based on Connection Patterns . In USENIX, General T rack . 15–28. F . V aleur, G i ovanni Vigna, C. Kruegel, and R.A. Kemmerer. 200 4 . Comprehensive approach to in trusion detection alert correlation. Dependable and Secure Computing , IEEE T ransactions on 1, 3 (July 2004), 146–169. DOI: http:// dx.doi.org/10.1109/TDSC .2004.21 L. W ang , T . Islam, T . Long, A. Singh al, and S. Jajodia. 2008. An attack graph-based probabilistic security metric. In Procs . 22nd IFIP W G 11.3 Conf . on Data and Applications Security . 283–296. Y . W eiss. 2000. Correctness of Local Probability Propagation in Graphical Models with Loops. Neural Com- putation 12, 1 (2000), 1–41. Y . W eiss. 2001. Comparing the Mean Field Method and Belief Propagation for Approximate Inference in MRFs. A dvanced Mean Field MethodsTheo ry and Practi ce (2001), 229–2 4 0 . ArXiv preprint, V ol. 0, No. 0, Article 0, Publication date: June 2016. 0:30 L. Mu ˜ noz-Gonz ´ alez et al. M. W elling and Y .W . T eh. 2001. Belief Optimization for Binary Networks: A Stable Alternative to Loopy Belief Propagation. In Procs . of the Con f . on Uncertainty in AI . 554–561. E. Wh eeler. 2 0 1 1 . Security Risk Management: Building an Information Security Risk Manag ement Program from the Ground Up . Syn gress Publishing. WhiteHat Security . 2015. W ebs i t e Security Statistics Report. https://info.whitehatsec.c om/rs/ whitehatsecurity/images/2015- Stats- Report.pdf. (2015 ). P . Xie, J .H. Li, X. Ou, P . Liu, and R. Levy. 2010. Usin g Bayesian Networks for Cyber Security An alysis. In Int. Conf . on Dependable Systems an d Networ ks . 211–220. A.L. Y uille. 2001 . CC CP Algorithms to Minimize the Bethe and Kikuchi Free Energies: Convergent Alter - natives to Belief Propagation. Neural Computation 14 (2001), 1691–1722. Received June 2016; revised J une 2016; accepted June 2016 ArXiv preprint, V ol. 0, No. 0, Article 0, Publication date: June 2016. ? G = ( E ∪ C, R r ∪ R i ) E C R r ⊆ C × E R i ⊆ E × C r e- quir e im- ply X = { X 1 , ..., X n } p ( X ) = n Y i =1 p ( X i | pa i ) (1) X i pa i X i X i ?? X i P r ( X i = T ) = p P r ( X i = F ) = 1 − p p ∈ [0 , 1] 1 p ( X i | pa i ) ?? X i p ( X i | pa i ) pa i X i pa i e i X i p ( X i | pa i ) p v i v i ? p v i ? ? ? p v i X i pa i ? ? AND OR X i pa i X i OR pa i X i p e AND T o sim- plify the math- e- mat- i- cal no- ta- tion w e will re- fer to the un-
Original Paper
Loading high-quality paper...
Comments & Academic Discussion
Loading comments...
Leave a Comment