Visualizing textual models with in-text and word-as-pixel highlighting
We explore two techniques which use color to make sense of statistical text models. One method uses in-text annotations to illustrate a model's view of particular tokens in particular documents. Another uses a high-level, "words-as-pixels" graphic to…
Authors: Abram H, ler, Su Lin Blodgett
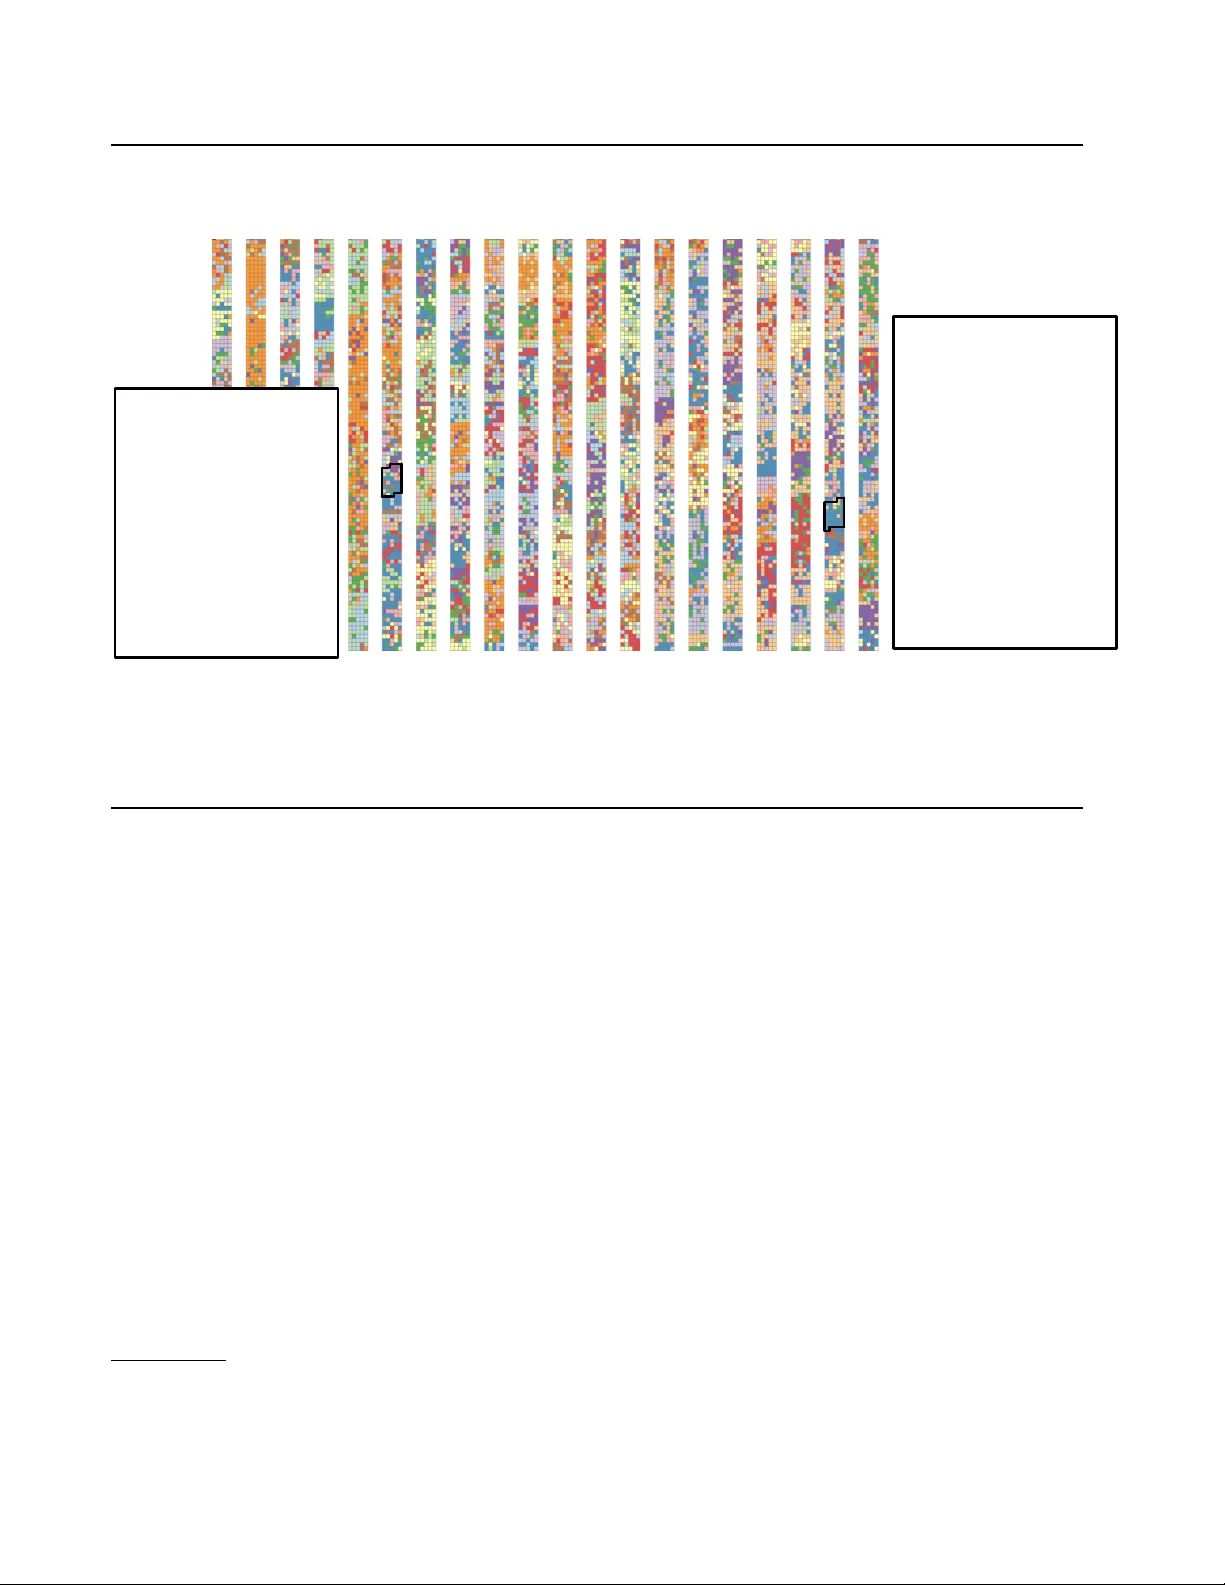
V isualizing textual models with in-text and word-as-pixel highlighting 2002 : 58 If anyone doubts this, let them look to Afghanistan, where the Islamic `` street '' greeted the fall of tyranny with song and celebration . Let the skeptics look to Islam's own rich history , with its centuries of learning , and tolerance and progress . America will lead by defending liberty and justice because they are right and true and unchanging for all people everywhere . ( Applause.) 1959 : 104 Further, all of us know that to advance the cause of freedom we must do much more than help build sound economies . The spiritual , intellectual , and physical strength of people throughout the world will in the last analysis determine their willingness and their ability to resist Communism. Figure 1: A topic model’ s token-le vel posterior memberships P ( z t | w t ) shown as in-te xt annotation ( § 3 ) and w ord-as-pixel ( § 4 ) vie ws, from a corpus of U.S. presidential State of the Union speeches. Speeches are concatenated, running in columns; top-left is 1946, bottom right is 2007. (This version shows a sample of tok ens.) Demo: http://slanglab.cs.umass.edu/topic- animator/ Abram Handler A H A N D L E R @ C S . U M A S S . E D U Su Lin Blodgett B L O D G E T T @ C S . U M A S S . E D U Brendan O’Connor B R E N O C O N @ C S . U M A S S . E D U College of Information and Computer Sciences, Uni versity of Massachusetts, Amherst, MA, 01060, USA Abstract W e explore tw o techniques which use color to make sense of statistical text models. One method uses in-text annotations to illustrate a model’ s view of particular tokens in particular documents. Another uses a high-lev el, “words- as-pixels” graphic to display an entire corpus. T ogether , these methods offer both zoomed-in and zoomed-out perspectiv es into a model’ s un- derstanding of text. W e show ho w these intercon- nected methods help diagnose a classifier’ s poor performance on T witter slang, and make sense of a topic model on historical political texts. 2016 ICML W orkshop on Human Interpretability in Machine Learning (WHI 2016) , Ne w Y ork, NY , USA. Copyright by the au- thor(s). 1. Introduction Probabilistic models of text are a core technology for natural language processing. Such models typically link words or phrases with semantic categories, like classes or topics. When we analyze data with these models, we need to understand how the method interprets text in order to perform (1) exploratory and confirmatory data analysis and (2) error analysis for engineering improv ements. Previous work on interpreting and understanding text mod- els has focused on summarizing text at the semantic or cat- egory le vel—for instance, by sho wing a list of most proba- ble words in a particular latent topic ( Gardner et al. , 2010 ; Chaney & Blei , 2013 ). In this work, we emphasize that text is originally a se- quence of symbols (characters or words), intended for a 116 V isualizing textual models with in-text and word-as-pixel highlighting person to r ead . A system can provide insight into what a text model is thinking by showing a user the original te xt with automatic in-text annotations describing the model’ s inferences ( § 3 ). Such annotations can be shown abstractly with a zoomed-out words-as-pixels view ( § 4 ) of text. W e demonstrate our methods using topic models on political speeches and language classification on dialectal T witter . 2. Models For all models that we consider, a document d consists of a sequence of symbols { w t : t = 1 ..N d } . This could be a sequence of words, or a sequence of characters; we refer to elements in such a sequence as tok ens (though § 5 examines a character-based model). For a particular model, we de- fine a token-le vel visual quantity of interest ψ t for position t , which corresponds to an interesting value in the model. These ψ t values are then encoded as visual attributes when displaying the original token sequence directly to the user ( § 3 ). 2.1. T oken-le vel models (LD A) First we consider models that define latent variables at the token le vel. For e xample, the latent Dirichlet allocation ( Blei et al. , 2003 ) model of te xt posits a document d arises from a θ d weighting o ver K topics, where each token has a latent class z t , inde xing which word distribution φ k is used to generate word w t : P ( w t , z t | θ d , φ ) = φ z t ,w t θ d,z t . W e con ventionally describe φ k as a topic . At a single token position, the posterior topic membership breaks do wn as a compromise between document pre va- lence versus le xical probability; LDA is able to learn inter - esting representations since indi vidual documents tend to be about a subset of topics and individual topics tend to in- clude a subset of the v ocabulary . The probability of a given latent topic is: P ( z t = k | w t , θ , φ ) ∝ P ( z t | θ d ) P ( w t | φ z t ) W e consider the vector of membership probabilities to be the visual quantity of interest, defining: ψ t = [ P ( z t = k | w t , θ , φ )] k =1 ..K Although we demonstrate our method using LD A, the same approach and methodology would apply to other common text models. For example, supervised sequence models (such as conditional random fields; Lafferty et al. ( 2001 )) also place tokens into semantic categories using token-lev el variables which can be visualized, as is often done in an- notations interfaces for information extraction. 1 Similarly , Karpathy et al. ( 2015 ) giv e an excellent demonstration of 1 e.g. Brat: http://brat.nlplab.org/ visualizing latent states of a character-lev el long short-term memory (LSTM) recurrent neural network using token- lev el, in-text annotations (like § 3 ) to help understand a ma- chine learned model. 2.2. T oken-le vel posterior impacts (MNB, LogReg) Many models do not directly define random variables at the token-le vel, but sufficient statistics resulting from individ- ual tokens hav e a clear interpretation in terms of ho w they affect inferences on model variables. An example is docu- ment classification, where the frequencies of words impact the posterior probability of the document class. Concretely , we consider multinomial naive Bayes ( McCal- lum & Nigam , 1998 ), whose generati ve assumption posits that each document d has a discrete label y d (drawn from distribution π ), and the document’ s tokens are indepen- dently generated from a single topic φ y d . Giv en learned parameters π and φ , to classify a doc- ument, we utilize the posterior P ( y d | w 1 ..w N d ) ∝ P ( y d ) Q t P ( w t | y d ) and calculate the posterior log-odds between classes a and b : log P ( y = a | ~ w ) P ( y = b | ~ w ) = log π a π b + X t log P ( w t | y = a ) P ( w t | y = b ) | {z } ψ t W e restrict our attention to comparing the model’ s relativ e preferences for two classes a and b , and define ψ t to denote the token-lev el logit weight for one token instance t in the text, representing how much that token contributes to the posterior prediction of the document class. A wide v ariety of other models in the supervised setting may also define ψ t terms; for example, logistic re gres- sion has a very similar form ( Ng & Jordan , 2002 ). In the binary classification case, with bias term β 0 and word weights β 1 ..β V , logistic regression can be formulated sim- ilarly as MNB in the case where features are word counts n v = P t 1 { w t = v } and the “posterior” log odds is log[ p ( y = a | ~ n ) /p ( y = b | ~ n )] = β 0 + P v β v n v , in which case the token-le vel logits 2 are ψ t = β w t . In practice, for both LD A and MNB, the full generativ e model is rarely used for all the te xt; for example, at the v ery least, terms are excluded due to being stopwords, punctua- tion, having a very high or very lo w frequency (e.g. Boyd- Graber et al. ( 2014 )) or are filtered out during feature se- lection. This causes many tokens to not be accounted for in the model and thus do not change the posterior . For MNB, we define ψ t = 0 in such cases. 2 One issue is that non-linear transforms of the word counts, such as thresholding or log scaling, often improve classification performance ( Y og atama et al. , 2015 ); unfortunately , they do not correspond to a uniform per-tok en impact. 117 V isualizing textual models with in-text and word-as-pixel highlighting 2.3. N-gram features It is useful to define features over n-grams, where each in- stance comes from a span in the text in the form of a [start position, end position) pair; e.g. span [3 : 5) corresponds to a bigram w 3:5 in positions 3 and 4. Using n-gram features, MNB is no longer a proper generati ve model of the te xt se- quence ~ w but is still widely used in this setting where the document’ s log-probability log P ( ~ w | y d ) is defined as the sum over all n-grams in the model. In this case we define the span-lev el weight ψ s : e in a similar manner as § 2.2 : log P ( y = a | ~ w ) P ( y = b | ~ w ) = log π a π b + X s : e log P ( w s : e | y = a ) P ( w s : e | y = b ) | {z } ψ s : e Since a single token may participate in multiple overlap- ping n-grams, we define the token-lev el weight as the sum of the weights of all (ov erlapping) n-grams that include t : ψ t = X ( s,e ): t ∈ [ s,e ) ψ s : e This can be extended to logistic re gression or other feature- based classifiers as well. ψ t answers part of the counterfac- tual: if the token t was deleted, the prediction’ s logodds would change 3 by − ψ t . Other linguistic features could also be visualized using color annotations. For example, a syntactic dependency path P is a sequence alternating between tokens and di- rected edges (e.g. Mintz et al. ( 2009 )). Unlike an n-gram, the set of tokens in a path is not necessarily contiguous. But tokens can be colored in the same way through a ψ t = P P : t ∈ S ( P ) ψ P value: for a word token, the sum of the model’ s weights for paths whose token set S includes the token. If dependenc y edges are sho wn alongside the text, the y could colored in a similar way . 3. In-text visualization W e define a visual encoding function f ( ψ t ) to select the fi- nal visual attributes to represent the quantity of interest to the user , inspired by W ilkinson ( 2006 )’ s grammar of graph- ics approach to data visualization. W e would like to sho w the original te xt, with visual an- notations. Some easily implementable options for visual encoding include • Color: the background or foreground te xt color . • Boldf ace or italics. 3 This analysis ignores the impact of new n-gram features, bridging position t , that would be introduced; on the other hand, the new text likely would not be a valid or likely text, so perhaps the counterfactual vie wpoint is limited. • Underlines (possibly v arying color or line width). • Size of te xt. In our preliminary experiments, color emerged as an ef- fectiv e encoding scheme. Color can represent multiple di- mensions as well as scalar v alues. Previous research in vi- sualization has e xamined how to effecti vely encode data in color giv en the strengths and weaknesses of the human visual system (e.g. W are ( 2012 ); Munzner ( 2014 )), and re- search results such as the ColorBrewer palettes 4 are av ail- able for use. (On the downside, colors can pose an issue for colorblind users.) T ext size is another interesting option, 5 — but unfortunately v ariable sized text is often difficult to read. Boldface and italics have a relati vely limited informa- tion capacity , and we found underlines visually busy . (An alternate approach is to use extra-textual visual cues along- side words; for example, Chahuneau et al. ( 2012 ) aligns a bar graph (heights corresponding to ψ t ) next to word to- kens.) For the vector-v alued ψ t from LD A, we assign dif ferent topics to dif ferent color hues (but similar brightness le vels) and assign a token’ s color according to the argmax of ψ t . (An additional possible strategy may be to blend the color tow ards white if the posterior entropy is higher .) For binary document classification with a scalar-valued ψ t , there is a diver ging semantics: negati ve ψ and positiv e ψ should correspond to dif ferent colors (e.g. red versus blue), blending to white at ψ = 0 . W e utilize this for classifier visualizations. 4. W ords-as-pixels visualization Color can be used in zoomed-out vie ws as well. For a very high aggre gation le vel, such as summarizing topic frequen- cies across thousands of documents over time, the same colors can be used as the in-text annotations to assist inter- pretation. W e propose a complementary , high-lev el level view— wor ds as pixels , sho wn in Figure 1 . Here, indi vidual tok ens are represented as pixels or very small squares with color- ing from their ψ t , and these points are laid out in order within a document. W e arrange as left-to-right descending columns, mimicking the natural reading order of many left- to-right languages, and thus corresponding to a zoomed-out view of the original te xt. 6 When documents hav e a natural ordering, such as date of 4 http://colorbrewer2.org/ , https://bl. ocks.org/mbostock/5577023 5 Both word and tag clouds have long sought to encode fre- quencies from a bag-of-words using text size, e.g. the W ordle system ( http://www.wordle.net/ ) 6 An inspiration is the zoomed-out scrollbar view of the Sub- lime T ext editor . 118 V isualizing textual models with in-text and word-as-pixel highlighting publication, or sections or chapters within a book, multi- ple documents can laid out one after another . This allows the user to see certain discourse structures in the text; at least, ones that are captured by the model. In Figure 1 , we visualize LD A on a corpus of U.S. presidential State of the Union speeches from 1946–2007 using David Mimno’ s jsLD A data preprocessing and topic model implementation ( 2016 ). 7 W e av erage 100 Gibbs samples to calculate the P ( z t | w t ) posteriors to be the ψ t quantities. The model clearly picks up on natural local groupings of latent topics in the te xt. This is dri ven in part by the model assump- tions encoded in data preprocessing, since this version of the corpus defines model “documents” as paragraphs from the speeches. The model assumption is that topic prev a- lence can be expected to vary by textual locality , and the visualization allo ws a qualitati ve assessment of to what ex- tent this assumption holds in the posterior inferences. This is apparent in the example: for example, large streaks of orange correspond to detailed discussions of b udgets that were common in the 1940s and 1950s. W e in- clude callouts of individual paragraphs with a strong blue topic prev alence: discussion of political ideologies with regards to Communism (Eisenhower in 1959) and Islam (Bush in 2002). W e aim to develop this interface as a linked views data e xplorer ( Buja et al. , 1996 ; O’Connor , 2014 ) where a user can click on the word-as-pixel vie w to show the corresponding text passage. A web demo is available at http://slanglab.cs.umass.edu/ topic- animator/ . 5. Classification: Language identification in social media A key step in any internet text analysis pipeline is to iden- tify which language a text was written in. Character n-gram models (where each w t is a character symbol) are a widely used approach for this task, and the popular open-source langid.py tool ( Lui & Baldwin , 2011 ; 2012 ) 8 uses a multi- nomial Naiv e Bayes model. Short texts pose a challenge for language identification — and social media messages also present a domain adapta- tion problem, since they contain much creati ve and non- standard language very dif ferent from traditional well- edited corpora that NLP systems are typically trained on. For example, langid.py uses Wikipedia corpora as a major source of training data. W e examined a corpus of tens of millions public T wit- ter messages geolocated in the U.S., filtered to users who 7 https://github.com/mimno/jsLDA The words-as- pixels vie w only shows tokens that are in the model, which here is roughly half of all tokens in the text after preprocessing. 8 https://github.com/saffsd/langid.py Predicted as Portugese (pt) Predicted as Irish Gaelic (ga) Figure 2: T weets we assess as English that were classified as non-English; ev ery character position t has is own ψ t . Blue indicates a ψ t log-likelihood weight to wards the non- English language; red tow ards English. use language statistically associated with neighborhoods containing high populations of African-Americans. 9 As expected from the emerging sociolinguistic literature on social media corpora ( Eisenstein , 2015a ; b ; Jones , 2015 ; Jørgensen et al. , 2015 ), these messages contain rich dialec- tical language very different from well-edited genres of En- glish. In fact, ev en after filtering only to messages only containing Latin-1 characters, 10 langid.py classifies 17% of these users’ messages as non-English, but upon inspection, nearly all of them are English. W e used in-text highlighting to help diagnose model errors (Figure 2 ), assigning each character at position t a color reflecting ψ t , the sum of all n-gram feature weights that fire at that position ( § 2.3 ). For example, the common term lmao ( laughing my ass off ), ends in ao , a common suffix in Portugese identified by the classifier . The characters nna , which are common in modal verbs in non-formal American English (e.g. gonna , wanna , and the African-American English-associated finna short for fixing to ) cause confusion tow ards Irish Gaelic. 9 Details in paper under revie w . 10 This filter giv es the classifier an easier dataset more similar to its training data; for example, this e xcludes emoji. 119 V isualizing textual models with in-text and word-as-pixel highlighting Another result that we did not expect is the issue of sparsity in short texts. Many messages ha ve only a small number of firing features (which we anticipate could lead to low ac- curacy), which is partly due to the feature selection process used to train langid.py ’ s models, suggesting that its sparsity lev el may be tuned to a le vel more appropriate for longer documents than for these short ones. 6. Conclusion This work stems from a fundamental aspect of te xt pro- cessing: the most natural and intuitiv e way to grasp the full meaning of a written text is simply to read it. W e believ e in- text annotation is a less explored, but natural choice for e x- plaining and under standing a computer’ s vie w of language. W e present a few simple methods for viewing text models, but e xpect many av enues for future work. References Blei, Da vid M., Ng, Andrew Y ., and Jordan, Michael I. La- tent dirichlet allocation. The Journal of Machine Learn- ing Resear ch , 3:993–1022, 2003. Boyd-Graber , Jordan, Mimno, David, and Newman, David. Care and feeding of topic models: Problems, diagnos- tics, and improvements. In Handbook of Mixed Mem- bership Models and Its Applications . CRC Press, 2014. Buja, Andreas, Cook, Dianne, and Swayne, Deborah F . In- teractiv e high-dimensional data visualization. Journal of Computational and Graphical Statistics , 5(1):78–99, 1996. Chahuneau, V ictor , Gimpel, K evin, Routledge, Bryan R., Scherlis, Lily , and Smith, Noah A. W ord salad: Re- lating food prices and descriptions. In Pr oceedings of EMNLP/CoNLL , pp. 1357–1367, July 2012. Chaney , Allison J.B. and Blei, David M. V isualizing topic models. In Pr oceedings of ICWSM , 2013. Eisenstein, Jacob . Identifying re gional dialects in online social media. In Boberg, C., Nerbonne, J., and W att, D. (eds.), Handbook of Dialectology . W iley , 2015a. Eisenstein, Jacob. Systematic patterning in phonologically- motiv ated orthographic variation. J ournal of Sociolin- guistics , 19(2):161–188, 2015b. Gardner , M.J., Lutes, J., Lund, J., Hansen, J., W alker , D., Ringger , E., and Seppi, K. The topic browser: An inter- activ e tool for browsing topic models. In NIPS W orkshop on Challenges of Data V isualization , 2010. Jones, T aylor . T o ward a description of African American V ernacular English dialect regions using “Black T wit- ter”. American Speech , 90(4):403–440, 2015. Jørgensen, Anna, Hovy , Dirk, and Søgaard, Anders. Chal- lenges of studying and processing dialects in social me- dia. In Pr oceedings of the W orkshop on Noisy User- generated T ext , Beijing, China, 2015. A CL. Karpathy , Andrej, Johnson, Justin, and Li, Fei-Fei. V i- sualizing and understanding recurrent networks. arXiv pr eprint arXiv:1506.02078 , 2015. Lafferty , J., McCallum, A., and Pereira, F . Conditional ran- dom fields: Probabilistic models for segmenting and la- beling sequence data. In Pr oceedings of ICML , pp. 282– 289, 2001. Lui, M. and Baldwin, T . langid.py: An of f-the-shelf lan- guage identification tool. In Pr oceedings of ACL, Demo Session , 2012. Lui, Marco and Baldwin, T imothy . Cross-domain feature selection for language identification. In In Pr oceedings of 5th International Joint Confer ence on Natural Lan- guage Pr ocessing , pp. 553–561, 2011. McCallum, Andrew and Nigam, Kamal. A comparison of e vent models for nai ve Bayes te xt classification. In AAAI-98 W orkshop on Learning for T ext Cate gorization , volume 752, pp. 41–48, 1998. Mimno, Da vid. jsLD A: In-bro wser topic models (in prepa- ration). 2016. Mintz, Mike, Bills, Ste ven, Snow , Rion, and Jurafsk y , Daniel. Distant supervision for relation extraction with- out labeled data. In Pr oceedings of ACL/IJCNLP , pp. 1003–1011, August 2009. Munzner , T amara. V isualization Analysis and Design . CRC Press, 2014. Ng, Andre w and Jordan, Michael. On discriminative vs. generativ e classifiers: A comparison of logistic regres- sion and nai ve Bayes. Advances in neural information pr ocessing systems , 14:841, 2002. O’Connor , Brendan. MiT extExplorer: Linked brushing and mutual information for exploratory text data analysis. In Pr oceedings of the A CL W orkshop on Inter active Lan- guage Learning , V isualization, and Interfaces , 2014. W are, Colin. Information visualization: per ception for de- sign . Elsevier , 2012. W ilkinson, Leland. The grammar of graphics . Springer , 2006. Y ogatama, Dani, Kong, Lingpeng, and Smith, Noah A. Bayesian optimization of text representations. In Pr o- ceedings of EMNLP , pp. 2100–2105, September 2015. 120
Original Paper
Loading high-quality paper...
Comments & Academic Discussion
Loading comments...
Leave a Comment