ARL Libraries and Research: Correlates of Grant Funding
While providing the resources and tools that make advanced research possible is a primary mission of academic libraries at large research universities, many other elements also contribute to the success of the research enterprise, such as institution…
Authors: Ryan P. Womack
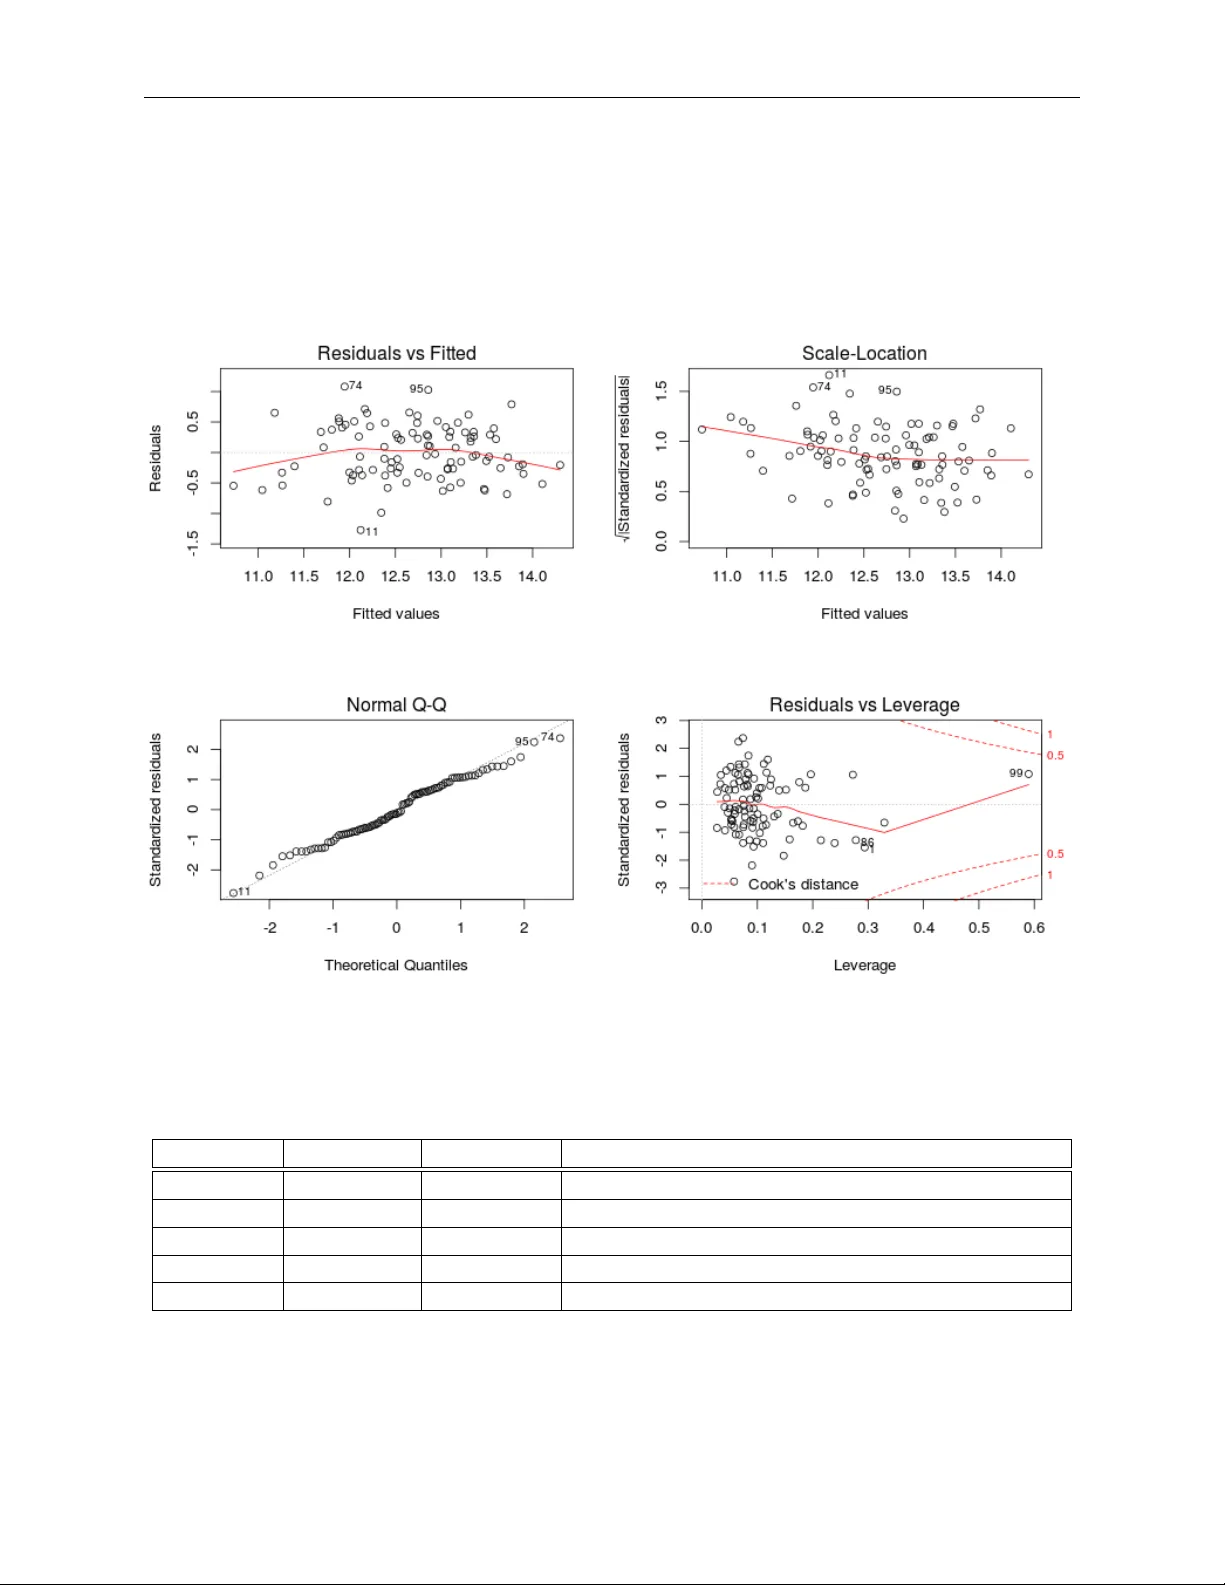
ARL Libraries and Researc h: Correlates of Gran t F unding Ry an P . W omac k ∗ Octob er 18, 2018 Abstract While pro viding the resources and to ols that make adv anced research possible is a primary mission of academic libraries at large researc h universities, man y other elements also con tribute to the success of the researc h enterprise, such as institutional funding, staffing, labs, and equip- men t. This study focuses on U.S. members of the Asso ciation for Research Libraries (ARL). Researc h success is measured b y the total grant funding received b y the Univ ersity , creating an ordered set of categories. Com bining data from the NSF’s National Center for Science and En- gineering Statistics, ARL Statistics, and IPEDS, the primary explanatory factors for research success are examined. Using linear regression, logistic regression, and the cum ulative logit mo del, the best-fitting mo dels generated by ARL data, NSF data, and the com bined data set for b oth nominal and p er capita funding are compared. These mo dels pro duce the most rele- v an t explanatory v ariables for research funding, which do not include library-related v ariables in most cases. Keyw ords: A cademic Libraries, Researc h, Univ ersities ∗ Ry an W omac k is Data Librarian at Rutgers Univ ersity-New Brunswic k, rwomac k@rutgers.edu 1 W omack, ARL Libraries and Research 1 Bac kground and Literature Review A cademic libraries are under increasing pressure to demonstrate their relev ance to the scholarly en terprise via concrete metrics. The literature of professional librarianship is replete with discus- sions the imp ortance of libraries, but thorough quantitativ e studies are somewhat rarer. Sev eral quan titative approac hes to ev aluating the impact of academic libraries hav e b een used, as discussed in the literature review b elo w. Some studies demonstrate the imp ortance of the library to student outcomes. Whitmire [22] found that gains in critical thinking skills among undergraduates, as measured by the College Stu- den t Exp eriences Questionnaire, w ere linked to library measures taken from the Integrated Post- secondary Education Data System (IPEDS). Mezic k [12] also used IPEDS data along with data from the Asso ciation of Research Libraries (ARL) and the Asso ciation of College and Research Libraries (ACRL) to show a correlation b etw een library exp enditures and professional staff and studen t retention. Researc hers at the Universit y of Minnesota [19] used detailed student records to demonstrate a p ositiv e relationship b etw een academic p erformance and library use. A second approach has b een to look for the impact of library resources on faculty publications. F or example, Budd [5] studies facult y pro ductivit y and uses rank-order c orrelations to sho w a mo derate asso ciation b etw een the quantit y of faculty publishing at ACRL institutions and library exp enditure and v olumes held. The n umber of PhD’s a warded also sho ws similar levels of correlation. Surv eys of faculty attitudes tow ards academic libraries, suc h as Mikitish and Radford [13], are another wa y to establish v alue. Hendrix [11] used principal comp onen ts analysis to study the relationship b etw een faculty ci- tations and library v ariables from the ARL Statistics. While strong asso cations were present in the initial dataset, no asso ciations with facult y citations were found when using size-indep enden t measures of library activity . In an earlier article, Hendrix [10] also conducted a bibliometric study on medical sc ho ols using principal comp onen ts metho dology . Another wa y of addressing the pressure to demonstrate the contin uing relev ance of libraries is to adopt business paradigms, such as return on inv estmen t (ROI) [7]. In contrast to a business en vironment with clearly defined profit and loss, the inputs and outputs in the library context are harder to pin do wn, and are imp erfectly addressed by existing data sources. T enopir [20] describ ed the ev alution of ROI b y w orking with administrators to understand their attitudes tow ards library supp ort and its impact on gran t funding. A t sev eral institutions, the article citations used in gran t prop osals w ere studied and combined with qualitativ e information from surveys of facult y submitting grant prop osals which testified to the v alue of the library . T urning to studies that use larger data sets and more extensive quantitativ e metho ds, Allen and Dic kie [2] built a regression mo del that relates library exp enditure as the resp onse v ariable to v arious institutional measures suc h as the size of programs, enrollments, and faculty . W einer [21] built a dataset that combined IPEDS, ARL, and US News and W orld R ep ort p eer assessmen t scores, along with sev eral other sources to determine factors influencing institutional rep- utation. She then used step wise linear regression to build explanatory mo dels. Library expenditure w as influen tial in all mo dels, and gran ts and instructional exp enditures were also influential. 2 Goals of this study A ma jor characteristic and limitation of most of the studies men tioned ab ov e (with the notable exception of W einer) is that they use only library data to explain the outcome of in terest. But in the context of a universit y , a w ell-p erforming library may b e correlated with many other factors 2 W omack, ARL Libraries and Research that more directly influence studen t success, since the b est libraries are t ypically at the best sc ho ols with the best funding, b est support services, b est facult y , and so on. Allen and Dickie’s w ork sho ws ho w library funding can b e predicted from these factors. W orking only with library v ariables to demonstrate the library’s relev ance do es not allow for alternative explanations and is a weak form of pro of. Ho wev er, W einer’s study did include other institutional reputational factors in order to select a mo del that combined v ariables from differen t spheres. The presen t study tak es a similar approach to mo deling b oth library and other academic factors, but with a wider range of statistical metho ds and a larger selection of v ariables. This will pro vide one metho d of determining whether library c harac- teristics are the primary explanatory factors for the outcome, or whether they are only secondary factors that ha ve some explanatory p o wer due to their correlation with other primary factors. Our primary response v ariable will b e researc h productivity , as measured b y gran t funding. Gran t funding for research is a central c haracteristic for the reputation and iden tity of ma jor research univ ersities. W e will look at a representativ e group of researc h univ ersities and assess whether library or other academic and institutional c haracteristics are related to gran t funding. A secondary dimension of in terest is the effect of fitting linear regression, logistic regression for binary outcomes, and cum ulative logit mo dels for multi-category ordered outcomes. Logistic and cumulativ e logit metho ds can help explain data that is categorical in nature, rather than con tinuous, and ma y pro vide a b etter fit than linear regression in man y settings. By comparing different fitted mo dels, w e will b egin to understand the v ariables that are most closely related to research funding. Most imp ortan tly , our mo del selection pro cess will select the b est explanatory v ariables from among all candidate v ariables. Whether or not the final fitted mo del includes library-related v ariables will b e a strong indicator of library relev ance to the universit y’s research pro ductivit y . 3 Metho ds 3.1 Data Collection The Asso ciation of Research Libraries (ARL) is the leading grouping of large research libraries in North America. The ARL Statistics ha ve b een collected annually since 1908 [4]. In 2012, there w ere 125 members, 17 of which were in Canada. The 108 members lo cated in the United States consist of 99 universit y research libraries and 9 institutional libraries (e.g., the New Y ork Public Library , National Library of Medicine, Library of Congress, and so on). This study uses data only from the 99 US universit y libraries, who comp ete for researc h funding under similar conditions. The Canadian research funding environmen t is not directly comparable. Although the ARL mem b ership contains most of the largest universities from a researc h funding standp oin t, there are notable exceptions. Institutions that receive large research gran ts such as Stanford, the California Institute of T ec hnology , Carnegie Mellon, and others are not ARL members. Other institutions in the ARL are ranked b elow the top 200 in researc h funding, such as How ard Univ ersity (#208 in 2012) or Kent State Universit y (#248), far b elo w many non-ARL mem b ers. Ho wev er, the ARL has the longest-running and most complete collection of library statistics, and this data sample has the most p otential for detailed comparisons ov er time. With the exceptions noted, it remains a v ery represen tative grouping of the most activ e researc h universities. Data from the year 2012 was used for comparability with the most recently av ailable data at the time of the study , collected from the other sources describ ed b elow. The National Center for Science and Engineering Statistics (NCSES) of the National Science F oundation (NSF) is the most systematic collection of data on researc h funding and inputs to researc h in the US. The Higher Education Research and Dev elopmen t (HERD) survey , whic h is the 3 3.2 Mo deling W omack, ARL Libraries and Research most systematic collection of data on research funding and inputs to researc h in the United States [17]. The HERD rep orts annually on lev els of researc h funding from all sources: federal, state, local, nonprofit, business, internal institutional funding, and other sources. F or the purp oses of this study , the total research funding received in 2012 was the primary resp onse v ariable of in terest, although federal funding is the largest share of funding and closely tracks the total. The NCSES Surv ey on Science and Engineering F acilities [16] rep orts on the total amoun t of existing square fo otage of researc h space, as w ell as newly constructed space in the last year, dedicated to science and engineering researc h at universities in the US, in lab oratories, animal researc h facilities, computer labs, equipmen t ro oms, and other such facilities. The latest av ailable data, at the time of the study , from the fiscal year 2011 w as used. Data is collected every t wo years, so there is no direct equiv alen t to 2012. Since these v ariables function as a likely input to future gran t receipts, using the earlier year is reasonable. Planned construction and repair and renov ation costs w ere excluded from the dataset since they are not likely to b e directly related to grant success. Finally , in order to add other measures of staffing and salary expenses in non-library categories, along with additional institutional c haracteristics, data for 2012 was extracted from the In tegrated P ostsecondary Education Data System (IPEDS) of the National Center for Education Statistics [15]. The IPEDS data rep orts the num b er of emplo yees, the total salary exp enses, and the num b er of F ull-Time Equiv alent (FTE) employ ees in sev eral categories. All of these wa ys of measuring emplo yment are included in the dataset. Since medical research is a large comp onent of ov erall research dollars, data from the Asso ciation of Academic Health Sciences Libraries was also considered [3]. How ever, the ov erall magnitude of medical library exp enditures and staffing is not large compared to their general academic library coun terparts. F or example, at the Universit y of Mic higan, collections sp ending is $2 million in the medical library v ersus $24 million in the main library , and professional FTE emplo yment is 15 versus 212. The medical data also has man y missing v alues and introduces questions of comparabilit y that w ould require in vestigation of each institution’s library and institutional configuration of its medical researc h vis-à-vis the rest of the campus. The IPEDS data contains indicator v ariables for medical degree-gran ting and presence of a hospital, so these can serve as a proxy for an y distinctive medical effects. Based on these considerations, the AAHSL data was not included in the presen t study . The ARL, NCSES, and IPEDS data describ ed abov e w ere merged in to a single dataset for the 99 US ARL institutions under study . A t this stage there were 75 p ossible predictor v ariables represen ting inputs from library , researc h, infrastructure, and general staffing c haracteristics of the institutions. Details of the data cleaning pro cess are describ ed in the App endix. The data files used in this study , along with the R co de used to conduct the analysis, are a v ailable from op enICPSR at h ttp://doi.org/10.3886/E45486V1. The R co de provides more detail on the steps used in the mo deling pro cess describ ed b elow. The abbreviated v ariable names used to rep ort results in the pap er corresp ond to those in the R co de. T ables 4, 5, and 6 provide more complete descriptive names of the v ariables. 3.2 Mo deling The data is mo deled along three different dimensions. First, we consider as explanatory v ariables the library-based effects alone, then w e use the other academic institutional data alone, and then ev aluate the mo del with b oth library and institutional data. These approac hes will be termed libr ary, ac ademic, and c ombine d . Second, w e w ant to understand whether con tinuous or categorical resp onse v ariables pro duce more effective mo dels. W e will develop linear regression mo dels, logistic regression mo dels, and cum ulative logit mo dels for a four-category breakdown of researc h funding. These will b e termed 4 3.3 Library Data Univ ariate Analysis W omack, ARL Libraries and Research line ar, binary, and clm in what follo ws. Institutions are group ed in to four categories of researc h funding, based on the NCSES reported dollar amounts of researc h funding received in FY 2012, are listed b elow. Researc h funding (in millions of $) # of observ ations 1 <200 25 2 200-400 31 3 400-700 22 4 >700 21 These cutoff p oin ts were chosen as natural grouping p oints for the data that provide roughly equal n umbers of observ ations p er category . The binary categorization into Lo w or High research activit y is generated b y the dividing line of $400 million in research funding. As discussed ab o ve, the previous library literature pro vides little guidance on t he modeling c hoices, so we rely on standard statistical principles to make decisions. One rule of thum b is to allo w no more than 10 observ ations p er predictor in order to achiev e effective p ow er [18]. Therefore, dev eloping mo dels with 10 or even few er explanatory v ariables is a primary goal. Grouping the data into binary or a limited num b er of categories increases p ow er and allo ws us to build more parsimonious mo dels. Finally , our third dimension will b e the nominal, or as rep orted amount of research funding, v ersus per capita researc h funding. W e will measure the research funding receiv ed per facult y mem b er, and build mo dels on this basis to understand how p er c apita measures differ from the nominal for eac h of the mo del v arian ts . 3.3 Library Data Univ ariate Analysis F or the v ariables taken from the ARL data, w e analyze the correlation (using Sp earman’s rho) b et ween con tinuous ( RD ) and categorical measures of nominal research funding ( RDCAT for 4 category , RDBIN for binary), and each of the predictor v ariables. These results are rep orted in T ables 1, 2, and 3. The correlation matrix reveals very little difference b et ween the correlations of the categorical v ersions of research funding versus the con tinuous. This is reassuring and supp orts the idea that the categorical data is a useful simplification of the data that do es not distort the results. There is nev er more than a 0.052 difference in absolute v alue b et ween the RD and RDCAT correlations. This indicates that our mo deling results should b e robust with resp ect to the c hoice of resp onse v ariable. Among the library v ariables, w e eliminate tw o from consideration on logical grounds. Region and mem b ership year are not under the con trol of the institution, so ev en if correlations are disco v ered, they cannot guide p olicy . It is also difficult to interpret region in a sensible manner as an input to gran t funding. Membership year (the date the institution joined ARL) is correlated with researc h, with an earlier date implying higher research funding, but this is likely due to its correlation with the size, prestige, endowmen t, and other such attributes of the older schools. W e also eliminate from consideration v ariables with very lo w correlations with research, taking an absolute v alue of less than 0.1 as the cutoff. W e do not wish to remov e to o many v ariables at this stage, in case they play a secondary role as mo difiers in a multiv ariate mo del. Among the library v ariables, the num b er of part-time students, part-time graduate students, federated searc hes of library databases, and regular searc hes of library databases are not correlated. W e ma y conclude that it is full-time, but not part-time studen ts, that are correlated with high lev els of research. 5 3.4 Mo deling Pro cess W omack, ARL Libraries and Research Measures of searching may b e of in terest to librarians studying c hanging mo des of access, but they app ear to not b e of primary relev ance to research output. After these mo difications, there are 29 library-related v ariables retained in the dataset, listed in T able 4. Plotting the v ariables individually rev eals that they all ha ve an asymmetric long-tailed distribu- tion. This is understandable since these are counts bounded b elow by zero, and typically a handful of institutions will hav e muc h larger collections, budgets, or staffs than the mid-size institutions. Using the log transform on all of the explanatory v ariables improv es their distributions to a more normal shap e. F or example, see Figure 3.1 for the effect of the log transform on illtot, the n umber of interlibrary loan b orrowings. Figure 3.1: illtot b efore and after log transform Some skewness and outliers remain in a few cases, but the long tails are eliminated b y the log transform. As a result, w e use the log transformed v ersions of all contin uous v ariables for all mo deling. Throughout the pap er, “ log ” prefixed to the original v ariable name indicates the log transformed version of the original data (e.g., illtot b ecomes logilltot ). Next, we run individual linear regressions of all explanatory v ariables against nominal research funding ( RD ). All of the remaining v ariables are significan t at at least the 0.1 level. While this may b e because there is a strong association of all v ariables with the size of the institution, w e will k eep all v ariables under consideration for the next phase of mo deling. 3.4 Mo deling Pro cess With suc h a large set of v ariables, we turn to step wise regression to partially automate the v ariable selection pro cess. In general, we will examine the results of working from a minimal mo del (starting from a common v ariable lik e the num b er of library volumes) and adding v ariables, and compare this with the results of a “maximal” mo del that includes all of the explanatory v ariables and attempts to drop them one-by-one. W e alwa ys allow v ariables to mov e in and out of the mo del, selecting in b oth forward and backw ards directions, due to the large num b er of v ariable candidates. The Ak aike Information Criterion (AIC) allo ws us to simultaneously consider the fit and parsimony of the mo del. The MASS library in R implements step wise AIC selection with the stepAIC function, whic h w e use as the basis of the v ariable selection pro cess. The stepAIC pro cess requires cases with an y missing data to b e dropp ed, but once the mo del is selected, w e re-run the regression with all cases included so that w e can rep ort a complete explanatory fit. Sometimes the minimal and maximal starting p oin ts con verge on the same final mo del, but often 6 W omack, ARL Libraries and Research they do not. In this case, we must use our judgmen t to select one. Once a mo del is selected, we con tinue to drop v ariables whose co efficients are individually insignificant, as long as AIC does not c hange by a large amount. There is some judgmen t inv olved, as w e are more interested in simplifying the mo del (and possibly sacrificing the optim um AIC v alue) when the n umber of v ariables included is very large. Our primary fo cus is on the impact of the individual v ariables, since w e are more in terested in ho w v ariables are related to and p otentially explain v ariation in research funding than in developing the most accurate (in terms of explaining all v ariation) or the b est predictiv e mo del. Therefore, inclusion in or exclusion from the mo del is more imp ortant for the present analysis than a close examination of the effect sizes generated b y the regression co efficien ts. 4 Results 4.1 Library Mo dels for Nominal Research Output W e first presen t the results of the regression mo dels fit to nominal research output, using v ariables from the ARL data set only . These include descriptiv e measures of the size of the institution (e.g., n umber of graduate students, PhD’s a warded, etc.), but no research inputs other than library v ariables. 4.1.1 Library linear mo del Linear regression mo del selection, fitting, and diagnostics in this pap er use standard techniques such as those found in Mon tgomery et. al. [14]. The linear regression mo del fit b y stepAIC is • l og RD = − 4 . 62 + 0 . 252 ∗ log ill tot − 2 . 16 ∗ l og expl m − 0 . 57 ∗ log salstud + 2 . 28 ∗ l og totexp − 0 . 43 ∗ log totstu + 0 . 38 ∗ l og g r adstu + 0 . 36 ∗ l og phdaw d + 0 . 26 ∗ log phd f ld + 0 . 94 ∗ l og expong oing + 0 . 11 ∗ l og ebook s [0.6994 adjusted R 2 ] Dropping the e-b o ok v ariable which is not individually significant, w e get • l og RD = − 4 . 54 + 0 . 41 ∗ l og g r adstu − 0 . 58 ∗ l og sal stud + 2 . 29 ∗ l og totexp + 0 . 33 ∗ l og phdaw d + 0 . 28 ∗ l og ill tot − 0 . 42 ∗ l og totstu + 0 . 32 ∗ log phd f ld − 2 . 04 ∗ log explm + 0 . 85 ∗ log expong oing [0.694 adjusted R 2 ] In this equation, the co efficients on the individual v ariables are all significant at at least the 0.1 lev el, and the magnitudes are quite similar to the original stepAIC mo del. W e can also consider only v ariables under library con trol to isolate those effects, giving • l og RD = − 13 . 00 − 0 . 62 ∗ log salstud + 2 . 90 ∗ l og totexp + 0 . 27 ∗ l og ill tot − 2 . 52 ∗ l og expl m + 1 . 54 ∗ l og expong oing [0.553 adjusted R 2 ] In this case the adjusted R 2 drops off. T otal library exp enses, exp enses on ongoing resources, and in terlibrary loans are p ositiv ely correlated with research funding. These v ariables relate to the curren t strength of the library and its collections. Student salaries and materials exp enditures are negativ ely related. This is somewhat counterin tuitive, but one p ossible interpretation is that once the ov erall spending and ongoing resources are accounted for, sp ending on student salaries (as opp osed to professional salaries) and materials exp enditures that are not subscription-based ma y b e asso ciated with less researc h-oriented activity . The non-library v ariables sho w p ositive relationships for PhD’s aw arded, PhD fields of study , and graduate students, all clearly asso ciated with research activit y . T otal students is negatively correlated, which could b e explained as a correcting factor 7 4.1 Library Mo dels for Nominal Researc h Output W omack, ARL Libraries and Research for undergraduate-hea vy institutions. As shown in Figures 4.1 and 4.2, the diagnostic plots on these regressions show a go o d fit in general, with only a few outliers which are the high researc h institutions at the very end of the scale, like Johns Hopkins. Figure 4.1: Diagnostic Plots for Library Linear Mo del including all significant v ariables T o understand the impact of the effects in the library-only mo del, consider a ch ange from the 1st quartile to the 3rd quartile of the range of each of the library v ariables (in original v alues, not log transform), with predicted effect shown b elo w: 1st Quartile 3rd Quartile prop ortional predicted c hange in Research F unding salstud 525300 1090000 0.636 totexp 18510000 34050000 5.857 illtot 24390 47190 1.20 explm 8624000 12500000 0.260 exp ongoing 6561000 10480000 2.057 F or example, this sho ws that, according to the mo del, an increase in library total exp enditure ( totexp ) from $18 million to $34 million w ould b e exp ected to b e asso ciated with an almost six-fold increase in researc h funding. 8 4.1 Library Mo dels for Nominal Researc h Output W omack, ARL Libraries and Research Figure 4.2: Diagnostic Plots for Library Linear Mo del, library v ariables only W e can see that total library exp enditure has a m uch stronger p ositive relationship with research funding than other v ariables, but that this is counteracted by materials exp enditure ( explm ). If ma- terials exp enditure increased with all other things equal (implying that total exp enditure remained constan t), the mo del predicts a reduction in researc h funding. In reality , all of these v ariables are link ed and would change sim ultaneously , so w e are lo oking at relativ e effects that must b e interpreted in context. 4.1.2 Library binary mo del Next we consider the mo del with a binary High/Low research level as the outcome. The binary outcome is mo deled with standard logistic regression tec hniques such as those in Agresti [1]. A logit link function is used, so the mo del equation predicts the logit, or log o dds ratio of b eing in the High category . With the large num b er of v ariables, some manual interv ention and selectiv e dropping of insignifican t v ariables is required in order to ach ieve con vergence and successful step wise AIC from the minimal mo del starting p oin t. The final selected mo del, with AIC of 64.83, is: • l og it ( RD B I N ) = − 79 . 45 + 5 . 80 ∗ log g radstu − 3 . 44 ∗ l og studast + 2 . 01 ∗ log exponetime + 2 . 92 ∗ l og pr f stf 9 4.2 A cademic Mo dels for Nominal Research Output W omack, ARL Libraries and Research Deviance and deviance residuals indicate a go o d fit. This mo del pro vides a simple explanation of researc h funding as a function of graduate students, student assistants, one-time library exp endi- tures, and library professional staff. Professional staff is significant at the 0.1 level, while all other v ariables are significant at 0.05 or higher. A ttempting to remov e loggradstu worsens AIC signifi- can tly , so w e do not simplify the mo del further than this. Only student assistants hav e a negative relationship to research, presumably b ecause they are less closely related to research activity and ma y substitute for professional employmen t. Note that the magnitudes of the staffing v ariables are relatively small. Moving from the 1st quartile of professional staffing ( logprfstf ) at 62 to the 3rd quartile at 116.5 multiplies the o dds of b eing in the high research category by 1.84 times. 4.1.3 Library clm mo del W e use a cum ulative link mo del (clm) with logit link to mo del 4-category ordinal data. The cumula- tiv e logit mo del allows differen t threshold probabilities for each of the four categories, but provides prop ortional o dds ratios on the predictors, which are easy to interpret. The do cumen tation for the ordinal pack age in R con tains an excellen t outline on the use and in terpretation of cumulativ e link mo dels [6]. Agresti also discusses clm mo dels. Lik e logisitic regression, these mo dels generate an equation that predicts the logit function or log o dds of the probabilit y of b eing in the category of in terest. The exact functional form of the cumulativ e logit differs for eac h category level, with a differen t intercept term for each level. Since we are more in terested in the o verall effect of eac h explanatory v ariable rather than the category-level predictions, we rep ort the co efficien ts on eac h v ariable with the separate in tercepts for eac h category omitted. The o dds are prop ortional for eac h category in the cumulativ e logit. In this case, the stepAIC function do es not con verge from the maximal mo del including all v ariables. But starting from a minimal mo del (using logvols as the starting v ariable) achiev es con vergence. Individually dropping insignifican t v ariables from this mo del giv es the following final mo del, where the logit of the probabilit y of b eing in a particular research category is prop ortional to: • l og it ( RD C AT ) ≈ 1 . 49 ∗ log g r adstu + 0 . 99 ∗ log il l tot − 2 . 39 ∗ l og studast + 4 . 05 ∗ log totstf x + 2 . 08 ∗ l og phd f ld All v ariables are significant at the 0.05 level. Again, deviance and deviance residuals indicate a go o d fit. The v ariables selected are similar in nature to the binary case, although, in terestingly , there are no exp enditure v ariables in this mo del. The size of the researc h program of the institution is rep- resen ted b y a p ositiv e relationship with graduate students and PhD fields, while library “intensit y” is represented by a p ositive relationship with interlibrary lending and total staffing including stu- den ts, along with a negativ e relationship with the num b er of student assistan ts. Using categorical and ordinal represen tations of the data has resulted in a simpler mo del which is p erhaps easier to in terpret, compared to the linear mo del. 4.2 A cademic Mo dels for Nominal Research Output W e now build mo dels based on the other academic v ariables from IPEDS and NCSES. The only v ariables that are dropp ed from mo deling on the basis of low univ ariate correlation are the presence of a ten ure system for librarians, the num b er of Sales employ ees, Sales FTEs, and exp enditure on Sales employ ees. Apparently Sales is one of the supp ort staff categories unrelated to research output. 10 4.2 A cademic Mo dels for Nominal Research Output W omack, ARL Libraries and Research Institutional control (public or priv ate) is also not strongly correlated with research, but the public/priv ate status of a univ ersity has a ma jor influence on the nature of the organization in other wa ys, so w e lea ve it in to see if it will enter a mo del at a later stage. The v ariables related to researc h itself (Research exp ense, Research salaries, etc.) are highly correlated with research at 0.85 or greater, but there is an endogeneit y problem. The research grants themselv es directly fund many of the salaries and exp enses of research, so w e c ho ose to drop these from the mo del. T o some exten t, the same argumen t could b e made for research and lab oratory space, which in many cases would b e built from previous research grants. Ho wev er, there is more p oten tial for a univ ersity to construct this space on its o wn, and in any case it results from prior gran ts, not the curren t researc h cycle, so w e lea ve these v ariables in. There are still 51 explanatory v ariables remaining, so w e will hav e some work to do in selecting our mo dels. Man y v ariables are slightly different wa ys of measuring the same thing, such as the n umber of Service staff, the n umber of FTE Service staff, and the exp ense on Service staff. The complete list of academic v ariables is listed in T ables 5 and 6, which also include the research v ariables used throughout the study . Once again, the contin uous v ariables are b ounded b elo w and ha ve longer upp er tails due to a few extreme v alues. Log transformation is applied to all contin uous v ariables to restore them to normalit y . 4.2.1 Fisher’s Exact T est As a preliminary step, we will use Fisher’s Exact test on the categorical predictors to see if they are related to the binary classification of research funding or not. AAU membership and Medical Degree-gran ting are significan t, while Institutional Control, Land Grant status, and presence of a Hospital are not. AA U membership has an estimated o dds-ratio of 21.51 (with 95% confidence in terv al of 6.38 to 96.07), so it has a strong effect. Since AAU universities are considered to b e the largest and most research intensiv e, this result is not surprising. The o dd-ratio of granting a medical degree is smaller at 3.65 (with 95% confidence interv al of 1.24 to 12.41). Hospitals are not clearly related to researc h funding, p erhaps b ecause some hospitals affiliated with univ ersity medical schools are not directly under univ ersity con trol. 4.2.2 A cademic linear mo del After running individual regressions against each v ariable, we drop the follo wing v ariables whic h are not significan t at the 0.1 level: logRESSPACENEW , logCommServLegalArtsMediano , logCommServLegalArtsMediaexp , logProdTransMatsno, logProdTransMatsexp , and logProdTransMovingFTE . W e also drop logNatResourcesConstrMaintexp and logCommServLegalArtsMediaFTE , whic h although significan t at 0.1, are similar to the other em- plo yment v ariables in these categories which ha ve ev en higher significance. After sev eral iterations to deal with the large num b er of similar v ariables, w e get the following mo del • l og RD = − 0 . 21+0 . 55 ∗ log RE S S P AC E +0 . 47 ∗ log C ompE ng S ciF T E +0 . 11 ∗ l og E ndow ment + 0 . 57 ∗ log P H D Resear ch + 0 . 93 ∗ l og C ompE ng S ciE xp + 0 . 49 ∗ l og B usF inO psF T E − 0 . 12 ∗ log N atR esour ceC onstM aintF T E − 1 . 3 ∗ l og C ompE ng S cino − 0 . 16 ∗ l og M g mtF T E − 0 . 52 ∗ log B usF inO psexp All v ariables are significan t at the 0.01 level, and adjusted R 2 is 0.8956. Diagnostic plots sho w a reasonable fit, illustrated in Figure 4.3. Lo oking at reduced mo dels, w e can ac hieve an adjusted R 2 of 0.7876 with the follo wing simple equation: 11 4.2 A cademic Mo dels for Nominal Research Output W omack, ARL Libraries and Research • l og RD = 2 . 90 + 0 . 57 ∗ l og RE S S P AC E + 0 . 15 ∗ l og E ndow ment + 0 . 48 ∗ l og P H D Resear ch . Figure 4.3: Diagnostic Plots for A cademic Linear Mo del, academic v ariables only The v ariables in this v ersion of the academic linear mo del are mostly related to the size of the institution and its researc h activity . Several employmen t categories are related, and the magnitude of the effect is muc h greater for employmen t in computing, engineering, and science. Note that CompEngSci has t wo positive terms (FTE and exp enses) and one negative (num b er). A sp eculativ e in terpretation of this result would b e that a high n umber of CompEngSci employ ees along with lo w exp enses and FTEs w ould indicate a large po ol of lo w-lev el, part-time w orkers and a less in tensive scientific researc h program. But the ma jority of the magnitude of research funding can b e explained by considering only research space, endowmen t, and the num b er of research PhD’s gran ted as explanatory factors. 4.2.3 A cademic binary mo del Here we mo del the binary outcome of high/lo w researc h activity using the non-library academic ex- planatory v ariables for eac h institution. After studying the results of individual logistic regressions, a similar selection of non-significan t v ariables is remo ved b efore interactiv e mo deling via step wise AIC. PhD’s in professional practice, FTEs in teaching and other instructional supp ort, and employ- men t categories suc h as communications, legal, arts, media and pro duction, transp ortation, and mo ving do not mak e the initial cut. 12 4.3 Com bined Mo dels for Nominal Research Output W omack, ARL Libraries and Research After some t weaking, the stepwise AIC selection pro cess yields the following simple mo del: • l og it ( RD B I N ) = − 110 . 25 + 11 . 65 ∗ log T otal F T E staf f + 1 . 79 ∗ log E ndow ment − 4 . 79 ∗ log Of f iceAdminF T E − 2 . 09 ∗ l og M g mtF T E + 2 . 00 ∗ l og RE S S P AC E Deviance and deviance residuals indicate a go o d fit. All v ariables are significan t at 0.05 level or greater. It is interesting that this mo del uses total FTE staff for its primary p ositive effective rather than any sp ecific job category . Overall size of the institution app ears to b e the dominant effect. Ha ving too man y office administrative or management staff is associated with low er researc h output. 4.2.4 A cademic clm mo del As before, the clm model uses a four-category classification of research output as the resp onse v ari- able, now mo deled with the non-library academic explanatory v ariables. After the usual tw eaking of the step wise AIC pro cess, the following mo del was selected: • l og it ( RD C AT ) ≈ 3 . 38 ∗ l og RE S S P AC E + 9 . 79 ∗ l og T otalF T E staf f + 1 . 03 ∗ l og E ndow ment − 4 . 50 ∗ l og Al lS er v iceincl sal esof f iceadminconstr maintpr odtr ansF T E − 1 . 83 ∗ l og M g mtF T E All v ariables are significan t at <0.001 level here. This mo del is not significantly different by ANOV A from the mo del with the low est AIC, and has the adv antage of b eing simpler and having tightly defined parameter co efficients (within narrow CIs). Here the “All Service” category of employmen t replaces office administrative staff in the logistic mo del. The co efficients are also roughly similar, but the effect of researc h space has increased while endo wment effect has decreased. 4.3 Com bined Mo dels for Nominal Research Output W e now determine which of the library or academic v ariables retain significance in a mo del that allo ws each of these groups of v ariables to enter. Considering all of the initial v ariables in the dataset will not b e feasible given the limited num b er of observ ations. Instead, we use the results of our analysis ab ov e to dev elop our p o ol of v ariables. The com bined mo del for each t yp e is generated by including the v ariables in the final library equation and the v ariables in the final academic equation, then using step wise AIC with forw ard and backw ard inclusion to generate the final mo del. 4.3.1 Com bined linear mo del When we fit the linear mo del, the b est fit is generated by the iden tical v ariables as those in the academic-only case. In other w ords, the library v alues do not enter the mo del, and add no ex- planatory v alue. The equation has sligh tly differen t coefficients, presumably as a result of a sligh tly differen t path of iterativ e estimation. The impact and interpretation of the v ariables is the same as b efore. • l og RD = − 0 . 63+0 . 53 ∗ log RE S S P AC E +0 . 46 ∗ log C ompE ng S ciF T E +0 . 11 ∗ l og E ndow ment + 0 . 51 ∗ log P H D Resear ch + 0 . 95 ∗ l og C ompE ng S ciE xp + 0 . 48 ∗ l og B usF inO psF T E − 0 . 12 ∗ log N atR esour ceC onstM aintF T E − 1 . 31 ∗ l og C ompE ng S cino − 0 . 16 ∗ l og M g mtF T E − 0 . 52 ∗ log B usF inO psexp 4.3.2 Com bined binary mo del The b est fit is generated by: 13 4.4 Library Mo dels for Per Capita Output W omack, ARL Libraries and Research • l og it ( RD B I N ) = − 105 . 97+2 . 32 ∗ log RE S S P AC E +1 . 02 ∗ l og E ndow ment +6 . 00 ∗ l og g r adstu − 2 . 46 ∗ l og studast + 2 . 29 ∗ l og exponetime − 1 . 18 ∗ l og M g mtF T E All v ariables are significant at the 0.1 lev el or b etter. Once again, deviance and deviance residuals sho w no lac k of fit. The co efficients are similar to what we hav e seen in other mo dels. The library v ariables for one-time expenses and student assistants enter the mo del. These are not the v ariables that one might exp ect to hav e the most impact, but they app ear to explain some of the residual differences after researc h space, endowmen t, and graduate students en ter the mo del. 4.3.3 Com bined clm mo del In this case, our preferred mo del, which is not significantly different than the stepAIC-generated four-v ariable mo del with FTE Management staff included, is: • l og it ( RD C AT ) ≈ 2 . 92 ∗ l og RE S S P AC E + 0 . 73 ∗ log E ndow ment + 1 . 68 ∗ l og g r adstu No library-sp ecific comp onent enters the mo del. The graduate studen t count from the ARL data renders the other measures in the academic clm mo del unnecessary . Here the category of researc h funding is directly related to the univ ersity’s financial resources, physical space for research, and the size of the graduate program. This is simple and intuitiv e, but it also provides no evidence for the impact on research funding of other inputs to the researc h pro cess (libraries, computing, or otherwise). 4.4 Library Mo dels for P er Capita Output As discussed by Hendrix, it is imp ortant to analyze size-indep endent measures. The amount of researc h funding is strongly correlated with all measures of the size of the universit y , from enroll- men ts and emplo yment to endowmen ts. Our v ariables may ha ve en tered the nominal mo dels purely from this kind of correlation. T o understand relationships b et ween inputs and research funding that p ersist across institutions regardless of size, we will rep eat the same steps of analysis with p er capita measures as the resp onse v ariable. In this section, we tak e research funding p er capita, defined as researc h funding divided by the n umber of faculty , as our response v ariable. This do es mak e a difference in rankings, as we can see b elo w: ranking P er Capita funding T otal funding 1 Johns Hopkins Johns Hopkins 2 UCSD Mic higan 3 MIT Wisconsin 4 Duk e W ashington 5 Case W estern Reserve UCSD As b efore, for categorical data analysis w e define four categories of activity , outlined b elo w. Here the cutp oin ts are set to get generate almost equal n umbers in each category . F or binary analysis, lo w is simply b elo w $225,000 p er facult y , and high is ab ov e $225,000 p er faculty . Range (in thousands of dollars p er facult y) Number 1 0-152 25 2 152-225 24 3 225-350 25 4 350- 25 14 4.5 A cademic Mo dels for P er Capita Output W omack, ARL Libraries and Research W e drop the following v ariables from consideration for lack of correlation with p er capita re- searc h funding: InstControl , totstu , fac , LandGrant , presptcp , grppres , reftrans , studast , ProdTransMatsno , ProdTransMovingFTE , and Hospital . After considering individual regressions, w e drop logsalstud and logexpcollsup for lac k of significance. W e also use the log transform of p er capita researc h funding to normalize its distribution. 4.4.1 Library linear p er capita mo del Our preferred mo del is: • l og Rdpc = − 9 . 20 + 0 . 28 ∗ log phdaw d + 0 . 36 ∗ l og ill tot + 0 . 96 ∗ log salpr f + 0 . 67 ∗ log nprf stf − 1 . 63 ∗ l og totstf x This mo del has familiar v ariables representing collection uniqueness ( logilltot ) and research ac- tivit y ( logphdawd ). It places considerable emphasis on the level of staffing in the professional and supp ort ranks of the library , while only total staff including students is negatively asso ciated with researc h. All v ariables are significant at the 0.01 level. How ev er, adjusted R 2 is only 0.291, so w e are explaining muc h less of the v ariation in funding in the p er capita case compared to the nominal case. 4.4.2 Library binary p er capita mo del After the step wise AIC selection pro cess, the preferred mo del, whic h also has the low est AIC is • l og it ( RD B I N pc ) = − 42 . 92 + 1 . 47 ∗ log ill tot + 2 . 51 ∗ l og sal pr f − 2 . 09 ∗ l og totstf x The v ariable logtotstfx is only significant at the 0.07 level, but since this is already a parsimo- nious mo del, we retain it. This mo del fo cuses exclusively on library-sp ecific v ariables, with similar relationships to those in the linear model. Professional salaries is the lone p ositive v ariable from the staffing side, while total staffing including students is negative. This may b e interpreted as a higher p ercen tage of library professional staff and higher paid library professional staff b eing asso ciated with more researc h activit y . The no w familiar interlibrary loan total plays a p ositive role as well. Deviance residuals are within normal limits. The residual deviance indicates that this mo del explains less v ariation than the nominal binary mo del. 4.4.3 Library clm p er capita mo del F or the four category mo del, the selection pro cess conv erges quic kly to • l og it ( RD C AT pc ) ≈ 2 . 01 ∗ l og salpr f + 1 . 02 ∗ log il l ot + 0 . 65 ∗ l og phdaw d − 1 . 44 ∗ log salstud The co efficien t for logphdawd is significant at the 0.1 level, while the others are significant at the 0.01 lev el. The patterns in the data are similar to the previous tw o mo dels, with student salaries taking the place of totsftfx as the negative effect. All of the p er capita v ariants of the library mo dels include interlibrary loans and library professional salaries as p ositive correlates of research funding. 4.5 A cademic Mo dels for P er Capita Output With p er capita researc h output as the resp onse v ariable, the mo dels generated from the academic data tend to b e more complex than other mo dels, with many v ariables included. In con trast to 15 4.5 A cademic Mo dels for P er Capita Output W omack, ARL Libraries and Research man y of the other cases, additional v ariables cannot b e dropp ed without large changes in AIC. W e are left with mo dels with many mixtures of effects, as reflected b elo w. The mo dels are presented briefly b elow, and will b e discussed further when the mo dels are compared. 4.5.1 Fisher’s exact test, p er capita The AAU and MedicalDegree indicator v ariables retain their significance against p er capita measures. AA U mem b ership has an o dds ratio for high research activity of 5.35 (95% CI is 2.11 to 14.37). Offering a medical degree has o dds ratio 3.28 (95% CI is 1.18 to 9.90). 4.5.2 A cademic linear p er capita mo del The b est fitting mo del, with 13 explanatory v ariables is the following: • l og Rdpc = − 9 . 48+0 . 49 ∗ l og RE S S P AC E +0 . 43 ∗ l og P H D Resear ch − 1 . 43 ∗ l og F T N oninsstaf f no + 1 . 90 ∗ log F T N oninsstaf f exp − 0 . 27 ∗ l og M anag ementexp − 0 . 92 ∗ log C ompE ng S cino + 0 . 1 ∗ log H eal thcar eno − 0 . 19 ∗ log S erv iceexp − 0 . 80 ∗ log T otal F T E staf f +1 . 06 ∗ l og C ompE ng S ciF T E − 1 . 90 ∗ l og Al l S er v iceF T E + 0 . 74 ∗ l og S er v iceF T E + 1 . 06 ∗ l og O f f iceAdminF T E The staffing effects are somewhat complex with p ositive and negativ e co efficien ts for absolute num- b ers, FTEs, and exp enses in several emplo yment categories. This mo del may o verfit the data, using sev eral similar v ariables to fit small v ariations in researc h. As an explanatory model, it is difficult to in terpret. Ho wev er, adjusted R 2 is 0.704, muc h better than the library linear per capita model. Di- agnostic plots, sho wn in Figure 4.4, show this mo del fits the data w ell. Note that AllServiceFTE is an abbreviation for AllServiceinclsalesofficeadminconstrmaintprodtransFTE in the dataset. 4.5.3 A cademic binary p er capita mo del The v ariables omitted as insignifican t after individual regressions are very similar to those omitted in the nominal case. The selected mo del in the binary outcome case reduces deviance b y more than the library binary p er capita mo del, but not as muc h as the nominal mo del. Deviance residuals do not indicate lac k of fit. • l og it ( RD B I N pc ) = − 115 . 01 + 2 . 32 ∗ l og RE S S P AC E − 9 . 93 ∗ l og C ompE ng S cino + 9 . 10 ∗ log C ompE ng S ciexp +2 . 83 ∗ l og C ompE ng S ciF T E − 2 . 75 ∗ log Libcurar chteaching otherinstr suppor tF T E + 1 . 17 ∗ l og teaching otherinstr suppor t − 0 . 97 ∗ l og N atResour ceC onstr M aintF T E All parameter co efficients are significant at 0.01 or less, except for the co efficien t of logNatResourceConstMaintFTE , whic h is significant at the 0.1 level. The complex fit on CompEngSci staffing is notable, with exp en- diture and FTE b eing p ositiv e, while the actual n umber of staff is negative. W e may hypothesize that a high n umber of part-time staff is asso ciated with a less active researcher program. Other co efficien ts are similar to previous mo dels. 4.5.4 A cademic clm p er capita mo del Our selected mo del is • l og it ( RD C AT pc ) ≈ − 3 . 47 ∗ l og T otal F T E staf f +2 . 23 ∗ l og RE S S P AC E − 8 . 95 ∗ l og F T N oninsstaf f no + 8 . 30 ∗ log F T N oninsstaf f exp + 5 . 11 ∗ log C ompE ng S ciF T E − 4 . 49 ∗ l og C ompE ng scino + 0 . 90 ∗ log S er v iceF T E + 1 . 88 ∗ l og P H D Resear ch 16 4.6 Com bined Mo dels for P er Capita Output W omack, ARL Libraries and Research Figure 4.4: Diagnostic Plots for A cademic Linear Mo del, p er capita case All co efficien ts are significant at 0.05 except for logServiceFTE , which is significant at the 0.1 level. Some of these v ariables are the same or similar to the academic binary p er capita mo del. Notable additions are the p ositive relationship to the n umber of researc h PhD’s granted and the negative relationship to total FTE staff. 4.6 Com bined Mo dels for P er Capita Output As in the nominal case, we build mo dels for linear, binary , and clm from the com bined p o ol of v ariables selected in the library p er capita models and the academic p er capita mo dels. In this case, the mo dels selected are quite easy to describe because they are nearly iden tical to the academic p er capita mo dels, with one exception. 4.6.1 Com bined linear p er capita mo del Co efficien ts on all v ariables are significan t at at least 0.05, except for the co efficien t of logHealthcareno , whic h is significant at the 0.1 level. Adjusted R 2 is 0.693. • l og Rdpc = − 9 . 04+0 . 46 ∗ l og RE S S P AC E +0 . 48 ∗ l og P H D Resear ch − 1 . 46 ∗ l og F T N oninsstaf f no + 1 . 87 ∗ l og F T N oninsstaf f exp − 0 . 29 ∗ l og M anag ementexp − 0 . 90 ∗ l og C ompE ng S cino + 0 . 12 ∗ 17 W omack, ARL Libraries and Research log H eal thcar eno − 0 . 18 ∗ log S erv iceexp − 0 . 82 ∗ log T otal F T E staf f +1 . 04 ∗ l og C ompE ng S ciF T E − 1 . 75 ∗ l og Al l S er v iceF T E + 0 . 71 ∗ l og S er v iceF T E + 1 . 01 ∗ l og O f f iceAdminF T E All v ariables are the same as the academic p er capita mo del, and no library v ariables enter the mo del. 4.6.2 Com bined binary p er capita mo del The mo del selected in this case is: • l og it ( RD B I N pc ) = − 117 . 51+1 . 08 ∗ l og il ltot +1 . 62 ∗ l og R E S S P AC E − 9 . 63 ∗ l og C ompE ng S cino + 8 . 60 ∗ log C ompE ng S ciexp +2 . 44 ∗ l og C ompE ng S ciF T E +1 . 20 ∗ log teaching other instr support − 2 . 74 ∗ l og Libcur ar chteaching other instr suppor tF T E Compared to the academic binary p er capita mo del, logNatResourceConstMaintFTE has b een dropp ed and logilltot has entered the mo del. The entry of logilltot into the mo del has reduced the co efficient on logRESSPACE , while other co efficien ts ha ve not changed muc h. A t least in this mo del, in terlibrary loans and research space are metrics that share some of the explanation for researc h funding. Deviance residuals show no lac k of fit, and o v erall deviance reduction is mo derate in this mo del. 4.6.3 Com bined clm p er capita mo del Aside from sligh t c hanges in co efficients, the selected mo del in this case is iden tical to the academic clm p er capita mo del. • l og it ( RD C AT pc ) ≈ − 3 . 30 ∗ l og T otal F T E staf f +2 . 05 ∗ l og RE S S P AC E − 8 . 52 ∗ l og F T N oninsstaf f no + 8 . 01 ∗ log F T N oninsstaf f exp + 4 . 84 ∗ log C ompE ng S ciF T E − 4 . 43 ∗ l og C ompE ng scino + 0 . 92 ∗ log S er v iceF T E + 1 . 95 ∗ l og P H D Resear ch Lo oking at these last three com bined mo dels, w e can see that the library v ariables hav e little explanatory p ow er when considering p er capita research output. 5 Discussion 5.1 Comparison of mo dels W e summarize the v ariables selected by our mo dels in a simplified form to isolate the p ositiv e and negativ e effects of explanatory v ariables. First, the models using ARL library data only: Libr ary nominal lm logilltot - logsalstud + logtotexp + logphdawd + logphdfld + loggradstu - logexplm + logexp ongoing - logtotstu binary loggradstu - logstudast + logexp onetime + logprfstf clm logilltot + logphdfld + loggradstu - logstudast + logtotstfx Libr ary p er c apita lm logilltot + logsalprf + lognprfstf + logphda wd - logtotstfx binary logilltot + logsalprf - logtotstfx clm logilltot + logsalprf + logphda wd - logsalstud 18 5.1 Comparison of mo dels W omack, ARL Libraries and Research W e see that the interlibrary loan v ariable, logilltot , enters in to all but one of the library mo dels as a p ositive factor. Some measure of the size of graduate programs, whether PhD’s aw arded or graduate students, is nearly alw ays presen t as a p ositive factor. All p er capita mo dels show the salaries of library professionals as a positive factor, whereas the nominal mo dels tend to incorp orate v ariables for the o verall size of staff and some v ariants of library exp enditure. Salaries of student w orkers and num b er of studen t work ers enter into the mo dels as a negativ e factor for research funding, most consisten tly in the p er capita mo dels. In terms of complexit y , the linear mo dels include the most factors, often with p ositiv e and negativ e factors in the same general area (in the library case, p ositive effects for total exp enditure and ongoing exp enditure and negative effects for materials exp enditure). P er capita mo dels are more parsimonious than nominal models, with fiv e v ariables en tering the per capita lm mo del. The four category clm mo del is simpler with four v ariables, while the binary logistic mo del has the fewest explanatory v ariables at three. Second, the mo dels developed using academic indicators from NCSES and IPEDS are presented b elo w: A c ademic nominal lm logRESSP ACE + logCompEngSciFTE + logEndowmen t + logPHDResearch + logCompEngSciExp +logBusFinOpsFTE - logNatResourceConstMaintFTE - logCompEngScino - logMgm tFTE - logBusFinOpsexp binary logRESSP A CE+ logT otalFTEstaff + logEndowmen t - logOfficeAdminFTE - logMgm tFTE clm logRESSP ACE +logT otalFTEstaff + logEndo wment - logAllServiceinclsalesofficeadminconstrmaintprodtransFTE - logMgmtFTE A c ademic p er c apita lm logRESSP A CE + logPHDResearch + logFTNoninsstaffexp + logHealthcareno + logCompEngSciFTE +logServiceFTE + logOfficeAdminFTE - logManagementexp - logCompEngScino -logServiceexp -logT otalFTEstaff - logFTNoninsstaffno - logAllServiceinclsalesofficeadminconstrmain tpro dtransFTE binary logRESSP ACE + logCompEngSciexp + logteachingotherinstrsupportFTE + logCompEngSciFTE - logCompEngScino - logNatResourceConstMain tFTE - logLib curarc hteac hingotherinstrsupp ortFTE clm logRESSP ACE + logFTNoninsstaffexp + logCompEngSciFTE + logServiceFTE + logPHDResearc h - logT otalFTEstaff - logFTNoninsstaffno - logCompEngScino The mo dels here explain muc h more of the v ariation in research, but are also more complex. The linear mo dels app ear to o verfit the data. There are numerous parallel p ositive and negative terms for the same employmen t categories, with num b er, exp ense, and FTEs receiving differen t signs. How ev er, research space, endo wment, and researc h PhD’s gran ted are consistently positively asso ciated with researc h funding. Staffing relationships are complex, but we can note that com- puting, engineering, and science staffing plays a large role in the p er capita mo dels. V arious other categories of emplo yment suc h as management, sales, and service, make their app earance as neg- ativ e correlates of gran t funding. The ov erall picture supp orts the view that research intensit y is asso ciated with researc h-centric inputs. As with the library v ariables, the clm and binary mo dels pro duce simpler equations with fewer significan t v ariables. These mo dels are easier to interpret. F or example, the nominal binary logistic mo del predicts that endowmen t, research space, and total FTE staff (less office administrative and managemen t staff ) are p ositively asso ciated with research funding. This is an in tuitive and simple relationship. 19 5.2 Findings W omack, ARL Libraries and Research Finally , the mo dels developed using the combined set of v ariables are summarized b elow: Combine d nominal lm logRESSP ACE + logEndowmen t + logCompEngSciFTE + logPHDResearch + logCompEngSciExp +logBusFinOpsFTE - logNatResourceConstMaintFTE - logCompEngScino - logMgm tFTM - logBusFinOpsexp binary logRESSP ACE + logEndowmen t+loggradstu - logstudast + logexp onetime - logMgmtFTE clm logRESSP ACE + logEndowmen t+loggradstu Combine d p er c apita lm iden tical to Academic p er capita - no library v ariables binary similar to A cademic p er capita, but with + illtot instead of logNatResourceConstMain tFTE clm iden tical to Academic p er capita - no library v ariables The com bined models sho w little effect of library v ariables. Some of the ARL measures of institutional size en ter in to the mo dels, but the only v ariables ab out library activity that enter are one-time exp enses (in the nominal binary mo de) and interlibrary loan (in the p er capita binary). Otherwise, the mo dels are v ery similar to the mo dels selected from the academic-only v ariables. 5.2 Findings Here we discuss the conclusions that can b e dra wn from the analysis ab ov e, k eeping in mind the ca veat that this study is only a snapshot of a single p oint in time for a limited num b er of institutions based on a v ailable data, and that correlation do es not imply causalit y . • The library mo dels pro vide some evidence that professional librarian staffing is correlated with high lev els of research activity . The most consisten t effect among library-sp ecific v ariables is the p ositive relationship of in terlibrary loan levels to research output. Material is not lent out via ILL unless it is in demand by the researc h communit y and unique to the holding library . Duy and Lariviere [8] hav e studied the connection betw een ILL and researc h in the Canadian con text. Also, Henderson [9] has prop osed a collection failure quotien t that tak es interlibrary b orro wing requests as a main indicator of collection failure. These articles b oth argue for the centralit y of ILL as a measure of the distinctive strengths of an institution’s collection as opp osed to the more crude title and volume coun ts. Having high ILL rates is then an influen tial marker of the quality of the library’s collection, and its ability to supp ort research activit y . ILL is the only library-sp ecific v ariable to en ter in to any of the p er capita combined mo dels. The v ariable for interlibrary b orrowing ( ilbtot ) might reflect facult y needs b ey ond a library’s holdings. How ev er, in terlibrary b orrowing is not selected for in any of the mo dels, either as a p ositive of negative factor relating to research. • On the other hand, the fact that other library v ariables drop out of the combined mo dels means that larger claims ab out the library’s v alue to researchers are not directly verified by this study . By eliminating effects purely related to institutional size, the per capita com bined mo dels provide the b est ov erall picture of the main link ages to grant funding. In that case, high lev els of research funding are asso ciated with the inputs most closely connected to the research itself: space, staffing, and do ctoral studen ts. In tw o of the six com bined mo dels (nominal and p er capita binary mo dels), the num b er of library v ariables included w ere limited, and did not comprise what w ould normally b e considered primary measures of activity such as exp enses, collection size, and staffing. In the remaining four of the six combined mo dels (the nominal 20 5.3 Conclusion and Extensions W omack, ARL Libraries and Research and p er capita linear and cumulativ e logit mo dels), measures of library activity do not hav e an y explanatory relationship to research funding in p er capita mo dels. • The fact that the library-v ariable only mo dels explain muc h less of the v ariation in research funding than the academic-v ariable mo dels (and the com bined models) also argues for a w eak relationship b etw een library strength, at least as curren tly measured, and researc h output. • The amount of research space av ailable is imp ortan t across all academic and combined mo dels. Since this is the most direct input into future research, this effect is not surprising. T o the exten t that research space is endogenous to grant funding success (with labs and facilities constructed by previous grants), its imp ortance as a predictor must b e temp ered. • Endowmen t and other size-related measures are imp ortant predictors in the nominal mo dels, but staffing v ariables, esp ecially in computing, science, and engineering (STEM supp ort), b ecome more significan t in the p er capita mo dels. • The n umber of researc h PhD’s granted is a significan t positive factor in most models, demon- strating researc h intensit y more effectiv ely than num b ers of faculty , master’s students, or other measures of academic activity . • Among regression metho ds, the linear mo dels are accurate, but may o verfit the data. By including to o many predictors, the nature of the effects of each predictor are less easily un- dersto o d. The categorical approaches simplify prediction and understanding of effects, and a void o v erfitting. The clm mo dels for multi-category data are midw ay in complexit y b etw een the binary mo dels and the linear regression mo dels, providing more meaningful and gran ular options for the resp onse v ariable while still yielding parsimonious v ariable selection. The final c hoice among these mo dels would dep end on the desired level of granularit y in the resp onse v ariable, research, versus the desire for a simpler explanatory mo del. F or many situations, the clm mo dels ma y pro vide the b est balance among these requirements. • The v ariables that are not selected for in any mo dels are also notable. T raditional measures of library strength suc h as the num b er of volumes held or num b er of unique titles do not app ear in the mo dels. New er measures such as e-b o oks held or search counts do not app ear, and neither do es the assistance offered by the library , as measured by instructional sessions or reference questions answered. While one may argue that these factors are related to student learning and success, this study do es not demonstrate that they are primary explanatory factors for success in obtaining research funding. 5.3 Conclusion and Extensions This study has gained some insight in to the correlates of researc h funding b y examining one measure of research funding and its explanatory v ariables in the limited p opulation of US ARL institutions at one p oint in time, 2012. By fo cusing directly on research output and considering a wide range of v ariables and mo deling approaches, this study pro vides broader understanding of the relation of v arious factors to high levels of grant funding. W eighing library v ariables alongside non-library v ariables is a sounder wa y of assessing library impact than lo oking at library measures in isolation. Ho wev er, in this case, we find only a few significan t library relationships to researc h. Logistic regression mo dels hav e not b een used in prior library literature to in vestigate such issues, and this study shows that categorical data representations of contin uous v ariables, used with logistic and 21 5.3 Conclusion and Extensions W omack, ARL Libraries and Research cum ulative logit mo deling, ha ve adv antages in producing simpler, easier to understand models with more significant main effects. The limited p opulation and single time perio d of study limit the generalizability of the findings presen ted here, but there are man y p oten tial extensions of this research. One direction of expansion would b e to study trends o ver time by lo oking at longitudinal data for c hanging causal relationships. Another direction would b e to lo ok at a wider selection of libraries. As mentioned in the in tro duction, the ARL institutions, while represen tative, are not a complete set of the ma jor research institutions. IPEDS has data on all academic libraries. While it is not as frequently collected or quite as comprehensive, it could b e used for library metrics from a muc h larger group of libraries. This data could also b e used to compare research funding correlates at smaller institutions. The most promising immediate extension of this research would b e to use the full detail presen t in the NCSES HERD surv ey , which con tains breakdowns of federal funding, funding by agency (such as NSF), and funding by sub ject discipline. NSF funding measures w ould represen t a broad base of general scien tific research, but w ould also a void some of the data issues mentioned in the in tro duction concerning the sometimes separate and sometimes merged medical researc h and library units in the mo dern univ ersity . Studying sp ecific disciplines would also reveal the unique c haracteristics of each. Also, the p er capita analysis in this pro ject conv erted only the resp onse v ariable to a p er capita basis. At the cost of generating many other v ariables to consider, one could conv ert many of the explanatory v ariables to a p er capita basis, suc h as library exp enditures p er facult y or research space p er faculty . These measures may generate mo dels with differen t implications. This is certainly w orth pursuing to pro vide a more thorough analysis. Other metho dological refinements to the regression mo dels presented here ma y pro duce more robust results. Those are all p ossible future directions for research. This study has taken an initial step in demonstrating that linear, logistic, and cum ulative logit mo dels, when com bined with a broad selection of data represen ting many asp ects of the academic enterprise can b e used to explain the correlates of researc h funding at US ARL institutions. 22 REFERENCES W omack, ARL Libraries and Research References [1] Alan Agresti. Cate goric al Data A nalysis . Wiley Series in Probabilit y and Statistics. Wiley , 3rd edition, 2013. [2] F rank R. Allen and Mark Dic kie. T ow ard a formula-based mo del for academic library funding: Statistical significance and implications of a mo del based up on institutional c haracteristics. Col le ge and R ese ar ch Libr aries , 68(2):170–182, Marc h 2007. doi:10.5860/crl.68.2.170 . [3] Asso ciation of Academic Health Sciences Libraries. Ann ual Statistics of Medical Sc ho ol Libraries in the United States and Canada, 2014. URL: http://www.aahsl.org/ annual- statistics . [4] Asso ciation of Researc h Libraries. ARL Statistics. Ann ual Library Statistics, 2012. URL: http://arlstatistics.org . [5] John M. Budd. F aculty publishing pro ductivity: Comparisons o v er time. Col le ge and R ese ar ch Libr aries , 67(3):230–239, May 2006. doi:10.5860 /crl.67.3.230 . [6] Rune Haub o Bo jesen Christensen. ordinal: Regression Mo dels for Ordinal Data, 2014. URL: http://cran.r- project.org/web/packages/ordinal/index.html . [7] Karen Coyle. T ec hnology and the return on in vestmen t. Journal of A c ademic Libr arianship , 32(5):537–539, September 2006. doi:10.1016/j.acalib.2006.06.007 . [8] Joanna Duy and Vincen t Lariviere. Relationships b etw een in terlibrary loan and research ac- tivit y in Canada. Col le ge and R ese ar ch Libr aries , 75(1):5–19, January 2014. doi:10.5860/ crl12- 378 . [9] Alb ert Henderson. The library collection failure quotient: The ratio of interlibrary b orrowing to collection size. Journal of A c ademic Libr arianship , 26(3):159–170, Ma y 2000. doi:10.1016/ S0099- 1333(00)00102- 6 . [10] Dean Hendrix. An analysis of bibliometric indicators, National Institutes of Health funding, and facult y size at Asso ciation of American Medical Colleges medical schools, 1997-2007. Journal of the Me dic al Libr ary Asso ciation , 96(4):324–334, Octob er 2008. doi:10.3163/1536- 5050. 96.4.007 . [11] Dean Hendrix. Relationships b etw een Asso ciation of Research Libraries (ARL) Statistics and bibliometric indicators: A principal components analysis. Col le ge and R ese ar ch Libr aries , 71(1):324–334, January 2010. doi:10.5860/crl.71.1.32 . [12] Elizab eth M. Mezic k. Return on inv estmen t: Libraries and student retention. Journal of A c ademic Libr arianship , 33(5):561–566, Septem b er 2007. doi:10.1016/j.acalib.2007.05. 002 . [13] Stephanie E. Mikitish and Marie L. Radford. Initial impressions: Inv estigating how future facult y v alue academic libraries. In A CRL 2013 Pr o c e e dings: April 10-13, 2013, Indianap olis, IN , pages 325–335, 2013. [14] Douglas C. Montgomery , Elizab eth A. Pec k, and G. Geoffrey Vining. Intr o duction to Line ar R e gr ession Analysis . Wiley Series in Probability and Statistics. Wiley , 4th edition, 2006. 23 REFERENCES W omack, ARL Libraries and Research [15] National Center for Education Statistics. In tegrated P ostsecondary Education Data System, 2014. URL: http://nces.ed.gov/ipeds/ . [16] National Science F oundation. National Cen ter for Science and Engineering Statistics. Science and Engineering Research F acilities: Fiscal Y ear 2011. Detailed Statistical T ables NSF 13-309, 2013. URL: http://www.nsf.gov/statistics/nsf13309/ . [17] National Science F oundation. National Center for Science and Engineering Statistics. Higher Education Researc h and Dev elopment Survey . Fiscal Y ear 2012, 2014. URL: http:// ncsesdata.nsf.gov/herd/2012/ . [18] P eter Peduzzi, John Concato, Elizab eth Kemp er, Theo dore R. Holford, and Alv an R. F einstein. A simulation study of the num b er of even ts p er v ariable in logistic regression analysis. Jour- nal of Clinic al Epidemiolo gy , 49(12):272–279, December 1996. doi:10.1016/S0895- 4356(96) 00236- 3 . [19] Krista M. Soria, Jan F ransen, and Shane Nack erud. Library use and undergraduate studen t outcomes: New evidence for studen ts’ retention and academic success. p ortal: Libr aries and the A c ademy , 13(2):147–164, 2013. doi:10.1353/pla.2013.0010 . [20] Carol T enopir. Measuring the v alue of the academic library: Return on inv estmen t and other v alue measures. The Serials Libr arian , 58:39–48, 2010. doi:10.1080/03615261003623005 . [21] Sharon W einer. The contribution of the library to the reputation of a univ ersity . Journal of A c ademic Libr arianship , 35(1):3–13, January 2009. doi:10.1016/j.acalib.2008.10.003 . [22] Ethelene Whitmire. Academic library p erformance measures and undergraduates’ library use and educational outcomes. Libr ary & Information Scienc e R ese ar ch , 24:107–128, September 2002. doi:10.1016/S0740- 8188(02)00108- 1 . 24 REFERENCES W omack, ARL Libraries and Research App endix on Data Cleaning While the data used is mostly presen ted as it app ears in the original data sources, there are some adjustmen ts made for consistency . F or some universities, NSF data for Health Sciences and Medical units are rep orted separately . If these units w ere in the same geographic lo cation as the main campus, their data w as added to the main campus totals. How ev er, 2012 is prior to the in tegration of Rutgers Universit y with the Univ ersity of Medicine and Dentistry of New Jersey (UMDNJ), so the UMDNJ data is not added to Rutgers. In order to remov e the p ossibilit y of having negative infinity as the result of a log transform, o ccurrences of “0” in the data were mo dified to “1”. The magnitudes of the v ariables w ere m uch higher across the b oard, with results in hundreds or thousands, so “1” can b e viewed as “almost zero” in this context. The Universit y of Colorado do es not rep ort endo wment separately by campus, so the endo wment of the Universit y of Colorado System including all branches is substituted. Since there are no other campuses in the system that riv al the history and research success of the Boulder campus, this is not likely to introduce m uch distortion. The IPEDS data classifies teachers into “instructional” and “researc h” teac hing staff, but the rep orted results are very inconsistent, with some institutions having no instructional and others ha ving no research staff, so these v ariables were not used in the analysis. In the ARL data, some data recorded as “0” actually app ears to b e missing, since it is unrea- sonable to think that at a large univ ersit y , there are no presen tations, reference transactions, PhD’s a warded, and so on. The entries that hav e b een conv erted to missing are summarized in T able 7. The v ariable for full text article requests has 11 institutions rep orting zero es. This is to o many missing v alues for our small data set, so we omit this v ariable from the analysis. In general, status v ariables (e.g., presence of a Hospital) are co ded “1” for y es, “0” for no. In addition, institutional con trol is co ded “0” for priv ate, “1” for public. 25 REFERENCES W omack, ARL Libraries and Research T able 1: Correlations (Sp earman’s rho) b et ween RDCA T, RDBIN, and RD RDCA T RDBIN RD RDCA T 1 0.8889726811 0.9658004777 RDBIN 0.8889726811 1 0.8585702401 RD 0.9658004777 0.8585702401 1 RDFED 0.9310306616 0.827193919 0.9664687693 RDNSF 0.6993151302 0.5897322164 0.7144836116 RDNSFMA TH 0.6417228031 0.5626362243 0.6464274781 region -0.0731276165 -0.0787972392 -0.0553181013 mem byr -0.5398608226 -0.4333554504 -0.5343527263 v ols 0.5646221133 0.5391022438 0.5825974026 illtot 0.4188450169 0.3244596837 0.4248237477 ilbtot 0.2902671333 0.2396009972 0.3144094001 grppres 0.3659092851 0.3897117848 0.3583211966 presptcp 0.3598719112 0.3865004228 0.361448242 reftrans 0.1733902042 0.1508249344 0.1784285229 initcirc 0.4558879977 0.4813412891 0.4799134199 prfstf 0.6227141892 0.5851857493 0.6309119265 nprfstf 0.5816411688 0.5341568057 0.6264055044 studast 0.2988348852 0.2828011591 0.3050653567 totstf 0.6527079425 0.6050956364 0.6760714085 totstfx 0.5823181777 0.5312762344 0.6018386529 explm 0.5662421434 0.5818881361 0.5912554113 salprf 0.6249410208 0.6039941805 0.6394557823 salnprf 0.584824465 0.5448070294 0.6352628324 salstud 0.3855671652 0.3971957008 0.3657513915 totsal 0.6516555093 0.6225347339 0.6798021027 op exp 0.5831339988 0.5512249133 0.5996413111 totexp 0.6487164033 0.6346574034 0.669598021 totstu 0.303291407 0.2959357555 0.2869635127 totpt -0.0081385702 0.0178274552 -0.0101793445 gradstu 0.6810465694 0.6703123137 0.7022016079 gradpt 0.0924249587 0.0948420614 0.1098206555 phda wd 0.549965402 0.4706506373 0.5672859281 phdfld 0.5503286746 0.4828899406 0.5447268809 fac 0.5337936162 0.5398186804 0.5552848193 expbibue 0.1000711344 0.0705293745 0.078584155 title 0.5214960154 0.453530459 0.5699319728 eb o oks 0.3064482246 0.3387216479 0.3232776747 exp onetime 0.4729862207 0.5159281474 0.4809847897 exp ongoing 0.5359050549 0.5095102437 0.5516219902 exp collsup 0.22845118 0.2267792546 0.2288453217 fulltextarticlerequests 0.4558011687 0.408169935 0.479992685 regsearc hes 0.1060937816 0.0985185015 0.1088300447 fedsearc hes 0.0123156003 0.0480469033 0.0323813389 RESSP ACE 0.7685969811 0.6146944551 0.7830475142 RESSP ACENEW 0.1246734965 0.1828950761 0.1465507821 26 REFERENCES W omack, ARL Libraries and Research T able 2: Correlations (Sp earman’s rho) b et ween RDCA T, RDBIN, and RD, contin ued RDCA T RDBIN RD LibrarianT enure -0.0512525736 -0.0329449774 -0.0200976469 Researc htotalexp 0.9105849852 0.8129319549 0.9491280148 Researc hsalaries 0.9181024372 0.8115057585 0.9525541126 Researc hfringeb enefits 0.8849938074 0.7872628538 0.920305876 Researc hplantmain tops 0.6971850576 0.6225424339 0.748320944 Researc hdepreciation 0.7619328156 0.7002624383 0.8043661101 Researc hinterest 0.4726724887 0.3689228259 0.4828765275 Researc hother 0.8563427914 0.7808425356 0.8956091528 Endo wment 0.5127811499 0.5497987169 0.5357823129 AA U 0.6416256311 0.6034053156 0.661042037 InstCon trol -0.0512941955 -0.1114064093 -0.0617344098 Hospital 0.1230363617 0.0429989469 0.1392101775 MedicalDegree 0.3611610595 0.2620635907 0.3658730159 LandGran t 0.1440141434 0.1152780835 0.1342151924 Masters 0.492596019 0.5045247812 0.5113870036 PHDResearc h 0.7836176143 0.6931400295 0.8054706923 PHDProfPractice 0.3247344129 0.2870744056 0.3460309762 FTNoninsstaffno 0.7119990299 0.6328766148 0.739958998 FTNoninsstaffexp 0.7378692854 0.6688861173 0.7683487941 LibCurArc hotherno 0.4650582831 0.4164557911 0.448881399 LibCurArc hotherexp 0.503169825 0.4563828519 0.498008658 Managemen tno 0.2939384652 0.2570766728 0.3413359556 Managemen texp 0.4122048144 0.3779420492 0.4630179344 BusFinOpsno 0.5922102008 0.5790446958 0.5945175405 BusFinOpsexp 0.6185953693 0.6182561446 0.6181818182 CompEngScino 0.6358132868 0.574049381 0.6723933741 CompEngSciexp 0.6951337877 0.6503455639 0.731886209 CommServLegalArtsMediano 0.4175081258 0.3512128127 0.3912439819 CommServLegalArtsMediaexp 0.4577559696 0.4143113388 0.4380161967 Healthcareno 0.4651507602 0.362997294 0.4679116702 Healthcareexp 0.507293538 0.4100314685 0.5119233148 Serviceno 0.4874173791 0.4817037962 0.5040322082 Serviceexp 0.531875734 0.5120045119 0.5353123067 Salesno -0.0685108102 -0.0051171511 -0.0936441676 Salesexp -0.0503669937 0.0043852461 -0.0777981866 OfficeA dminno 0.5271968007 0.4578217893 0.5579437896 OfficeA dminexp 0.569719125 0.5091521191 0.5932467532 NatResourcesConstrMain tno 0.4353582068 0.3647677795 0.4303490592 NatResourcesConstrMain texp 0.5436641744 0.4813412891 0.5396165739 Pro dT ransMatsno 0.1862931998 0.1840704273 0.2187291445 Pro dT ransMatsexp 0.2034116812 0.1890411828 0.2323806149 T otalFTEstaff 0.8092082396 0.7259339738 0.8413729128 T eachersFTEstaff 0.7988462679 0.7245122579 0.8241547567 Lib curarc hteac hingotherinstrsupp ortFTE 0.4589170781 0.3997001961 0.4427183026 27 REFERENCES W omack, ARL Libraries and Research T able 3: Correlations (Sp earman’s rho) b et ween RDCA T, RDBIN, and RD, contin ued RDCA T RDBIN RD LibrCurArc hFTE 0.5052655179 0.480681702 0.5266572688 teac hingotherinstrsupp ortFTE 0.3056217666 0.2375285491 0.2739175325 Mgm tFTE 0.3528027382 0.3130539845 0.3998812602 BusFinOpsFTE 0.6697807468 0.6610522574 0.675149585 CompEngSciFTE 0.7512911286 0.6892158096 0.7940395242 CommServLegalArtsMediaFTE 0.460840251 0.3747481717 0.4390219771 HealthcareFTE 0.4835030079 0.3865075937 0.5071785723 AllService...FTE 0.646413221 0.5804637346 0.6712327496 ServiceFTE 0.5725941251 0.5394738063 0.5816612091 SalesFTE -0.0725110512 -0.0040046314 -0.1038296878 OfficeA dminFTE 0.5989959315 0.5291254135 0.6295748866 NatResourceConstMain tFTE 0.5249189714 0.439292946 0.5236098492 Pro dT ransMo vingFTE 0.2304365029 0.223669742 0.2460122333 28 REFERENCES W omack, ARL Libraries and Research T able 4: Library-related v ariables from the ARL Statistics Abbreviation Description v ols volumes in Library illtot titles loaned to other libraries ilbtot titles b orro wed from other libraries grppres group presentations presptcp presen tation participants reftrans reference transactions initcirc initial circulation of b o oks (not counting renew als) prfstf professional staff (librarians) nprfstf non-professional staff (supp ort) studast studen t assistants totstf total staff (librarians+supp ort) totstfx total staff (inc. students) explm total materials exp enditures salprf professional salaries salnprf non-professional salaries salstud student salaries totsal total salaries op exp op erating exp enditures totexp total expenditures totstu total studen ts (at Universit y) gradstu graduate students (at Universit y) phda wd PhDs aw arded phdfld fields of PhD study fac total teaching facult y title n umber of unique titles held b y library eb o oks eb o oks exp onetime one-time resource exp enditures exp ongoing ongoing resource exp enditures exp collsup collection supp ort exp enditures 29 REFERENCES W omack, ARL Libraries and Research T able 5: Academic v ariables from NCSES, IPEDS abbreviation description source RD total research funding aw arded HERD RDCA T 4-category research rank constructed RDBIN 2-category research rank constructed Rdp c researc h funding per faculty member constructed RDCA T p c 4-category rank based on p er capita data constructed RDBINp c 2-category rank based on p er capita data constructed RESSP ACE researc h space SSEF RESSP ACENEW newly constructed research space SSEF Endo wment v alue of endo wment IPEDS AA U mem b er of AAU (Y es=1) IPEDS InstCon trol public or priv ate (Public=1) IPEDS Hospital hospital at universit y (Y es=1) IPEDS MedicalDegree medical degree granted (Y es=1) IPEDS LandGran t land-gran t universit y (Y es=1) IPEDS Masters n u m b er of Master’s granted IPEDS PHDResearc h num b er of research PhD’s granted IPEDS PHDProfPractice num b er of PhD’s of professional practice IPEDS FTNoninsstaffno full-time non-instructional staff, num b er IPEDS FTNoninsstaffexp full-time non-instructional staff, exp ense IPEDS LibCurArc hotherno librarians, curators, and archivists, num b er IPEDS LibCurArc hotherexp librarians, curators, and archivists, exp ense IPEDS Managemen tno management staff, num b er IPEDS Managemen texp management staff, exp ense IPEDS BusFinOpsno business, finance, and operations staff, num b er IPEDS BusFinOpsexp business, finance, and op erations staff, exp ense IPEDS CompEngScino computing, engineering, and scien tific staff, n umber IPEDS CompEngSciexp computing, engineering, and scientific staff, exp ense IPEDS CommServLegalArtsMediano comm unication services, legal, arts, media staff, num b er IPEDS CommServLegalArtsMediaexp comm unication services, legal, arts, media staff, expense IPEDS 30 REFERENCES W omack, ARL Libraries and Research T able 6: Academic v ariables from NCSES, IPEDS, contin ued abbreviation description source Healthcareno healthcare staff, num b er IPEDS Healthcareexp healthcare staff, exp ense IPEDS Serviceno service staff, num b er IPEDS Serviceexp service staff, exp ense IPEDS OfficeA dminno office administrative staff, num b er IPEDS OfficeA dminexp office administrative staff, exp ense IPEDS NatResourcesConstrMain tno natural resources, construction, and maintenance, num b er IPEDS NatResourcesConstrMain texp natural resources, construction, and maintenance, expense IPEDS Pro dT ransMatsno pro duction, transportation, and moving, n umber IPEDS Pro dT ransMatsexp pro duction, transportation, and moving, expense IPEDS T otalFTEstaff total staff in FTE (full-time equiv alent) IPEDS T eachersFTEstaff total teachers, FTE IPEDS Libcurarchteac hingotherinstrsupp ortFTE librarians, curators, and archivists, n umber IPEDS LibrCurArc hFTE librarians, curators, and archivists, FTE IPEDS teac hingotherinstrsupp ortFTE librarians, curators, and archivists, num b er IPEDS Mgm tFTE managemen t staff, FTE IPEDS BusFinOpsFTE business, finance, and op erations staff, FTE IPEDS CompEngSciFTE computing, engineering, and scientific staff, FTE IPEDS CommServLegalArtsMediaFTE comm unication services, legal, arts, media staff, FTE IPEDS HealthcareFTE healthcare staff, FTE IPEDS AllServiceinclsalesofficeadminconstrmaintprodtransFTE all service categories combined, FTE IPEDS ServiceFTE service staff, FTE IPEDS OfficeA dminFTE office administrative staff, FTE IPEDS NatResourceConstMain tFTE natural resources, construction, and main tenance, FTE IPEDS Pro dT ransMovingFTE production, transp ortation, and moving, FTE IPEDS T able 7: Library “Zero” data conv erted to Missing v ariable Institutions group presentation W ashington State group pres. participants W ashington State reference transactions Rice, Maryland, Pennsylv ania, Wisconsin studen t assistan ts Harv ard* Ph.D’s aw arded W ashington State titles (# in library) Pittsburgh one-time exp enses Cornell, Georgetown ongoing exp enses Cornell, Georgetown collection supp ort exp enses Cornell, Georgetown, Georgia T ech, UC-San Diego, UC-San ta Barbara *Harvar d Libr ary website do es note student employment 31
Original Paper
Loading high-quality paper...
Comments & Academic Discussion
Loading comments...
Leave a Comment