Machine Learning Across Cultures: Modeling the Adoption of Financial Services for the Poor
Recently, mobile operators in many developing economies have launched "Mobile Money" platforms that deliver basic financial services over the mobile phone network. While many believe that these services can improve the lives of the poor, a consistent…
Authors: Muhammad Raza Khan, Joshua E. Blumenstock
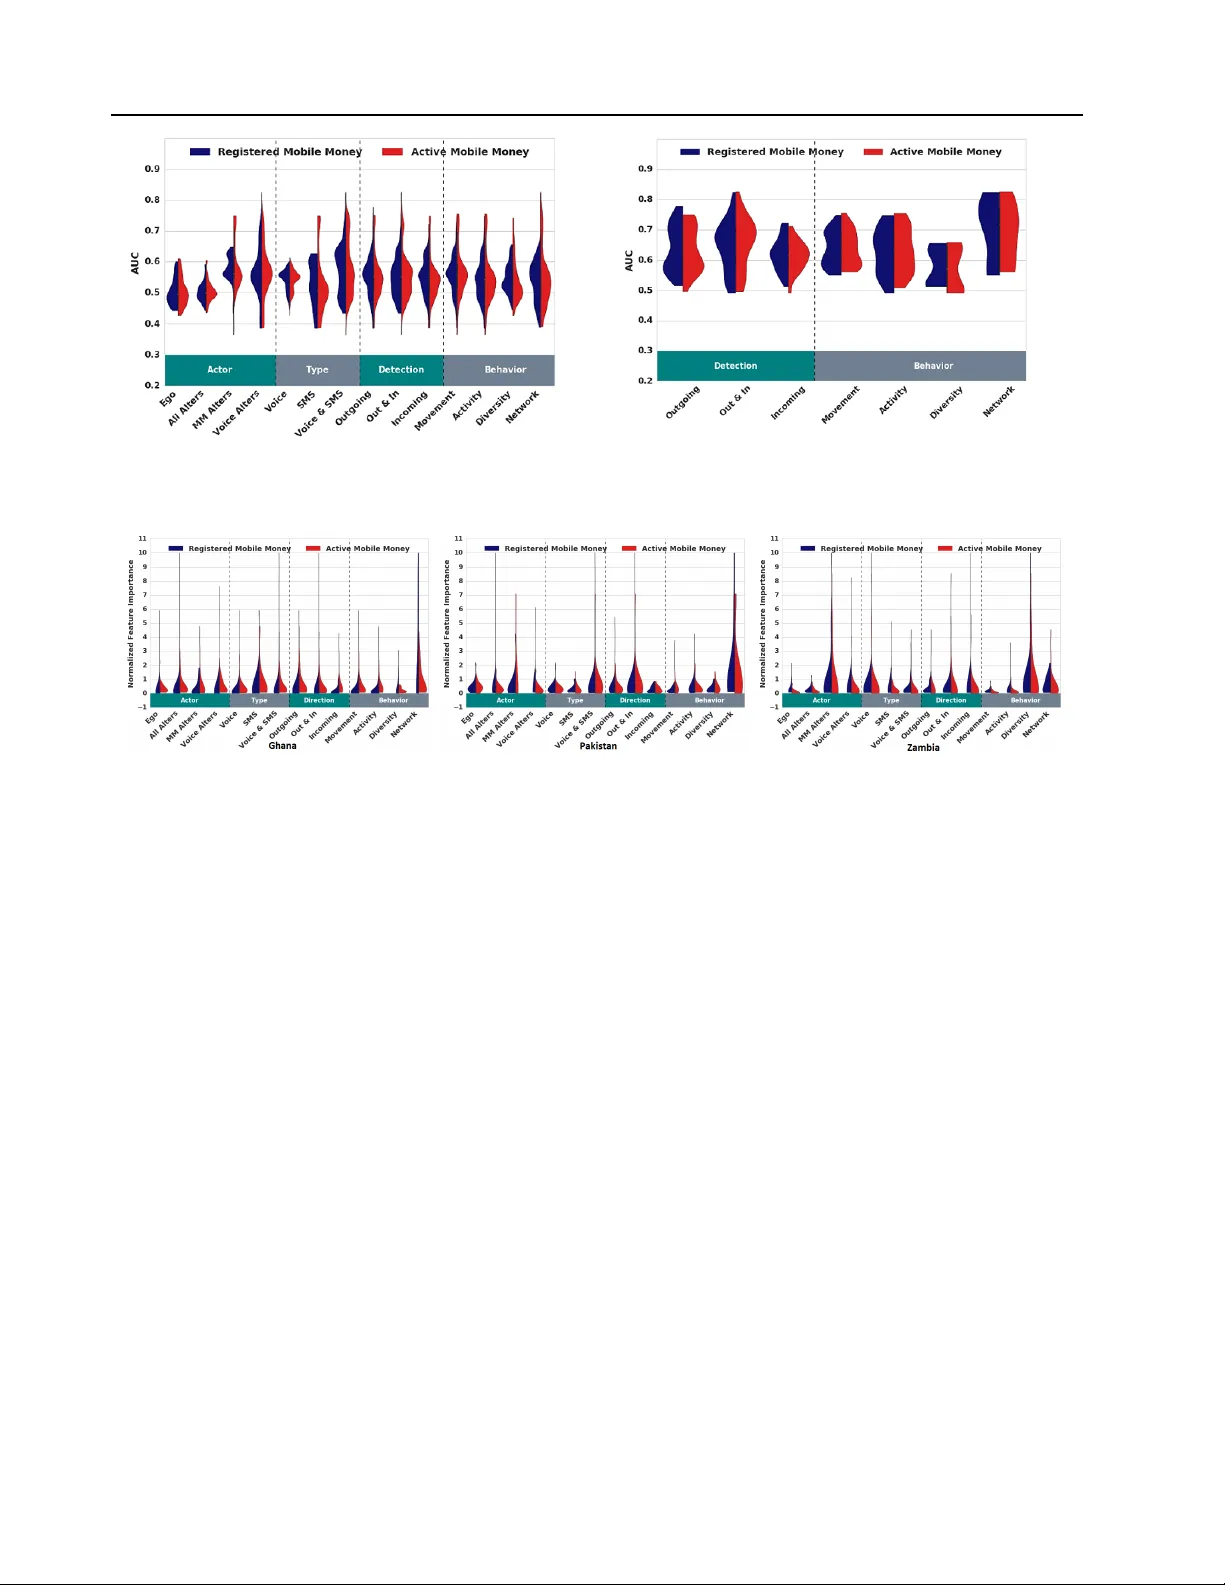
Machine Learning Acr oss Cultur es: Modeling the Adoption of Financial Services f or the P oor Muhammad Raza Khan M R A Z A @ U W . E D U Univ ersity of W ashington, Seattle, W A 98195 USA Joshua E Blumenstock J O S H B L U M @ U W . E D U Univ ersity of W ashington, Seattle, W A 98195 USA Abstract Recently , mobile operators in many de veloping economies have launched “Mobile Money” plat- forms that deliv er basic financial services over the mobile phone network. While many belie ve that these services can improve the li ves of the poor , a consistent difficulty has been identifying individuals most likely to benefit from access to the new technology . Here, we combine terabyte- scale data from three different mobile phone operators from Ghana, Pakistan, and Zambia, to better understand the behavioral determinants of mobile money adoption. Our supervised learning models provide insight into the best predictors of adoption in three very distinct cultures. W e find that models fit on one population fail to generalize to another, and in general are highly context-dependent. These findings highlight the need for a nuanced approach to understanding the role and potential of financial services for the poor . 1. Introduction Billions of people around the world liv e without access to formal financial institutions. Over the last sev eral years, mobile phone operators across the globe ha ve launched “Mobile Money” platforms, which mak e it possible for many of the world’ s poor to conduct basic financial trans- actions from ine xpensive feature phones. Ho wever , outside of Ken ya and a few other countries, worldwide adoption of Mobile Money has been extremely anemic. The vast majority of deployments have struggled to promote sus- tained product adoption, and an industry report from 2014 2016 ICML W orkshop on #Data4Good: Machine Learning in Social Good Applications , Ne w Y ork, NY , USA. Copyright by the author(s). estimates that 66% of registered customers were inactiv e (Scharwatt et al., 2014). An open and important question thus revolv es around understanding what driv es customers to adopt and use Mobile Money , and whether patterns observed in one country will generalize to another . Our work builds on se veral distinct strands in the academic literature. The first strand that is concerned with under- standing the determinants of mobile money adoption has historically been the domain of dev elopment researchers, and includes both macroeconomic studies (Mas & Rad- cliffe, 2011; Dermish et al., 2011; Donov an, 2012) as well as qualitati ve, ethnographic work (Morawczynski, 2009; Medhi et al., 2009; Etim, 2014). A second strand of literature seeks to deriv e general insights from mobile phone transactions logs. This encompasses a wide array of applications, including predicting the socioeconomic status (Blumenstock et al., 2015), gender (Frias-Martinez et al., 2010), and age (Dong et al., 2014) of individual mobile phone users. Most rele v ant to this study , a third area of prior work mines digital transactions logs to model the social and behavioral determinants of product adoption (Ugander et al., 2012; Leskov ec et al., 2007), with a few recent papers written in the context of mobile phone data (Khan et al., 2015; Sundsøy et al., 2014; CGAP, 2013). Relativ e to these studies, our study moves this literature forward by (a) innov ating in the method used to generate features, thereby providing a systematic and comprehensi ve approach to fea- ture engineering; (b) leveraging data from three different contexts to calibrate the external validity and generaliz- ability of our results; and (c) carefully articulating the experiments in a way that will enable other researchers to replicate and extend these methods. 2. Data and Context The data that we hav e used in this project consists of anonymized Call Detail Records (CDR) and Mobile Money 6 Modeling the Adoption of Financial Services f or the Poor T ransaction Records (MMTR) of all the subscribers from three different operators in Ghana, Pakistan, and Zambia. All three countries rank in the bottom third of the Hu- man Dev elopment Index and Financial Inclusion Index as shown in T able 1. The CDR and MMTR contain basic metadata on ev ery ev ent that occurs on the mobile phone network, including phone calls, text messages, and any form of Mobile Money activity . In total, the original data contains billions of transactions conducted by tens of millions of unique individuals. Each dataset spans several months of activity , which we divide into a “training” period and an “ev aluation” period. CDR from a 10-day training period was used to engineer features and fit a predictiv e model, where the target variables (based on Mobile Money acti vity) were measured in a subsequent 3-month ev aluation period. Based on activity during the ev aluation period, each subscribers is categorized as a “V oice Only User” (no MM activity), a “Re gistered Mobile Money User” (one or more MMTR’ s), or an “ Active Mobile Money User” (at least one MMTR in each month). Country Ghana Pakistan Zambia P anel A: National statistics (Sour ce: W orld Bank) Population 25.90 Million 185.00 Million 15.72 Million GDP PPP adjusted $4081.70 $4811.4 $3904.00 Mobile accounts per 100 users 115 73 67 Adults without financial services 59.49% 54.36% 86.97% P anel B: Mobile phone use (Sour ce: Call Detail Records) Calls per user per day 6.53 (6.99) 7.76 (10.25) 10.26 (102.86) SMS per user per day 3.10 (100.36) 38.71 (80.83) 10.88 (262.81) No. of unique contacts 21.66 (24.91) 46.93 (139.67) 17.63 (328.63) No. of unique towers 12.98 (16.07) 24.15 (57.30) 7.35 (17.56) Notes : Standard deviations reported in parenthesis. T able 1. Summary statistics by country 3. Featur e Engineering The most common approach to constructing interpretable metrics (“features”) from the phone data is to hand-craft a small number of features that correspond to some intuition of the researcher . For instance, (Dong et al., 2014) focus on 5 topological properties of the static social network. In con- trast, we employ a deterministic finite automaton (DF A), to formalize the feature generation process (McCulloch & Pitts, 1943; Blumenstock et al., 2015). W e use the DF A to specify a set of legal operations that can be recursiv ely applied to raw transactional data in order to produce valid features. The DF A we use to generate features from CDR is shown in Figure 1 (see also Algorithm 1). T o interpret the set of features produced by the DF A, we map each feature onto the tree structure as sho wn in Figure 2, where each branch of the tree partitions the data into features that capture dif ferent beha vioral characteristics of the subscriber . Algorithm 1 Feature Generation Algorithm Data : cdr (Call Detail Records of all users) Data : opmap (Dictionary of possible operations) Result : Features Step 1: Perform reduce by grouping only on ego for each ty pe , dir 1 in cdr ty pes , direction do f ilter edC D R ← cdr .filter( type , dir 1 ) for each f ield in cdr do g roupeddata ← f ilter edC D R .map([ eg o ] +[combinations( f ield ])) for each op in opmap [ f ield ] do r educeddata ← g roupeddata .reduce( op ) insert r educeddata in f eatur esArr ay r educedata 2 ← r educeddata .map( ego , alter s ).reduce( op ) insert reduceddata 2 in f eatur esArr ay end end end 4. Results Using the features generated by DF A 3 our ne xt steps were to (a) build a predictiv e model that can be used to identify likely adopters, (b) use these features to understand the determinants of Mobile Money use, and (c) determine the extent to which models and features from one context can generalize to another . 4.1. Predicting Mobile Money Use W e use a v ariety of supervised learning algorithms to attempt two classification tasks: V oice Only vs. Registered User , and V oice Only vs. Activ e User . For this task, we drew a stratified random sample of 10,000 subscribers from each of the three user types from each of the three coun- tries. Here, we focus on the results from gradient boosting (Friedman, 2001), which mar ginally outperformed other common classifiers including logistic regression, svm, and so forth. As shown in the Figure 3, the gradient boosting with DF A based features significantly outperforms the naiv e baseline, and we achiev e marginally better success in identifying Activ e Mobile Money users than Registered Mobile Money users in all of the countries. W e will return to the interpretation of these results in Section 5. 4.2. Determinants of Mobile Money Adoption T o inv estigate the prominant denominators of Mobile Money adoption, we calculate the A UC from a biv ariate 7 Modeling the Adoption of Financial Services f or the Poor Figure 1. Deterministic Finite Automaton Figure 2. Tree-based feature classification Figure 3. Model Accuracy . Left figure shows accuracy in identifying Mobile Money users within each country; Right figure shows Accuracy when model is trained in one country and e valuated in another. logistic regression of the response variable on each individual feature. W e also calculate the normalized featur e importance (NFI) as the relati ve significance of each feature in the final gradient boosting classifier operating on all of the features. The distribution of unconditional A UC values for all the features generated through the methods explained in sec- tion 3 is shown in Figure 4 (left panel), using Ghana as a test case. Each violin plot shows the distribution of A UC values for all features of a giv en type - such as all “ego” features, or all “movement” features. While a large number of features have A UC values near 0.5, there are a small number of highly predictive features with A UC ≥ 0.75. The right panel of Figure 4 shows the distribution of A UC v alues for the subset of features related to the subscriber’ s first degree network (Actor=“V oice Alters” and T ype=“ All”), a subset that is generally more predictiv e of Mobile Money use in Ghana. Here, the range of A UC values is significantly higher than in the full set of features, and some sub-classes such as “Network”, which capture the structure of the subscriber’ s first degree network, ha ve uniformly high predictiv e power . Figure 5 shows the NFI distribution obtained through gradient boosting model operating on all of the features. Just like unconditional ranking, each class of features in this case also contains a mass of features with low predictiv e power , but perhaps most striking in Figure 5 are the differences between countries in the relati ve importance of each class of features. 4.3. Learning Across Cultures? Our standardized methods and analysis performed across all three countries. This makes it possible to answer a question that has been elusiv e in prior studies of the adoption of new technologies in dev eloping countries: Do the behavioral determinants of adoption identified in one context generalize to another? Based on the analysis we hav e performed, our short answer to this question appears to be, “No. ” The right panel of Figure 3 shows the performance of a classifier trained in one country and ev aluated in another . 8 Modeling the Adoption of Financial Services f or the Poor Figure 4. Distrib ution of A UC v alues for each feature category . Left figure sho ws all features in Ghana; Right figure sho ws the subset of features in Ghana where Actor=‘V oice Alters’ and T ype=‘ All’ Figure 5. Normalized feature importance The first set of six bars shows that the classifiers trained in Ghana perform well in Ghana (the first two grey bars), replicating the results in Figure 3. Howe ver , that same Ghana model does quite poorly when ev aluated in Zambia (the next two blue bars) or Pakistan (the final two green bars). While it is almost certain that a more sophisticated approach to transductive transfer learning would perform better (Pan et al., 2011), the naive application of a model out of context is quite inef fectiv e. 5. Discussion and Conclusions T aken in the broader conte xt of research into the deter- minants of Mobile Money adoption, the preceding results uncov er se veral unexpected patterns.It is not surprising that classifiers using CDR-data can predict Mobile Money use. Howe ver , we were surprised to find that the supervised model was only marginally better able to identify Activ e Mobile Money users than Registered Mobile Money users. Since true financial inclusion requires active use, this remains an important topic for future work. Also interesting are the differences in performance of the same modeling approach applied in different contexts. Most striking here is the relativ ely poor performance in Pakistan, where the 18% improvement over the baseline is dwarfed by the 55% improvement over the baseline achiev ed in Ghana. W e believe this may also in part be an artifact of the “one size fits all” approach we have taken to standardizing definitions and methods across countries. In particular , there is one type of Mobile Money transaction that is extremely common in Pakistan, which allows a subscriber to add prepaid phone credit to her phone account using Mobile Money . Anecdotally , it is common practice in Pakistan for the retailers of phone credit to perform this Mobile Money transaction on behalf of the subscriber . This potential source of bias highlights the brittle nature of the cross-country analysis, which in its current form does not allow for country-specific adaptation. Most importantly , our results suggest that across different countries in the dev eloping world, no single set of be- havioral features is likely to consistently predict Mobile Money adoption and use. For policymakers interested in promoting the growth of mobile-based financial services, this indicates that the details of the local context will be critical in achie ving sustained adoption and use of financial services for the poor . 9 Modeling the Adoption of Financial Services f or the Poor References Blumenstock, Joshua, Cadamuro, Gabriel, and On, Robert. Predicting poverty and wealth from mobile phone metadata. Science , 350(6264):1073–1076, 2015. CGAP . The Power of Social Networks to Driv e Mobile Money Adoption. T echnical report, 2013. Dermish, Ahmed, Kneiding, Christoph, Leishman, P aul, and Mas, Ignacio. Branchless and mobile banking solutions for the poor: A survey of the literature. Innovations: T echnology , Governance , Globalization , 6(4):81–98, October 2011. ISSN 1558-2477. doi: 10 . 1162 / INO V a 00103. URL http : / / dx . doi . org/10.1162/INOV_a_00103 . Dong, Y uxiao, Y ang, Y ang, T ang, Jie, Y ang, Y ang, and Chawla, Nitesh V . Inferring user demographics and social strategies in mobile social networks. In Pr oceedings of the 20th A CM SIGKDD international confer ence on Knowledge discovery and data mining , pp. 15–24. A CM, 2014. Donov an, Ke vin. Mobile money for financial inclusion. Information and Communications for Development, pp. 61–73. The W orld Bank, 2012. ISBN 978-0-8213-8991- 1. URL http : / / elibrary . worldbank . org / doi/abs/10.1596/9780821389911_ch04 . Etim, Alice S. Mobile banking and mobile money adoption for financial inclusion. Resear ch in Business and Economics Journal , 9:1, 2014. Frias-Martinez, V anessa, Frias-Martinez, Enrique, and Oliv er , Nuria. A gender -centric analysis of calling behavior in a developing economy using call detail records. 2010. Friedman, Jerome H. Greedy function approximation: a gradient boosting machine. Annals of statistics , pp. 1189–1232, 2001. Khan, Muhammad Raza, Manoj, Joshua, Singh, Anikate, and Blumenstock, Joshua. Behavioral modeling for churn prediction: Early indicators and accurate predictors of custom defection and loyalty . In 2015 IEEE International Congr ess on BigData , pp. 677–680. IEEE, 2015. Leskov ec, Jure, Adamic, Lada A, and Huberman, Bernardo A. The dynamics of viral marketing. A CM T ransactions on the W eb (TWEB) , 1(1):5, 2007. Mas, Ignacio and Radcliffe, Dan. Scaling mobile money . J ournal of P ayments Strate gy & Systems , 5 (3):298–315, 2011. URL http ://henrystewart. metapress . com/ index / 2771530377482470 . pdf . McCulloch, W arren S. and Pitts, W alter . A logical calculus of the ideas immanent in nervous activity . The bulletin of mathematical biophysics , 5(4):115–133, December 1943. ISSN 0007-4985, 1522-9602. doi: 10 . 1007 / BF02478259. URL http : / / link . springer . com/article/10.1007/BF02478259 . Medhi, Indrani, Ratan, Aishwarya, and T oyama, Kentaro. Mobile-banking adoption and usage by low-literate, low-income users in the dev eloping world. In Internationalization, Design and Global Development , pp. 485–494. Springer , 2009. Morawczynski, Olga. Exploring the usage and impact of “transformational” mobile financial services: the case of m-PESA in ken ya. Journal of Eastern African Studies , 3 (3):509–525, October 2009. ISSN 1753-1055. doi: 10 . 1080/17531050903273768. Pan, Sinno Jialin, Tsang, I.W ., Kwok, J.T ., and Y ang, Qiang. Domain Adaptation via T ransfer Component Analysis. IEEE T ransactions on Neural Networks , 22 (2):199–210, February 2011. ISSN 1045-9227. doi: 10.1109/TNN.2010.2091281. Scharwatt, Claire, Katakam, Arunjay , Frydrych, Jennifer , Murphy , Alix, and Naghavi, Nika. State of the Industry: Mobile Financial Services for the Unbanked. T echnical report, GSMA, 2014. URL http :/ /www . gsmamobileeconomy .com / GSMA_ ME _ Report _ 2014_R2_WEB.pdf . Sundsøy , P ˚ al, Bjelland, Johannes, Iqbal, Asif M, de Mon- tjoye, Yv es-Alexandre, et al. Big data-driv en marketing: How machine learning outperforms marketers’ gut- feeling. In Social Computing, Behavioral-Cultur al Modeling and Pr ediction , pp. 367–374. Springer , 2014. Ugander , Johan, Backstrom, Lars, Marlow , Cameron, and Kleinberg, Jon. Structural div ersity in social contagion. Pr oceedings of the National Academy of Sciences , 109 (16):5962–5966, 2012. 10
Original Paper
Loading high-quality paper...
Comments & Academic Discussion
Loading comments...
Leave a Comment