Characterizing Diseases from Unstructured Text: A Vocabulary Driven Word2vec Approach
Traditional disease surveillance can be augmented with a wide variety of real-time sources such as, news and social media. However, these sources are in general unstructured and, construction of surveillance tools such as taxonomical correlations and…
Authors: Saurav Ghosh, Prithwish Chakraborty, Emily Cohn
Characterizing Diseases fr om Unstructured T e xt: A V ocab ulary Driven W ord2vec Appr oac h Saurav Ghosh 1, * , Prithwish Chakraborty 1 , Emily Cohn 2 , John S. Bro wnstein 2,3 , and Naren Ramakrishnan 1 1 Depar tment of Computer Science, Virginia T ech, Arlington, Vriginia, USA, 2 Children’ s Hospital Inf ormatics Program, Boston Children’ s Hospital, Boston, Massachusetts, USA, 3 Depar tment of P ediatrics, Harvard Medical School, Boston, Massachusetts, USA. * saura vcsvt@vt.edu ABSTRA CT T raditional disease surveillance can be augmented with a wide variety of real-time sources such as, news and social media. Howe v er , these sources are in general unstructured and, constr uction of sur veillance tools such as taxonomical correlations and trace mapping inv olves considerable human super vision. In this paper , we motivate a disease vocab ular y driven word2v ec model ( Dis2V ec ) to model diseases and constituent attr ib utes as word embeddings from the HealthMap news cor pus. W e use these word embeddings to automatically create disease taxonomies and ev aluate our model against corresponding human annotated taxonomies. We compare our model accuracies against sev eral state-of-the ar t word2v ec methods. Our results demonstrate that Dis2V ec outperforms traditional distributed vector representations in its ability to faithfully capture taxonomical attributes across different class of diseases such as endemic, emerging and rare. 1 Introduction T raditional disease surveillance has often relied on a multitude of reporting networks such as outpatient networks, on-field healthcare workers, and lab-based netw orks. Some of the most effecti ve tools while analyzing or mapping diseases, especially for ne w diseases or disease spreading to ne w re gions, are reliant on b uilding disease taxonomies which can aid in early detection of outbreaks. In recent years, the ready av ailability of social and ne ws media has led to services such as HealthMap 7 which ha ve been used to track se veral disease outbreaks from ne ws media ranging from the flu to Ebola. Ho we ver , most of this data is unstructured and often noisy . Annotating such corpora thus requires considerable human oversight. While significant information about both endemic 4 , 22 and rare 19 diseases can be e xtracted from such ne ws corpora, traditional text analytics methods such as lemmatization and tokenization are often shallo w and do not retain suf ficient contextual information. More inv olved methods such as topic models are too computationally expensi ve for real-time worldwide surveillance and do not provide simple semantic contexts that could be used to comprehend the data. In recent years, several deep learning based methods, such as word2vec and doc2vec, hav e been found to be promising in analyzing such te xt corpora. These methods once trained ov er a representativ e corpus can be readily used to analyze ne w text and find semantic constructs (e.g. rabies : zoonotic = salmonella : foodborne ) which can be useful for automated taxonomy creation. Classical word2vec methods are generally unsupervised requiring no domain information and as such has broad applicability . Howe ver , for highly specified domains (such as disease surveillance) with moderate sized corpus, classical methods fail to find meaningful semantic relationships. For e xample, while determining the transmission method of salmonella giv en that rabies is zoonotic (i.e. querying rabies : zoonotic = salmonella :??), traditional word2v ec methods such as skip-gram model trained on the HealthMap corpus fail to find a meaningful answer ( saintpaul ). Motiv ated by this problem, in this paper we postulate a vocab ulary dri ven word2v ec algorithm that can find meaningful disease constructs which can be used tow ards such disease knowledge e xtractions. For e xample, for the aforementioned task, vocab ulary-driv en word2vec algorithm generates the word foodborne , which is more meaningful in the context of disease knowledge e xtraction. Our main contrib utions are: • W e formulate Dis2V ec , a vocab ulary dri ven word2v ec method which is used to generate disease specific word embeddings from unstructured health-related ne ws corpus. Dis2V ec allows domain kno wledge in the form of pre-specified disease-related vocab ulary V to supervise the discov ery process of word embeddings. • W e use these disease specific word embeddings to generate automated disease taxonomies that are then e valuated against Symptoms Exposures T r ans mi ss ion A ge nts T r ans mi ss ion M et hod 0 . 9 8 0 . 6 8 0 . 9 4 0 . 9 7 0 . 9 3 0 . 6 3 0 . 8 6 0 . 4 1 0 . 9 5 0 . 6 7 0 . 7 8 0 . 5 2 E m e r g i n g E n d e m i c R a r e Figure 1. Comparative performance e v aluation of disease specific word2vec model ( Dis2V ec ) across the disease characterization tasks for 3 different class of diseases - endemic (blue), emer ging (red) and rare (green). The ax es along the four vertices represent the modeling accurac y for the disease characterization of interest viz. symptoms, transmission agents, transmission methods, and exposures. The area under the curve for each disease class represent the corresponding ov erall accuracy o ver all the characterizations. Best characterization performance can be seen for emer ging diseases. human curated ones for accuracies. • Finally , we ev aluate the applicability of such word embeddings ov er different class of diseases - emer ging, endemic and rare for different taxonomical characterizations. Pre view of our results: In Figure 1 , we provide a comparative performance ev aluation of Dis2V ec across the disease characterization tasks for endemic, emerging and rare diseases. It can be seen that Dis2V ec is best able to characterize emerging diseases. Specifically , it is able to capture symptoms, transmission methods and transmission agents, with near -perfect accuracies for emer ging diseases. Such diseases (e.g. Ebola, H7N9) draw considerable media interest due to their unkno wn characteristics. Ne ws articles reporting emer ging outbreaks tend to focus on all characteristics of such diseases - symptoms, exposures, transmission methods and transmission agents. Ho wev er , for endemic and rare diseases, transmission agents and exposures are better understood, and ne ws reports tend to focus mainly on symptoms and transmission methods. Dis2V ec can still be applied for these class of diseases but with decreased accurac y for these under-represented characteristics. 2 Related W ork The related works of interest for our problem are primarily from the field of neural-network based word embeddings and their applications in a variety of NLP tasks. In recent years, we hav e witnessed a tremendous surge of research concerned with representing words from unstructured corpus to dense low-dimensional vectors drawing inspirations from neural-network language modeling. 3 , 5 , 15 These representations, referred to as wor d embeddings , hav e been sho wn to perform with considerable accuracy and ease across a v ariety of linguistic tasks. 1 , 6 , 20 Mikolov et al. 12 , 13 proposed skip-gram model, currently a state-of-the-art word embedding method, which can be trained 2/ 15 using either hierarchical softmax (SGHS) 13 or the negati ve sampling technique (SGNS). 13 Skip-gram models hav e been found to be highly ef ficient in finding word embedding templates from huge amounts of unstructured te xt data and uncov er various semantic and syntactic relationships. Mikolov et al. 13 also sho wed that the such w ord embeddings ha ve the capability to capture linguistic regularities and patterns. These patterns can be represented as linear translations in the vector space. F or example, vec( Madrid ) - vec( Spain ) + vec( F rance ) is closer to v ec( P aris ) than any other word in their corpus. 9 , 14 Levy et al. 10 analyzed the theoretical founding of skip-gram model and sho wed that the training method of SGNS can be con verted into a weighted matrix factorization and its objectiv e induces a implicit factorization of a shifted PMI matrix - the well-known w ord-context PMI matrix 2 , 21 shifted by a constant offset. In, 11 Levy et al. performed an exhausti ve e valuation showing the impact of each parameter (window size, conte xt distribution smoothing, sub-sampling of frequent words and others) on the performance of SGNS and other recent word embedding methods, such as GLoV e. 16 They found that SGNS consistently profits from larger negati ve samples ( > 1 ) showing significant improv ement on various NLP tasks with higher values of ne gati ve samples. Pre vious works on neural embeddings (including the skip-gram model) define the contexts of a word to be its linear context (words preceding and follo wing the target word). Levy et al. 8 generalized the skip-gram model and used syntactic contexts deriv ed from automatically generated dependency parse-trees. These syntactic contexts were found to capture more functional similarities, while the bag-of-words nature of the contexts in the original skip-gram model generates broad topical similarities. 3 Model 3.1 Prob lem Overview Disease taxonomy generation is the process of tabulating characteristics of diseases w .r .t. sev eral pre-specified categories such as symptoms and transmission agents. T able 1 gives an example of taxonomy for three diseases viz. an emerging disease (H7N9), an endemic disease (avian influenza) and a rare disease (plague). T raditionally , such taxonomies are human curated - either from prior expert knowledge or by combining a multitude of reporting sources. News reports cov ering disease outbreaks can often contain disease specific information, albeit in an unstructured way . Our aim is to generate automated taxonomy of diseases similar to T able 1 using such unstructured information from ne ws reports. Such automated methods can greatly simplify the process of generating taxonomies, especially for emerging diseases, and lead to a timely dissemination of such information tow ards public health services. In general, such disease related news corpus is of moderate size for deep-learning methods and as explained in section 1 , unsupervised methods often fail to extract meaningful information. Thus we incorporate domain kno wledge in the form of a flat-list of disease related terms such as disease names, possible symptoms and possible transmission methods, hereafter referred to as the v ocabulary V . Figure 2 sho ws the process of automated taxonomy generation where we employ a supervised word2vec method referred to as Dis2V ec which takes the following inputs - (a) the pre-specified disease vocab ulary V and (b) unstructured ne ws corpus D and generates embeddings for each w ord (including words in the vocab ulary V ) in the corpus. Once word embeddings are generated, we employ a cosine comparator to create a tabular list of disease taxonomies similar to T able 1 . In this cosine comparator , to classify each disease for a taxonomical category , we calculate the cosine similarities between the embedding for the disease name and embeddings for all possible words related to that category . Then, we sort these cosine similarities (in descending order) and extract the words (higher up in the order) closer to the disease name hereafter referred to as top words found for that category . F or example, to extract the transmission agents for plague , we calculate the cosine similarities between the embedding for the word plague and the embeddings for all possible terms related to transmission agents and extract the top words by sorting the terms w .r .t. these similarities. W e can compare the top words found for a category with the human annotated words to compute the accuracy of the taxonomy generated from word embeddings. In the next 2 subsections, we will briefly discuss the basic word2vec model (skip-gram model with negati ve sampling) followed by the detailed description of our v ocabulary dri ven word2vec model Dis2V ec . 3.2 Basic W ord2vec Model In this section, we present a brief description of SGNS - the skip-gram model introduced in 12 trained using the ne gativ e sampling procedure in. 13 The objectiv e of the skip-gram model is to infer word embeddings that will be rele vant for predicting the surrounding words in a sentence or a document. The skip-gram model can also be trained using Hierarchical Softmax method as shown in. 13 3.2.1 Setting and Notation The inputs to the skip-gram model are a corpus of words w ∈ W and their corresponding contexts c ∈ C where W and C are the word and context v ocabularies. In SGNS , the contexts of w ord w i are defined by the words surrounding it in an L -sized context window w i − L , . . . , w i − 1 , w i + 1 , . . . , w i + L . Therefore, the corpus can be transformed into a collection of observed context and word pairs as D . The notation # ( w , c ) represents the number of times the pair ( w , c ) occurs in D . Therefore, # ( w ) = ∑ c ∈ C ( w , c ) and # ( c ) = ∑ w ∈ W ( w , c ) where # ( w ) and # ( c ) are the total number of times w and c occurred in D . Each word w ∈ W corresponds 3/ 15 V oc abu lar y F l at l i s t of w or ds ( i nf l uen za, c ough, e t c . ) V ocabul a ry F l at l i s t of w or ds ( i nf l uenza , c ough , et c . ) Disea se ou tbre ak News (H ealth Ma p ) D i s ea se ou tbrea k N ews (He alth Ma p ) Dis2 V e c D is e as e s p ec if ic e m be d din gs T axo n o m y C at eg o r i es C o s i n e C o m p a r a t o r T ax o n o m y T ab l e T x . m e t h o d s T x . a g e n t s Ex p o s u r e s S y m p t o m s Figure 2. Automated taxonomy generation from unstructured news corpus (HealthMap) and a pre-specified v ocabulary ( V ). Dis2V ec inputs these information to generate disease specific word embeddings that are then passed through a cosine comparator to generate the taxonomy for the disease of interest. T able 1. Human curated disease taxonomy for three diseases from three different class of diseases (endemic, emer ging, and rare). Disease T ransmission methods T ransmission agents Clinical symptoms Exposures A vian influenza (en- demic) zoonotic domestic animal, wild animal Fev er , cough, sore throat, diarrhea, vom- iting animal exposure, farmer , market, slaughter H7N9 (emerging) zoonotic domestic animal Fev er , cough, pneu- monia farmer , market, slaughter , animal exposure Plague (rare) vectorborne, zoonotic flea, wild animal Sore, fev er , headache, muscle ache, vomit- ing, nausea animal exposure, veterinarian, farmer to a vector w ∈ R T and similarly , each context c ∈ C is represented as a v ector c ∈ R T , where T is the dimensionality of the 4/ 15 word or context embedding. The entries in the vectors are the latent parameters to be learned. 3.2.2 Objective of SGNS SGNS tries to maximize the probability whether a single word-conte xt pair ( w , c ) was generated from the observ ed corpus D . Let P ( D = 1 | w , c ) refers to the probability that ( w , c ) was generated from the corpus, and P ( D = 0 | w , c ) = 1 − P ( D = 1 | w , c ) the probability that ( w , c ) was not. The objecti ve function for a single ( w , c ) pair is modeled as: P ( D = 1 | w , c ) = σ ( w · c ) = 1 1 + e − w · c (1) where w and c are the T -dimensional latent parameters or vectors to be learned. The objecti ve of the ne gativ e sampling is to maximize P ( D = 1 | w , c ) for observed ( w , c ) pairs while minimizing P ( D = 0 | w , c ) for randomly sampled ”negati ve” conte xts (hence the name ”negati ve sampling”), under the assumption that randomly selecting a context for a gi ven w ord will tend to generate an unobserved ( w , c ) pair . SGNS ’ s objective for a single ( w , c ) observation is then: log σ ( w · c ) + k · E c N ∼ P D [ log σ ( − w · c N )] (2) where k is the number of ”negativ e” samples and c N is the sampled context, drawn according to the smoothed unigram distribution P D ( c ) = # ( c ) α ∑ c # ( c ) α where α = 0 . 75 is the smoothing parameter . The objecti ve of SGN S is trained in an online f ashion using stochastic gradient updates o ver the observed pairs in the corpus D . The global objectiv e then sums over the observ ed ( w , c ) pairs in the corpus: l SGNS = ∑ ( w , c ) ∈ D log σ ( w · c ) + k · E c N ∼ P D [ log σ ( − w · c N )] (3) Optimizing this objecti ve will ha ve a tendency to generate similar embeddings for observ ed word-conte xt pairs, while scattering unobserved pairs in the vector space. Intuiti vely , words that appear in similar contexts or tend to appear in the contexts of each other should hav e similar embeddings. 3.3 Disease Specific W ord2vec Model ( Dis2V ec ) In this section, we introduce Dis2V ec , a disease specific word2vec model whose objective is to generate word embeddings which will be useful for automatic disease taxonomy creation gi ven an input unstructured corpus D . W e used a pre-specified disease-related vocab ulary V (domain information) to guide the discovery process of word embeddings in Dis2V ec . The input corpus D consists of a collection of ( w , c ) pairs. Based on V , we can categorize the ( w , c ) pairs into three types as shown below: • D ( d ) = { ( w , c ) : w ∈ V ∧ c ∈ V } , i.e. both the word w and the context c are in V • D ( ¬ d ) = { ( w , c ) : w / ∈ V ∧ c / ∈ V } , i.e. neither the word w nor the context c are in V • D ( d )( ¬ d ) = { ( w , c ) : w ∈ V ⊕ c ∈ V } , i.e. either the word w is in V or the context c is in V but both cannot be in V Therefore, the input corpus D can be represented as D = D ( d ) + D ( ¬ d ) + D ( d )( ¬ d ) . Each of these cate gories of ( w , c ) pairs needs special consideration while generating disease specific embeddings. 3.3.1 V ocab ulary Driven Negative Sampling The first category ( D ( d ) ) of ( w , c ) pairs, where both w and c are in V ( w ∈ V ∧ c ∈ V ), is of prime importance in generating disease specific word embeddings. Our first step in generating such embeddings is to maximize log σ ( w · c ) in order to achiev e similar embeddings for these disease word-context pairs. Apart from maximizing the dot products, following classical approaches, 13 negati ve sampling is also required to generate robust embeddings. In Dis2V ec , we adopt a vocabulary ( V ) driv en negati ve sampling for these disease word-conte xt pairs. In this vocabulary dri ven approach, instead of random sampling we sample negati ve examples ( c N ) from the set of non-disease contexts, i.e. contexts which are not in V ( c / ∈ V ). This tar geted sampling of negati ve conte xts will ensure dissimilar embeddings of disease words ( w ∈ V ) and non-disease contexts ( c / ∈ V ), thus scattering them in the vector space. Howe ver , sampling negativ e examples only from the set of non-disease conte xts may lead to o verfitting and thus, we introduce a sampling parameter π s which controls the probability of drawing a ne gative e xample 5/ 15 from non-disease contexts ( c ∈ V ) versus disease contexts ( c ∈ V ). Dis2V ec ’ s objectiv e for ( w , c ) ∈ D ( d ) is sho wn below in equation 4 . l D ( d ) = ∑ ( w , c ) ∈ D ( d ) log σ ( w · c ) (4) + k · [ P ( x k < π s ) E c N ∼ P D c / ∈ V [ log σ ( − w · c N )] + P ( x k ≥ π s ) E c N ∼ P D c ∈ V [ log σ ( − w · c N )]] where x k ∼ U ( 0 , 1 ) , U(0,1) being the uniform distribution on the interv al [0,1]. If x k < π s , we sample a negativ e context c N from the unigram distribution P D c / ∈ V where D c / ∈ V is the collection of ( w , c ) pairs for which c / ∈ V and P D c / ∈ V = # ( c ) α ∑ c / ∈ V # ( c ) α where α is the smoothing parameter . For values of x k ≥ π s , we sample c N from the unigram distribution P D c ∈ V and P D c ∈ V = # ( c ) α ∑ c ∈ V # ( c ) α . Therefore, optimizing the objectiv e in equation 4 will hav e a tendency to generate disease specific word embeddings for values of π s ≥ 0 . 5 due to the reason that higher number of negati ve contexts ( c N ) will be sampled from the set of non-disease contexts ( c / ∈ V ) with π s ≥ 0 . 5. 3.3.2 Out-of-v ocabulary Objective Regularization The second category ( D ( ¬ d ) ) of ( w , c ) pairs consists of those pairs for which both w and c are not in V ( w / ∈ V ∧ c / ∈ V ). These pairs are uninformativ e to us in generating disease specific word embeddings since both w and c are not a part of V . Ho wev er , minimizing their dot products will scatter these pairs in the embedding space and thus, a w ord w / ∈ V can ha ve similar embeddings (or , get closer) to a word w ∈ V which should be av oidable in our scenario. Therefore, we need to maximize log σ ( w · c ) for these ( w , c ) pairs in order to achie ve similar (or , closer) embeddings. W e adopt the basic objecti ve function of SGNS for ( w , c ) ∈ D ( ¬ d ) as shown belo w in equation 5 . l D ( ¬ d ) = ∑ ( w , c ) ∈ D ( ¬ d ) log σ ( w · c ) + k · E c N ∼ P D [ log σ ( − w · c N )] (5) 3.3.3 V ocab ulary Driven Objective Minimization Lastly , the third cate gory ( D ( d )( ¬ d ) ) consists of ( w , c ) pairs where either w is in V or c is in V ( w ∈ V ⊕ c ∈ V ) b ut both cannot be in V . Consider an arbitrary ( w , c ) pair belonging to D ( d )( ¬ d ) . As per the objectiv e (equation 3 ) of SGNS , two words are similar to each other if they share the same contexts or if they tend to appear in the contexts of each other (and preferably both). If w ∈ V and c / ∈ V , then maximizing log σ ( w · c ) will hav e the tendency to generate similar embeddings for the disease word w ∈ V and non-disease words / ∈ V which share the same non-disease context c / ∈ V . On the other word, if c ∈ V and w / ∈ V , then maximizing log σ ( w · c ) will driv e the embedding of the non-disease word w / ∈ V closer to the embeddings of disease words ∈ V sharing the same disease context c ∈ V . Therefore, we posit that the dot products for this category of ( w , c ) pairs should be minimized, i.e. the objecti ve log σ ( − w · c ) should be optimized in order to ensure dissimilar embeddings for these ( w , c ) pairs. Ho wev er , minimizing the dot products of all such word-conte xt pairs may lead to ov er-penalization and thus we introduce an objectiv e selection parameter π o which controls the probability of selecting log σ ( − w · c ) versus log σ ( w · c ) . The objectiv e for ( w , c ) ∈ D ( d )( ¬ d ) is shown belo w in equation 6 . l D ( d )( ¬ d ) = ∑ ( w , c ) ∈ D ( d )( ¬ d ) P ( z < π o ) log σ ( − w · c ) (6) + P ( z ≥ π o ) log σ ( w · c ) where z ∼ U ( 0 , 1 ) , U(0,1) being the uniform distribution ov er the interval [0,1]. If z < π o , log σ ( − w · c ) gets optimized, otherwise Dis2V ec optimizes log σ ( w · c ) . Therefore, optimizing the objecti ve in equation 6 will hav e a tendency to generate disease specific embeddings with v alues of π o ≥ 0 . 5 due to the reason that the objecti ve log σ ( − w · c ) will be selected for optimization with a higher probability ov er log σ ( w · c ) . Finally , the overall objecti ve of Dis2V ec comprising all three categories of ( w , c ) pairs can be defined as below . l Dis2V ec = l D ( d ) + l D ( ¬ d ) + l D ( d )( ¬ d ) (7) Similar to SGNS , the objectiv e in equation 7 is trained in an online fashion using stochastic gradient updates over the three categories of ( w , c ) pairs. 6/ 15 Algorithm 1: Dis2V ec model Input : Unstructured corpus D = { ( w , c ) } , V Output : word embeddings w ∀ w ∈ W , column embeddings c ∀ c ∈ C 1 Categorize D into 3 types: D ( d ) = { ( w , c ) : w ∈ V ∧ c ∈ V } , D ( ¬ d ) = { ( w , c ) : w / ∈ V ∧ c / ∈ V } , D ( d )( ¬ d ) = { ( w , c ) : w ∈ V ⊕ c ∈ V } 2 for eac h ( w , c ) ∈ D do 3 if ( w , c ) ∈ D ( d ) then 4 train the ( w , c ) pair using the objectiv e in equation 4 5 else if ( w , c ) ∈ D ( ¬ d ) then 6 train the ( w , c ) pair using the objectiv e in equation 5 7 else 8 train the ( w , c ) pair using the objectiv e in equation 6 3.4 P arameters in Dis2V ec Dis2V ec inherits all the parameters of SGNS , such as dimensionality ( T ) of the word embeddings, window size ( L ), number of negati ve samples ( k ) and context distribution smoothing ( α ). It also introduces two ne w parameters - the objecti ve selection parameter ( π o ) and the sampling parameter ( π s ). The e xplored values for each of the aforementioned parameters are sho wn in T able 6 . 4 Experimental Evaluation W e e v aluated Dis2V ec against se veral state-of-the art methods. In this section, we first pro vide a brief description of our experimental setup, including the disease ne ws corpus, human annotated taxonomy and the domain information used as the vocab ulary V for the process. W e present our experimental findings in Section 4.2 where we have compared our model against sev eral baselines and also explore its applicability to emer ging diseases. 4.1 Experimental Setup 4.1.1 Corpus W e collected a dataset corresponding to a corpus of public health-related news articles in English extracted from HealthMap, 7 a prominent online aggregator of news articles from all ov er the world for disease outbreak monitoring and real-time surveillance of emerging public health threats. Each article contains the following information - textual content, disease tag, reported date and location information in the form of (lat, long) coordinates. The articles were reported during the time period 2010 to 2014 and correspond to locations from all over the world. The textual content of each article was pre-processed by sentence splitting, tokenization and lemmatization via B ASIS T echnologies’ Rosette Language Processing (RLP) tools. 17 After pre-processing, the corpus consisting of 124850 articles was found to contain 1607921 sentences, spanning 52679298 words. W ords that appeared less than 5 times in the corpus were ignored, resulting in a vocab ulary of 91178 words. 4.1.2 Human Annotated T axonom y Literature revie ws were conducted for each of the 39 infectious diseases of interest in order to make classifications for transmission methods, transmission agents, clinical symptoms and exposures or risk factors. Methods of transmission were first classified into 8 subcategories - dir ect contact , dr oplet , airborne , zoonotic , vectorborne , waterborne , foodborne , and en vir onmental . F or many diseases, multiple subcategories of transmission methods could be assigned. Transmission agents were classified into 8 subcategories - wild animal , fomite , fly , mosquito , bushmeat , flea , tick and domestic animal . The category of clinical symptoms was broken down into 8 subcategories: general , gastr ointestinal , r espiratory , nervous system , cutaneous , cir culatory , musculoskeletal , and ur ogenital . A full list of the symptoms within each subcategory can be found in T able 2 . For disease exposures or risk factors, 7 subcategories were assigned based on those listed/most commonly reported in the literature. The subcategories include: healthcar e facility , healthcar e worker , schoolchild , mass gathering , travel , animal exposur e , and weak ened immune system . The animal exposur e category was further broken do wn into farmer , veterinarian , market and slaughter . For some diseases, there were no risk factors listed, and for other diseases, multiple exposures were assigned. 4.1.3 Disease V ocab ulary V Disease vocab ulary V is provided as prior knowl edge to Dis2V ec in order to generate disease specific word embeddings as explained in section 3.3 . V is represented by a flat list of disease-related terms consisting of disease names ( influenza , h7n9 , 7/ 15 T able 2. Symptom categories and corresponding words. Symptom Category W ords General Fev er , chill, weight loss, fatigue, lethargy , headache Gastrointestinal Abdominal pain, nausea, diarrhea, v omit- ing Respiratory Cough, runny nose, sneezing, chest pain, sore throat, pneumonia, dyspnea Nervous system Mental status, paralysis, paresthesia, en- cephalitis, meningitis Cutaneous Rash, sore, pink eye Circulatory Hemorrhagic Musculoskeletal Joint pain, muscle pain, muscle ache 2 2 . 4 % 5 0 . 0 % 1 3 . 8 % 1 3 . 8 % Transmission Agents Exposure s Symptom s Transm ission Method Figure 3. Distribution of word counts corresponding to each taxonomical category in the disease v ocabulary ( V ). W ords related to clinical symptoms constitute the majority of V with relati vely much smaller percentages of terms related to exposures, transmission agents and transmission methods plague , ebola , etc.), all possible words related to transmission methods( vectorborne , foodborne , waterborne , etc.), all possible words related to transmission agents ( flea , domestic animal , mosquito , etc.), all possible w ords related to clinical symptoms ( fever , nausea , paralysis , cough , headac he , etc.) and all possible words related to exposures or risk factors ( healthcar e facility , slaughter , farmer , etc.). T otal number of words in V is found to be 103. In Figure 3 , we show the distrib ution of word counts associated with dif ferent taxonomical categories in the disease v ocabulary ( V ). As depicted in Figure 3 , half of the words in V are terms related to clinical symptoms follo wed by exposures or risk f actors ( 22 . 4% ), transmission methods ( 13 . 8% ) and transmission agent(s) (13 . 8%). 8/ 15 4.1.4 Baselines W e compared the follo wing baseline models with Dis2V ec on the four disease characterization tasks. • SGNS : Unsupervised skip-gram model with negati ve sampling 13 described in section 3.2 . • SGHS : skip-gram model trained using the hierarchical softmax algorithm 13 instead of negati ve sampling. • CBO W : Continuous bag-of-words model described in. 12 Unlike skip-gram models, the training objecti ve of the CBO W model is to correctly predict the target word giv en its contexts (surrounding words). CBO W is denoted as a bag-of-words model as the order of words in the contexts does not ha ve an y impact on the model. All models (both baselines and Dis2V ec ) were trained on the HealthMap corpus using a T -dimensional word embedding via gensim’ s word2vec software. 18 W e explored a large space of parameters for each model. In T able 6 , we provide the list of parameters, the explored v alues for each parameter and the applicable models corresponding to each parameter . Apart from the parameters listed in T able 6 , we also applied the sub-sampling technique dev eloped by Mikolov et al. 13 to each model in order to counter the imbalance between common words (such as, is , of , the , a , etc.) and rare words. In the context of NLP , these common words are referred to as stop words . For more details on the sub-sampling techniques, please see Mikolov et al. 13 Our initial experiments (not reported) demonstrated that both the baselines and Dis2V ec sho wed improv ed results on the disease characterization tasks with sub-sampling versus without sub-sampling. 4.1.5 Accuracy Metric W e e valuate the automatic taxonomy generation methods such that for a taxonomical characteristic of a disease, models that generate similar set of terms (top words) as the human annotated ones are more preferable. As such, we use cosine similarity in a min-max setting between the aforementioned sets for a particular characterization cate gory as our accuracy metric. The ov erall accuracy of a model for a category can be found by av eraging the accuracy values across all diseases of interest. This is a bounded metric (between 0 and 1 ) where higher v alues indicate better model performance. W e can formalize the metric as follows. Let D be the disease and C be the taxonomical category under inv estigation. Furthermore, let C 1 , C 2 , · · · , C N be all possible terms or words related to C and H 1 , H 2 , · · · , H M be the human annotated w ords. Then the characterization accurac y corresponding to category C and disease D is giv en below in equation 8 . Accuracy ( C , D ) = 1 M M ∑ j = 1 cosine ( D , H j ) − min i cosine ( D , C i ) max i cosine ( D , C i ) − min i cosine ( D , C i ) (8) where D , H j and C i represent the word embeddings for D , H j and C i . min i cosine ( D , C i ) and max i cosine ( D , C i ) represent the maximum and minimum cosine similarity v alues between D and the word embeddings of the terms related to C . Therefore, equation 8 indicates that if the human annotated word H j is among the top w ords found by the word2v ec model for the category C , then the ratio in the numerator is high leading to high accuracy and vice versa. 4.2 Results In this section we try to ascertain the efficacy and the applicability of Dis2V ec by in vestigating some of the pertinent questions related to the problem of disease characterization. 1. Sample-vs-objective: which is the better method to incorporate disease vocabulary inf ormation into Dis2V ec ? 2. Does disease vocab ulary information impr ove disease characterization? 3. What are beneficial parameter configurations f or characterizing diseases? 4. Importance of taxonomical categories - how should we construct the disease vocab ulary? 5. Can Dis2V ec be applied to characterize emerging, endemic and rare diseases? Sample-vs-objective: which is the better method to incorporate disease v ocabulary information into Dis2V ec ? As described in Section 3 , there are primarily two different ways by which disease vocabulary information ( V ) guides the generation of embeddings for Dis2V ec (a) by modulating ne gativ e sampling parameter ( π s ) for disease word-context pairs ( ( w , c ) ∈ D ( d ) ) referred to as Dis2V ec-sample and (b) by modulating the objective selection parameter ( π o ) for non-disease words or non-disease contexts ( ( w , c ) ∈ D ( d )( ¬ d ) ) referred to as Dis2V ec-objective . W e in vestigate the importance of these two strate gies by comparing the accuracies for each strategy indi vidually ( Dis2V ec-sample and Dis2V ec-objective ) as well as combined together ( Dis2V ec-combined ) under the best parameter configuration for a particular task in T able 3 . As can be seen, 9/ 15 T able 3. Comparativ e performance ev aluation of Dis2V ec-combined against Dis2V ec-objective and Dis2V ec-sample across the 4 characterization tasks under the best parameter configuration for that model and task combination. The v alue in each cell represents the ov erall accuracy across the 39 diseases for that particular model and characterization task. W e use equation 8 as the accuracy metric in this table. Characterization tasks Dis2V ec-sample Dis2V ec-objective Dis2V ec-combined Symptoms 0.635 0.945 0.940 Exposures 0.590 0.540 0.597 T ransmission methods 0.794 0.754 0.734 T ransmission agents 0.505 0.506 0.516 Overall a verage accuracy 0.631 0.686 0.697 T able 4. Comparativ e performance ev aluation of Dis2V ec against SGNS , SGHS and CBO W across the 4 characterization tasks under the best parameter configuration for that model and task combination. The v alue in each cell represents the ov erall accuracy across the 39 diseases for that particular model and characterization task. W e use equation 8 as the accuracy metric in this table. Characterization tasks CBO W SGHS SGNS Dis2V ec Symptoms 0.498 0.560 0.620 0.945 Exposures 0.383 0.498 0.605 0.597 T ransmission methods 0.481 0.765 0.792 0.794 T ransmission agents 0.274 0.466 0.498 0.516 Overall a verage accuracy 0.409 0.572 0.629 0.713 no single strategy is best across all tasks. Henceforth, we select the best performing strategy for a particular task as our Dis2V ec in the next T able 4 . Does disease vocab ulary information impr ove disease characterization? Dis2V ec was designed to incorporate disease vocab ulary information in order to guide the generation of disease specific w ord embeddings. T o ev aluate the importance of such v ocabulary information in Dis2V ec , we compare the performance of Dis2V ec against the baseline w ord2vec models described in section 4.1.4 under the best parameter configuration for a particular task. These baseline models do not permit incorporation of any v ocabulary information due to their unsupervised nature. T able 4 presents the accuracy of the models for the 4 disease characterization tasks - symptoms, exposures, transmission methods and transmission agents. As can be seen, Dis2V ec performs the best for 3 tasks and in a verage. It is also interesting to note that Dis2V ec achie ves higher performance gain ov er the baseline models for the symptoms cate gory than the other categories. The superior performance of Dis2V ec in the symptoms category can be attributed to two factors - (a) higher ercentage of symptom words in the disease vocab ulary V (see Figure 3 ) and (b) higher occurrences of symptom w ords in the HealthMap news corpus. Ne ws articles reporting a disease outbreak generally tend to focus more on the symptoms related to the disease rather than the other cate gories. Giv en the functionality of Dis2V ec, higher occurrences of symptom terms in outbreak ne ws reports will lead to generation of ef ficient word embeddings for characterizing disease symptoms. T able 5. Comparativ e performance ev aluation of Dis2V ec with full vocab ulary against each of the 6 conditions of Dis2V ec with a truncated vocab ulary across the 4 characterization tasks where the truncated v ocabulary consists of disease names and all possible terms related to a particular taxonomical category . W e use equation 8 as the accuracy metric in this table. Characterization tasks Dis2V ec (Exposures) Dis2V ec (T ransmission methods) Dis2V ec (T ransmission agents) Dis2V ec (Symptoms) Dis2V ec (full vocab ulary) Symptoms 0.597 0.581 0.165 0.883 0.945 Exposures 0.554 0.557 0.315 0.416 0.597 T ransmission methods 0.748 0.768 0.517 0.455 0.794 T ransmission agents 0.446 0.459 0.467 0.457 0.516 What are beneficial parameter configurations for characterizing diseases? T o identify which parameter settings are beneficial for characterizing diseases, we looked at the best parameter configuration of all the 6 models on each task. W e then counted the number of times each parameter setting was chosen in these configurations (see T able 6 ). W e compared 10/ 15 T able 6. Comparison of different parameter settings for each model, measured by the number of characterization tasks in which the best configuration had that parameter setting. Non-applicable combinations are marked by ‘N A ’ Method T L k α π s π o 300 : 600 5 : 10 : 15 1 : 5 : 15 0 . 75 : 1 0 . 3 : 0 . 5 : 0 . 7 0 . 3 : 0 . 5 : 0 . 7 Dis2V ec-combined 2 : 2 3 : 1 : 0 2 : 1 : 1 1 : 3 4 : 0 : 0 0 : 2 : 2 Dis2V ec-sample 2 : 2 2 : 1 : 1 1 : 1 : 2 4 : 0 1 : 2 : 1 N A Dis2V ec-objective 3 : 1 2 : 2 : 0 1 : 1 : 2 3 : 1 N A 2 : 0 : 2 SGNS 2 : 2 2 : 2 : 0 0 : 2 : 2 2 : 2 N A N A SGHS 3 : 1 1 : 0 : 3 N A NA NA N A CBO W 0 : 4 0 : 4 : 0 NA N A N A N A T able 7. Comparativ e performance ev aluation of Dis2V ec against SGNS , SGHS and CBO W across the 4 characterization tasks for each class of diseases (emerging, endemic and rare) under the best parameter configuration for a particular { disease class, task, model } combination. W e use equation 8 as the accurac y metric in this table. Class Characterization T asks CBO W SGHS SGNS Dis2V ec Emerging Symptoms 0.589 0.671 0.722 0.977 Exposures 0.356 0.495 0.516 0.679 T ransmission methods 0.407 0.885 0.898 0.945 T ransmission agents 0.528 0.587 0.795 0.975 Endemic Symptoms 0.453 0.583 0.671 0.930 Exposures 0.421 0.512 0.642 0.631 T ransmission methods 0.472 0.820 0.851 0.856 T ransmission agents 0.164 0.399 0.408 0.415 Rare Symptoms 0.506 0.536 0.599 0.949 Exposures 0.377 0.525 0.616 0.670 T ransmission methods 0.503 0.760 0.755 0.775 T ransmission agents 0.320 0.522 0.512 0.515 standard settings of each parameter as e xplored in pre vious research. 11 For the ne w parameters π s and π o introduced by Dis2V ec , we chose the values 0 . 3 , 0 . 5 and 0 . 7 in order to analyze the impact of these parameters with values < 0 . 5 and ≥ 0 . 5 . For Dis2V ec-objective and Dis2V ec-combined , some trends emerge re garding the parameter π o that these two models consistently benefit from values of π o ≥ 0 . 5 validating our claims in section 3.3 that when π o ≥ 0 . 5 , disease words and non-disease words get scattered from each other in the vector space, thus tending to generate disease specific embeddings. Howe ver , for π s we observe mixed trends. As e xpected, Dis2V ec-sample benefits from higher values of sampling parameter π s ≥ 0 . 5 . But Dis2V ec-combined seems to prefer lower values of π s < 0 . 5 and higher values of π o ≥ 0 . 5 for the disease characterization tasks. For the smoothing parameter( α ), all the applicable models prefer smoothed unigram distribution ( α = 0 . 75 ) for negati ve sampling except Dis2V ec-combined which is in fav or of unsmoothed distribution ( α = 1 . 0 ) for characterizing diseases. For the number of ne gative samples k , all the applicable models seem to benefit from k > 1 except Dis2V ec-combined which seems to prefer k = 1 . For the windo w size ( L ), all the models prefer smaller-sized context windo ws (either 5 or 10) except SGHS which prefers larger -sized windows ( L > 10 ) for characterizing diseases. Finally , regarding the dimensionality ( T ) of the embeddings, Dis2V ec-combined , Dis2V ec-sample and SGNS are in equal fav or of both 300 and 600 dimensions. Dis2V ec-objective and SGHS prefer 300 dimensions and CBO W is in fa vor of 600 dimensions for characterizing diseases. Importance of taxonomical categories - how should we construct the disease vocab ulary? W e follo wup our previous analysis by in vestigating the importance of words related to each taxonomical category in constructing the disease v ocabulary tow ards final characterization accuracy . T o e valuate a particular cate gory , we used a truncated disease vocab ulary consisting of disease names and the w ords in the corresponding category to dri ve the disco very of w ord embeddings in Dis2V ec under the best parameter configuration for that category . W e compared the accurac y of each of these conditions ( Dis2V ec (exposures), Dis2V ec (transmission methods), Dis2V ec (transmission agents), Dis2V ec (symptoms)) against Dis2V ec (full v ocabulary) across the 4 characterization tasks. T able 5 presents our results for this analysis and provides multiple insights as follows. (a) Constructing the vocab ulary with words related to all the categories leads to better characterization across all the tasks. (b) As expected, Dis2V ec (symptoms) is the second best performing model for the symptoms category but it’ s performance is degraded for other tasks. The same goes for Dis2V ec (transmission methods) and Dis2V ec (transmission agents). (c) Therefore, it indicates that 11/ 15 in order to achiev e reasonable characterization accuracy for a category , we need to supply at least the words related to that category along with the disease names in constructing the v ocabulary . Can Dis2V ec be applied to characterize emerging, endemic and rar e diseases? W e classified the 39 diseases of interest into 3 classes as follows. For classifying each disease, we plotted the time series of the counts of HealthMap articles with disease tag equal to the corresponding disease. • Endemic : W e considered a disease as endemic if the counts of articles were consistently high for all years with repeating shapes. E.g.- rabies, a vian influenza, west nile virus. • Emerging : W e considered a disease as emerging if the counts of articles were historically low , but hav e peaked in recent years. E.g.- Ebola, H7N9, MERS. • Rare : W e considered a disease as rare if the counts were consistently lo w for all years with or without sudden spikes. E.g.- plague, chagas, japanese encephalitis. W e also considered a disease as rare if the counts of articles were high in 2010/2011, but hav e since fallen do wn and depicted consistently low counts. E.g.- tuberculosis. Follo wing classification, we found 4 emerging diseases, 12 endemic diseases and 23 rare diseases. The full list of the diseases under each class and the time series plots of the HealthMap article counts for these diseases can be accessed at Dis 2 V ec − su p pl ement ar y . In T able 7 , we compared the accuracy of Dis2V ec against the baseline word2v ec models for each class of diseases across the 4 characterization tasks under the best parameter configuration for a particular { disease class, task, model } combination. It can be seen that Dis2V ec is the best performing model for majority of the { disease class, task } combinations except { endemic, exposures } and { rare, transmission agents } . It is interesting to note that for the symptoms category , Dis2V ec performs better than the baseline models across all the disease classes. Irrespective of disease class, ne ws reports generally mention the symptoms of the disease while reporting an outbreak. As the characteristics of the emerging diseases are relativ ely unknown w .r .t. endemic and rare, news media reports also tend to focus on other cate gories (exposures, transmission methods, transmission agents) apart from the symptoms to create awareness among the general public. Therefore, Dis2V ec performs better than the baseline models across all the categories for the emerging diseases. For endemic and rare diseases, Dis2V ec outperforms the baseline models w .r .t. the symptoms category . For other categories, Dis2V ec performs better ov erall, although the performance gain is not high in comparison to the symptoms. Ne ws media reports tend to neglect categories other than symptoms while reporting outbreaks of endemic and rare diseases. In Figure 4 , we show the top w ords found for each cate gory of an emerging disease (H7N9), an endemic disease (a vian influenza) and a rare disease (plague) across all the models. The human annotated words corresponding to each category of these diseases can be found in T able 1 . W e selected these 3 diseases due to their public health significance and the fact that these diseases have complete co verage across all the taxonomical categories (see T able 1 ). It is interesting to note that for H7N9, the top words found by Dis2V ec for the symptoms category contain all the human annotated words fe ver , cough and pneumonia , while the top words found by SGNS only contain the word fever . For exposures (H7N9), Dis2V ec is able to capture three human annotated words animal exposur e , farmer, slaughter. Howe ver , SGNS is only able to capture the word animal . For the symptoms category of the rare disease plague, Dis2V ec is able to detect three human annotated words sor e , fever and headache with SGNS only being able to detect the word fever . Moreover , Dis2V ec is able to characterize the transmission method of plague as vectorborne with SGNS failing to do so. 5 Conclusions Classical word2vec methods such as SGNS and SGHS hav e been applied to solve a variety of linguistic tasks with considerable accuracy . Ho we ver , such methods fail to generate satisfactory embeddings for highly specific domains such as healthcare where uncov ering the relationships with respect to domain specific words is of greater importance than the non-domain ones. These algorithms are by design unsupervised and do not permit the inclusion of domain information to find interesting embeddings. In this paper , we ha ve proposed Dis2V ec , a disease specific word2v ec framew ork that giv en an unstructured ne ws corpus and domain knowledge in terms of important words, can find interesting disease characterizations. W e demonstrated the strength of our model by comparing it against three classical word2v ec methods on four disease characterization tasks. Dis2V ec e xhibits the best ov erall accuracy for 3 tasks across all the diseases and in general, its relati ve performance impro vement is found to be empirically dependent on the amount of supplied domain knowledge. Consequently , Dis2V ec works especially well for characteristics with more domain kno wledge (symptoms) and is found to be a promising tool to analyze dif ferent class of diseases viz. emer ging, endemic and rare. In future, we aim to analyze a greater v ariety of diseases and try to ascertain common relationships between such diseases across different geographical re gions. 12/ 15 6 Supplementary Data The disease specific word embeddings generated by Dis2V ec from the HealthMap corpus can be accessed at Dis2V ec- supplementary . References 1. M. Baroni, G. Dinu, and G. Krusze wski. Don’t count, predict! a systematic comparison of context-counting vs. context- predicting semantic vectors. In ACL (1) , pages 238–247, 2014. 2. M. Baroni and A. Lenci. Distrib utional memory: A general frame work for corpus-based semantics. Computational Linguistics , 36(4):673–721, 2010. 3. Y . Bengio, H. Schwenk, J.-S. Sen ´ ecal, F . Morin, and J.-L. Gauvain. Neural probabilistic language models. In Innovations in Machine Learning , pages 137–186. Springer , 2006. 4. P . Chakraborty , N. Ramakrishnan, et al. Forecasting a moving tar get: Ensemble models for ILI case count predictions. In Pr oceedings of the 2014 SIAM International Confer ence on Data Mining, Philadelphia, P ennsylvania, USA, April 24-26, 2014 , pages 262–270, 2014. 5. R. Collobert and J. W eston. A unified architecture for natural language processing: Deep neural networks with multitask learning. In Pr oceedings of the 25th international confer ence on Machine learning , pages 160–167. A CM, 2008. 6. R. Collobert, J. W eston, L. Bottou, M. Karlen, K. Kavukcuoglu, and P . Kuksa. Natural language processing (almost) from scratch. The Journal of Mac hine Learning Researc h , 12:2493–2537, 2011. 7. C. C. Freifeld, K. D. Mandl, B. Y . Reis, and J. S. Bro wnstein. Healthmap: global infectious disease monitoring through automated classification and visualization of internet media reports. J o urnal of the American Medical Informatics Association , 15(2):150–157, 2008. 8. O. Le vy and Y . Goldber g. Dependency-based word embeddings. In Pr oceedings of the 52nd Annual Meeting of the Association for Computational Linguistics, A CL 2014, J une 22-27, 2014, Baltimor e, MD, USA, V olume 2: Short P aper s , pages 302–308, 2014. 9. O. Le vy and Y . Goldberg. Linguistic regularities in sparse and explicit w ord representations. In Pr oceedings of the Eighteenth Confer ence on Computational Natural Language Learning , CoNLL 2014, Baltimor e, Maryland, USA, J une 26-27, 2014 , pages 171–180, 2014. 10. O. Le vy and Y . Goldber g. Neural word embedding as implicit matrix f actorization. In Advances in Neural Information Pr ocessing Systems 27: Annual Conference on Neural Information Processing Systems 2014, December 8-13 2014, Montr eal, Quebec, Canada , pages 2177–2185, 2014. 11. O. Levy , Y . Goldberg, and I. Dagan. Improving distributional similarity with lessons learned from word embeddings. T ACL , 3:211–225, 2015. 12. T . Mikolo v , K. Chen, G. Corrado, and J. Dean. Efficient estimation of word representations in vector space. CoRR , abs/1301.3781, 2013. 13. T . Mikolov , I. Sutske ver , K. Chen, G. S. Corrado, and J. Dean. Distributed representations of words and phrases and their compositionality . In Advances in Neural Information Pr ocessing Systems 26: 27th Annual Conference on Neur al Information Pr ocessing Systems 2013. Pr oceedings of a meeting held December 5-8, 2013, Lake T ahoe, Nevada, United States. , pages 3111–3119, 2013. 14. T . Mikolo v , W . Y ih, and G. Zweig. Linguistic regularities in continuous space word representations. In Human Language T ec hnologies: Conference of the North American Chapter of the Association of Computational Linguistics, Pr oceedings, J une 9-14, 2013, W estin P eachtr ee Plaza Hotel, Atlanta, Georgia, USA , pages 746–751, 2013. 15. A. Mnih and G. E. Hinton. A scalable hierarchical distributed language model. In Advances in neural information pr ocessing systems , pages 1081–1088, 2009. 16. J. Pennington, R. Socher , and C. D. Manning. Glove: Global vectors for word representation. In Pr oceedings of the 2014 Confer ence on Empirical Methods in Natural Languag e Pr ocessing, EMNLP 2014, October 25-29, 2014, Doha, Qatar , A meeting of SIGD A T , a Special Inter est Gr oup of the A CL , pages 1532–1543, 2014. 17. N. Ramakrishnan, P . Butler, S. Muthiah, et al. ’beating the news’ with embers: F orecasting civil unrest using open source indicators. In Pr oceedings of the 20th ACM SIGKDD International Confer ence on Knowledge Discovery and Data Mining , pages 1799–1808, New Y ork, NY , USA, 2014. A CM. 13/ 15 18. R. ˇ Reh ˚ u ˇ rek and P . Sojka. Software Framew ork for T opic Modelling with Large Corpora. In Pr oceedings of the LREC 2010 W orkshop on New Challenges for NLP F rameworks , pages 45–50, V alletta, Malta, May 2010. ELRA. http: //is.muni.cz/publication/884893/en . 19. T . Rekatsinas, S. Ghosh, S. R. Mekaru, E. O. Nsoesie, J. S. Brownstein, L. Getoor, and N. Ramakrishnan. Sourceseer: Forecasting rare disease outbreaks using multiple data sources. In Pr oceedings of the 2015 SIAM International Confer ence on Data Mining , pages 379–387. 20. J. T urian, L. Ratinov , and Y . Bengio. W ord representations: a simple and general method for semi-supervised learning. In Pr oceedings of the 48th annual meeting of the association for computational linguistics , pages 384–394. Association for Computational Linguistics, 2010. 21. P . D. T urney and P . P antel. From frequenc y to meaning: V ector space models of semantics. Journal of Artificial Intelligence Resear ch , 37:141–188, 2010. 22. Z. W ang, P . Chakraborty , S. R. Mekaru, J. S. Bro wnstein, J. Y e, and N. Ramakrishnan. Dynamic poisson autoregression for influenza-like-illness case count prediction. In Pr oceedings of the 21th A CM SIGKDD International Confer ence on Knowledge Discovery and Data Mining , pages 1285–1294. A CM, 08 2015. 14/ 15 H7N9 A vian influenza Plague Dis 2 Vec SGNS SGHS CBOW d i a r r h e a f e v e r h e m o r r h a g i c c o u g h p n e u m o n i a e n c e p h a l i t i s s n e e z i n g h e m o r r h a g i c f e v e r m e n t a l _s t a t u s h e m o r r h a g i c f e v e r e n c e p h a l i t i s p n e u m o n i a d y s p n e a d i a r r h e a p a r a l y s i s n a u s e a s o r e _t h r o a t r u n n y _n o s e H 7 N 9 (a) Symptoms Dis 2 Vec SGNS SGHS CBOW c o u g h c h i l l p n e u m o n i a e n c e p h a l i t i s r a s h h e m o r r h a g i c m e n t a l _s t a t u s p a r e s t h e s i a s n e e z i n g e n c e p h a l i t i s h e m o r r h a g i c d y s p n e a p n e u m o n i a f e v e r l e t h a r g y s n e e z i n g p i n k _e y e c h e s t _p a i n r u n n y _n o s e m u s c l e _a c h e A V I A N _I N F L U E N Z A (b) Symptoms Dis 2 Vec SGNS SGHS CBOW h e a d a c h e s o r e h e m o r r h a g i c e n c e p h a l i t i s d i a r r h e a s n e e z i n g f e v e r h e m o r r h a g i c p i n k _e y e f e v e r l e t h a r g y m e n t a l _s t a t u s e n c e p h a l i t i s p n e u m o n i a h e m o r r h a g i c f e v e r p n e u m o n i a r a s h p a r a l y s i s p a r e s t h e s i a j o i n t _p a i n m u s c l e _p a i n v o m i t i n g p a r e s t h e s i a h e m o r r h a g i c r u n n y _n o s e s n e e z i n g m e n t a l _s t a t u s P L A G U E (c) Symptoms Dis 2 Vec SGNS SGHS CBOW v e t e r i n a r i a n a n i m a l e x p o s u r e s l a u g h t e r f a r m e r h e a l t h c a r e _w o r k e r t r a v e l v e t e r i n a r i a n a n i m a l s c h o o l c h i l d h e a l t h c a r e _w o r k e r e x p o s u r e a n i m a l t r a v e l m a s s _g a t h e r i n g s l a u g h t e r w e a k e n e d _i m m u n e _s y s t e m t r a v e l m a r k e t h e a l t h c a r e _w o r k e r H 7 N 9 (d) Exposures Dis 2 Vec SGNS SGHS CBOW m a s s _g a t h e r i n g s l a u g h t e r a n i m a l v e t e r i n a r i a n h e a l t h c a r e _f a c i l i t y s l a u g h t e r m a s s _g a t h e r i n g a n i m a l v e t e r i n a r i a n h e a l t h c a r e _f a c i l i t y s l a u g h t e r m a s s _g a t h e r i n g a n i m a l h e a l t h c a r e _w o r k e r e x p o s u r e a n i m a l m a s s _g a t h e r i n g f a r m e r v e t e r i n a r i a n s l a u g h t e r A V I A N _I N F L U E N Z A (e) Exposures Dis 2 Vec SGNS SGHS CBOW t r a v e l h e a l t h c a r e _f a c i l i t y v e t e r i n a r i a n h e a l t h c a r e _w o r k e r c h i l d a n i m a l m a s s _g a t h e r i n g t r a v e l e x p o s u r e v e t e r i n a r i a n a n i m a l v e t e r i n a r i a n e x p o s u r e s c h o o l c h i l d m a s s _g a t h e r i n g m a r k e t e x p o s u r e v e t e r i n a r i a n m a s s _g a t h e r i n g h e a l t h c a r e _f a c i l i t y P L A G U E (f) Exposures Dis 2 Ve c S GNS SGHS C B OW w i l d _a n i m a l f l e a d o m e s t i c _a n i m a l b u s h m e a t f o m i t e b u s h m e a t b u s h m e a t d o m e s t i c _a n i H 7 N 9 (g) T ransmission Agents Dis 2 Vec SGNS SGHS CBOW d o m e s t i c _a n i m a l w i l d _a n i m a l d o m e s t i c _a n i m a l w i l d _a n i m a l d o m e s t i c _a n i m a l f o m i t e m o s q u i t o f l y A V I A N _I N F L U E N Z A (h) T ransmission Agents Dis 2 Vec SGNS SGHS CBOW f l e a b u s h m e a t b u s h m e a t f l e a f l e a b u s h m e a t w i l d _a n i m a l t i c k P L A G U E (i) T ransmission Agents Dis 2 Vec SGNS SGHS CBOW a i r b o r n e z o o n o t i c z o o n o t i c a i r b o r n e z o o n o t i c a i r b o r n e d r o p l e t v e c t o r b o r n e H 7 N 9 (j) T ransmission Method Dis 2 Vec SGNS SGHS CBOW z o o n o t i c a i r b o r n e z o o n o t i c v e c t o r b o r n e z o o n o t i c d i r e c t _c o n t a c t e n v i r o n m e n t a l v e c t o r b o r n e A V I A N _I N F L U E N Z A (k) T ransmission Method Dis 2 Vec SGNS SGHS CBOW v e c t o r b o r n e d i r e c t _c o n t a c t d i r e c t _c o n t a c t a i r b o r n e w a t e r b o r n e z o o n o t i c e n v i r o n m e n t a l d r o p l e t P L A G U E (l) T ransmission Method Figure 4. Case study for emerging, endemic and rare diseases: Disease characterization accuracy plot for Dis2V ec (first quadrant, red), SGNS (second quadrant, blue), SGHS (third quadrant, green), and CBO W (fourth quadrant, orange) w .r .t. H7N9 (left, emerging), a vian influenza (middle, endemic) and plague (right, rare). The shaded area in a quadrant indicates the cosine similarity (scaled between 0 and 1) of the top words found for the category of interest using corresponding model, as ev aluated against the human annotated words (see T able 1 ). The top words found for each model is sho wn in the corresponding quadrant with radius equal to its av erage similarity with the human annotated words for the disease. Dis2V ec sho ws best overall performance with noticeable improv ements for symptoms w .r .t. all diseases. 15/ 15
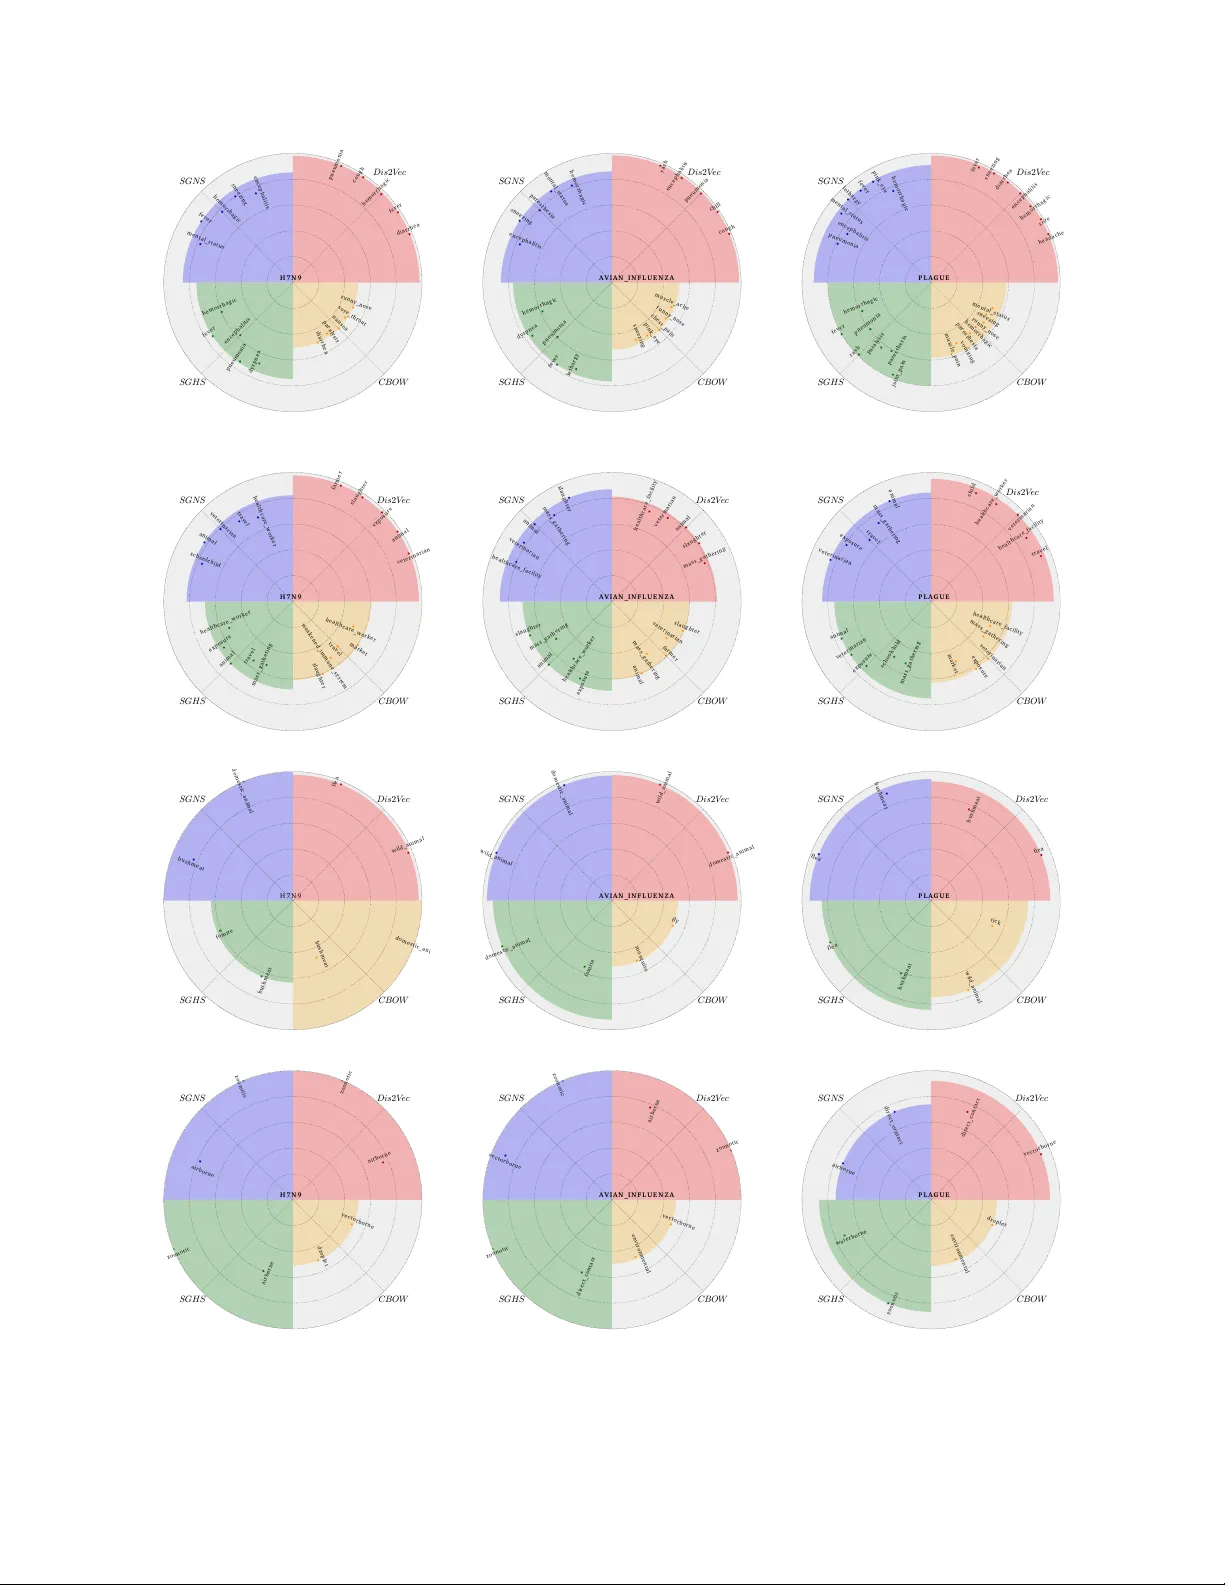
Original Paper
Loading high-quality paper...
Comments & Academic Discussion
Loading comments...
Leave a Comment