The Z-loss: a shift and scale invariant classification loss belonging to the Spherical Family
Despite being the standard loss function to train multi-class neural networks, the log-softmax has two potential limitations. First, it involves computations that scale linearly with the number of output classes, which can restrict the size of proble…
Authors: Alex, re de Brebisson, Pascal Vincent
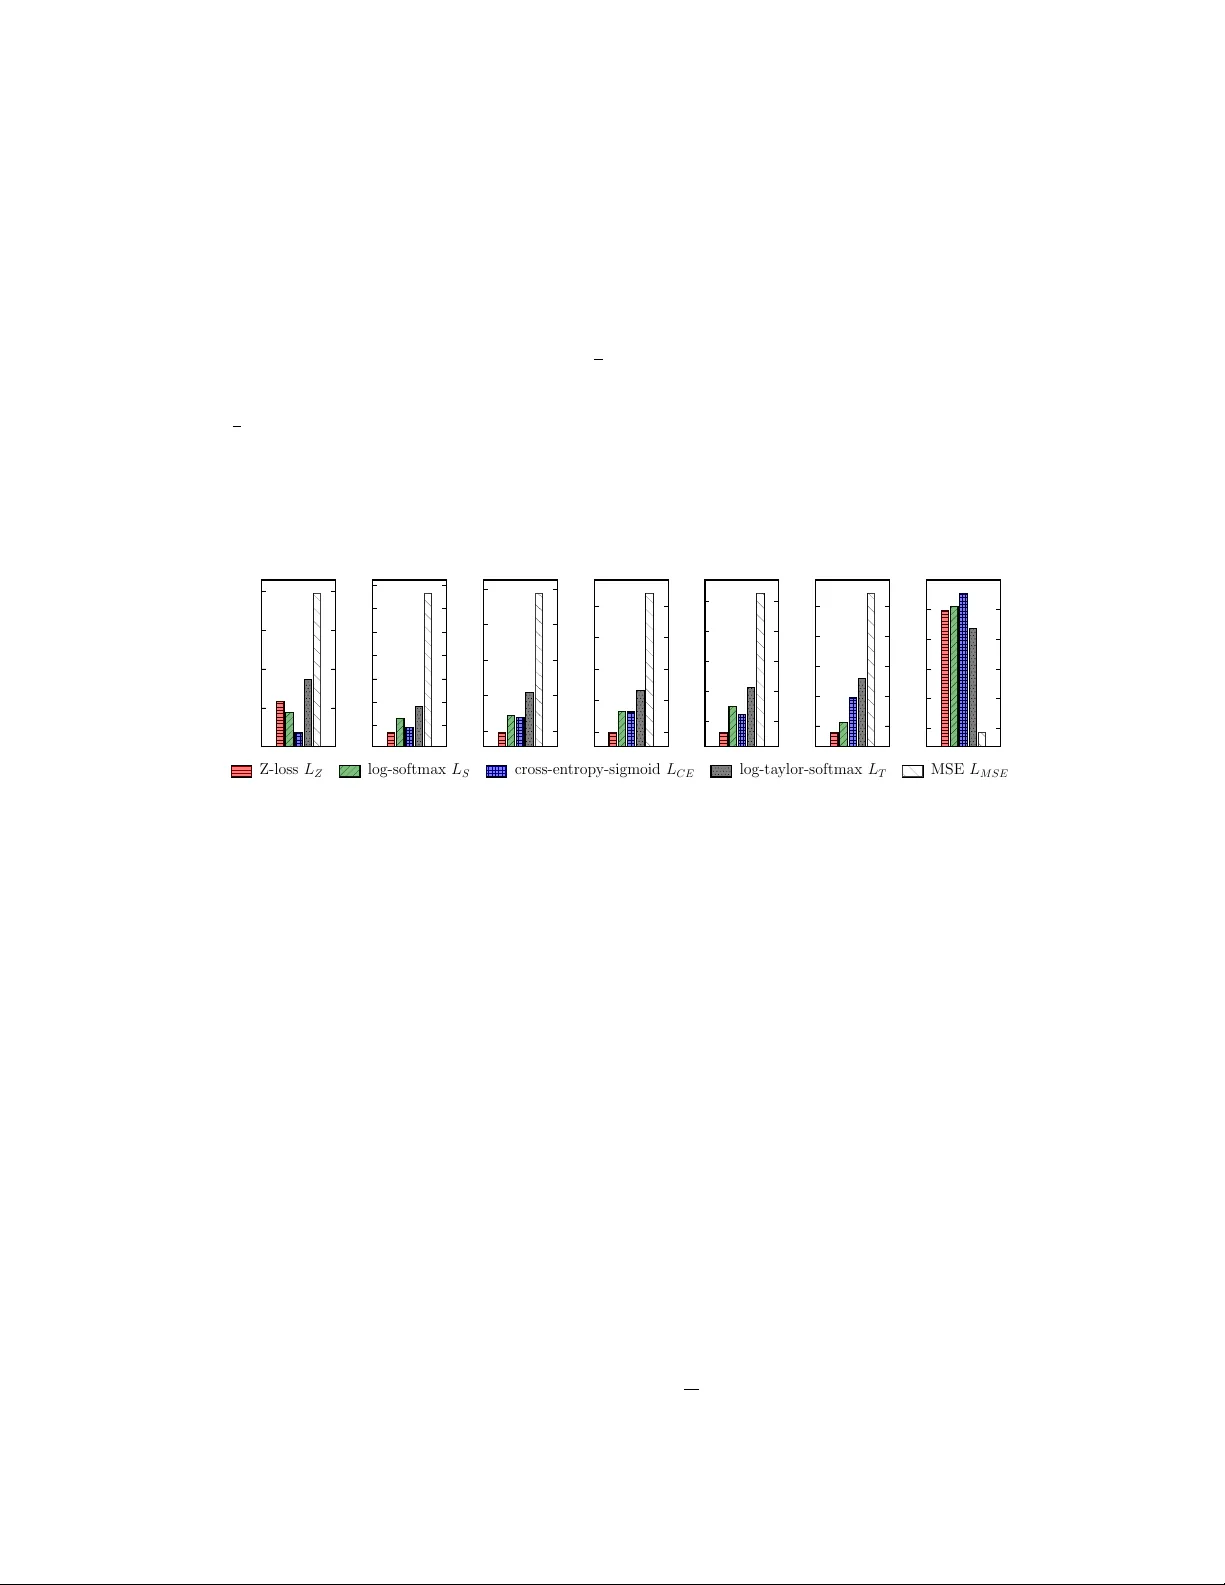
The Z-loss: a shift and scale in variant classification loss belonging to the Spherical F amily Alexandre de Brébisson MILA, Univ ersity of Montréal alexandre.de.brebisson@umontreal.ca Pascal V incent MILA, Univ ersity of Montréal and CIF AR vincentp@iro.umontreal.ca Abstract Despite being the standard loss function to train multi-class neural netw orks, the log-softmax has two potential limitations. First, it inv olves computations that scale linearly with the number of output classes, which can restrict the size of problems that we are able to tackle with current hardw are. Second, it remains unclear how close it matches the task loss such as the top-k error rate or other non- dif ferentiable e valuation metrics which we aim to optimize ultimately . In this paper , we introduce an alternative classification loss function, the Z-loss, which is designed to address these two issues. Unlike the log-softmax, it has the desirable property of belonging to the spherical loss family (V incent et al., 2015), a class of loss functions for which training can be performed v ery efficiently with a comple xity independent of the number of output classes. W e show experimentally that it significantly outperforms the other spherical loss functions previously published and in vestigated. Furthermore, we show on a w ord language modeling task that it also outperforms the log-softmax with respect to certain ranking scores, such as top-k scores, suggesting that the Z-loss has the fle xibility to better match the task loss . These qualities thus makes the Z-loss an appealing candidate to train very efficiently large output networks such as w ord-language models or other extreme classification problems. On the One Billion W ord (Chelba et al., 2014) dataset, we are able to train a model with the Z-loss 40 times f aster than the log-softmax and more than 4 times faster than the hierarchical softmax. Introduction Classification tasks are usually associated to a loss function of interest, the task loss , which we aim to minimize ultimately . T ask losses , such as the classification error rate, are most of the time non-differentiable, in which case a dif ferentiable surr ogate loss has to be designed so that it can be minimized with gradient-descent. This surr ogate loss act as a proxy for the task loss : by minimizing it, we hope to minimize the task loss . The most common surro gate loss for multi-class classification is the negati ve log-softmax, which corresponds to maximizing the log-likelihood of a probabilistic classifier that computes class probabil- ities with a softmax. Despite being ubiquitous, it remains unclear to which degree it matches the task loss and why the softmax is being used rather than alternati ve normalizing functions. T raditionally , other loss functions hav e also been used to train neural networks for classification, such as the mean square error after sigmoid with 0-1 targets, or the cross-entropy after sigmoid, which corresponds to each output being modeled independently as a Bernoulli variable. Multi-class generalisation of margin losses (Maksim Lapin and Schiele, 2015) and ranking losses (Nicolas Usunier and Gallinari, 2009; W eston et al., 2011) can also be used when a probabilistic interpretation is not required. Although these loss functions appear to perform similarly on small scale problems, the y seem to behav e very differently on larger output problems, such as neural language models (Bengio et al., 2001). Therefore, in order to better e valuate the dif ference between the loss functions, we decided to focus our experiments on language models with a lar ge number of output classes (up to 793471). Note that computations for all these loss functions scale linearly in the number of output classes. In this paper , we introduce a ne w loss function, the Z-loss, which, contrary to the log-softmax or other mentioned alternati ves, has the desirable property of belonging to the spherical family of loss functions, for which the algorithmic approach of V incent et al. (2015) allows to compute the exact gradient updates in time and memory comple xity independent of the number of classes. If we denote d the dimension of the last hidden layer and D the number of output classes, for a spherical loss, the exact updates of the output weights can be computed in O ( d 2 ) instead of the naive O ( d × D ) implementation, i.e. independently from the number of output classes D . The gist of the algorithm is to replace the costly dense update of output matrix W by a sparse update of its factored representation V U and to maintain summary statistics of W that allo w computing the loss in O ( d 2 ) . W e refer the reader to the aforementioned paper for the detailed description of the approach. Se veral spherical loss functions hav e already been inv estigated (Brébisson and V incent, 2016) b ut they do not seem to perform as well as the log-softmax on large output problems. Sev eral other workarounds hav e been proposed to tackle the computational cost of huge softmax layers and can be divided in two main approaches. The first are sampling-based approximations, which compute only a tin y fraction of the output’ s dimensions (Gutmann and Hyvarinen, 2010; Mikolov et al., 2013; Mnih and Kavukcuoglu, 2013; Shriv astav a and Li, 2014; Ji et al., 2016). The second is the hierarchical softmax, which modifies the original architecture by replacing the large output softmax by a heuristically defined hierarchical tree (Morin and Bengio, 2005; Mikolo v et al., 2013). Chen et al. (2015) benchmarked many of these methods on a language modeling task and among those they tried, they found that for very lar ge vocab ularies, the hierarchical softmax is the fastest and the best for a fix ed budget of training time. Therefore we will also compare the Z-loss to the hierarchical softmax. Notations: In the rest of the paper , we consider a neural network with D outputs. W e denote by o = [ o 1 , ..., o k , ..., o D ] the output pre-acti vations, i.e. the result o = W h of the last matrix multiplication of the network, where h is the representation of the last hidden layer . c represents the index of the tar get class, whose corresponding output activ ation is thus o c . 1 Common multi-class neural network loss functions In this section, we briefly describe the different loss functions against which we compare the Z-loss. 1.1 The log-softmax loss function The standard loss function for multi-class classification is the log-softmax, which corresponds to minimizing the negati ve log-likelihood of a softmax model. The softmax activ ation function models the output of the network as a categorical distribution, its i th component being defined as softmax i ( o ) = exp( o i ) / P D k =1 exp( o k ) . W e note that the softmax is in variant to shifting o by a constant but not to scaling. Maximizing the log-likelihood of this model corresponds to minimizing the classic log-softmax loss function L S : L S ( o , c ) = − log softmax c ( o ) = − o c + log D X k =1 exp( o k ) , whose gradient is ∂ L S ∂ o c = − 1 + softmax c ( o ) and ∂ L S ∂ o k k 6 = c = softmax k ( o ) . Intuitively , mimimizing this loss corresponds to maximizing o c and minimizing the other o k . Note that the sum of the gradient components is zero, reflecting the competition between the activ ations o . 1.2 Pre viously in vestigated spherical loss functions Recently , V incent et al. (2015) proposed a novel algorithmic approach to compute the exact updates of the output weights in a v ery efficient fashion, independently of the number of classes, provided that the loss belongs to a particular class of functions, called the spherical family . This family is composed of the functions that can be expressed using only o c , the squared norm of the whole output vector P D i o 2 i and P D i o i : L D X i o i , D X i o 2 i , o c ! . 2 The Mean Square Err or : The MSE after a linear mapping (with no final sigmoid non-linearity) is the simplest member of the spherical family . It is defined as L M S E ( o , c ) = 1 2 P D k =1 ( o k − δ kc ) 2 . The form of its gradient is similar to the log-softmax and its components also sums to zero: ∂ L M SE ∂ o c = − 1 + o c and ∂ L M SE ∂ o k k 6 = c = − o k . Contrary to the softmax, the MSE penalizes ov erconfident high values of o c , which is known to slo w down training. The log-T aylor -softmax : Sev eral loss functions belonging to the spherical f amily hav e recently been in vestigated by Brébisson and V incent (2016), among which the T aylor Softmax was retained as the best candidate. It is obtained by replacing the exponentials of the softmax by their second-order T aylor e xpansions around zero: ta ylor _ softmax i ( o ) = 1 + o i + 1 2 o 2 i P n k =1 (1 + o k + 1 2 o 2 k ) . The components are still positive and sum to one so that it can model a categorical distribution and can be trained with maximum likelihood. W e will refer to this corresponding loss as the T aylor-softmax loss function: L T ( o , c ) = − log(taylor _ softmax c ( o )) . Although the T aylor softmax performs slightly better than the softmax on small output problems such as MNIST and CIF AR10, it does not scale well with the number of output classes (Brébisson and V incent, 2016). 1.3 Hierarchical softmax Chen et al. (2015) benchmark ed many dif ferent methods to train neural language models. Among the strategies the y tried, they found that for very lar ge vocab ularies, the hierarchical softmax (Morin and Bengio, 2005; Mik olov et al., 2013) is the f astest and the best for a fixed budget of training time. Therefore we also compared the Z-loss to it. The hierarchical softmax modifies the original architecture by replacing the softmax by a heuristically defined hierarchical tree. 2 The proposed Z-loss Let µ and σ be the mean and the standard de viation of the pre-activ ations o of the current example: µ = P D k =1 o k / D and σ 2 = P D k =1 o 2 k / D − µ 2 . W e define the Z-normalized outputs z = [ z 1 , ..., z n ] as z k = o k − µ σ , which we use to define the Z-loss as L Z ( o , c ) = L Z ( z c ) = 1 a softplus( a ( b − z c )) = 1 a log 1 + exp a b − o c − µ σ , (1) where a and b are two hyperparameters controlling the scaling and the position of the vector z c . The Z-loss can be seen as a function of a single variable z c and is plotted in Figure 1. The Z-loss clearly belongs to the spherical family described in section 1.2. It can be decomposed into three successiv e operations: the normalization of o into z (which we call Z-normalization), the scaling/shift of z (controlled with a and b ) and the softplus . Let us analyse these three stages successi vely . Figure 1: Plot of the Z-loss L Z in function of z c = o c − µ σ for D = 1000 , a = 0 . 1 and b = 10 . The hyperparameter a controls the softness of the softplus . The dashed grey line represents the asymptote while z c tends to −∞ . z c is bounded between − √ D − 1 and √ D − 1 . 10 5 0 5 10 15 20 25 30 35 z c 0 5 10 15 20 L Z log(2) a b z c 7! z c + b L Z z c > p D 1 Z-normalization : The normalization of o into z , which we call Z-normalization, is essential in order to in volv e all the different output components o k in the final loss. W ithout it, the loss would only depend on o c and not on the other o k , resulting in a null gradient with respect to the other o k . Thus, thanks to the normalization, the pre-activ ations o compete against each other and there are three interlinked w ays to increase z c (i.e. minimizing the loss): either increase o c , or decrease µ or 3 decrease σ . This behavior is similar to the log-softmax. Furthermore, this standardization makes the Z-loss inv ariant to both shifting and scaling of the outputs o , whereas the log-softmax is only in variant to shifting. Note that the rank the classes is unaffected by global shifting and scaling of the pre-acti vations o , and so are any rank-based task losses such as precision at k . Since the Z-loss is similarly in variant, while the log-softmax is sensiti ve to scale, this may make the Z-loss a better surrogate for rank-based task losses . The gradient of the Z-loss with respect to o is simply the gradient of z c times the deri vati ve of the softplus. The gradient of z c with respect to o can be written as ∂ z c ∂ o c = 1 D σ z 2 c − D + 1 and ∂ z c ∂ o k k 6 = c = 1 D σ ( z c z k − 1) . The sum of the gradient components is zero, enforcing the pre-acti vations to compete against each other . It equals zero when: ∂ z c ∂ o c = 0 ⇔ z 2 c = D − 1 and ∂ z c ∂ o k k 6 = c = 0 ⇔ z k = 1 z c . Therefore z c is bounded between − √ D − 1 and √ D − 1 . The gradient of the Z-loss with respect to o is simply the gradient of z c times the deriv ative of the softplus, which is sigmoid : ∂ L Z ∂ o c = 1 D σ z 2 c − D + 1 sigmoid( a ( b − z c )) and ∂ L Z ∂ o k k 6 = c = 1 D σ ( z c z k − 1) sigmoid( a ( b − z c )) , where sigmoid denotes the logistic sigmoid function defined as sigmoid( x ) = 1 1+exp( − x ) . Like z c , the components still sum to one and the Z-loss reaches its minimum when z ∗ c = √ D − 1 and ∀ k 6 = c : z ∗ k = − 1 √ D − 1 , for which an infinite number of corresponding o vectors are possible (if o ∗ is solution, then for any α and β , α o ∗ + β is also solution). Unlik e the Z-loss, the log-softmax does not hav e such fixed points and, as a result, its minimization could potentially push o to extreme v alues. Note that this Z-normalization is different from that used in batch normalization (Iof fe and Szegedy, 2015). Ours applies across the dimensions of the output for each example, whereas batch normaliza- tion separately normalizes each output dimension across a minibatch. Scaling and shifting : The normalized acti vations z are then scaled and shifted by the af fine map z 7→ a ( z − b ) . These two hyperparameters are essential to allow the Z-score to better match the task loss , which we are ultimately interested in. In particular, we will see later that the optimal values of these parameters significantly vary depending on the specific task loss we aim to optimize. a controls the softness of the softplus , a large a making the softplus closer to the rectifier function ( x 7→ max (0 , x ) ). Note that the effect of changing a and b cannot be cancelled by correspondingly modifying the output layer weights W . This contrasts with the other classic loss functions, such as the log-softmax, for which the effect could be undone by reciprocal rescaling of W as discussed further in Section 2. Softplus : The softplus ensures that the deriv ative with respect to z c tends tow ards zero as z c grows. W ithout it, the deriv ativ e would always be − 1 , which would strongly push z c tow ards extreme values (still bounded by √ D − 1 ) and potentially employ unnecessary capacity of the network. W e can also moti vate the choice of using a softplus function by deriving the Z-loss from a multi-label classification perspectiv e (non-mutually-exclusi ve classes). Let Y be the random variable representing the class of an example, it can take v alues between 1 and D . Let us consider now the multi-label setup in which we aim to model each output Y k = δ Y = k as a Bernoulli law whose parameter is gi ven by a sigmoid P ( Y k = 1) = sigmoid( o k ) . Then, the probability of class c can be written as the probability of Y c being one times the probabilities of the other Y k being zero: P ( Y = c ) = P ( Y c = 1) Q k 6 = c P ( Y k = 0) . Minimizing the negati ve log-likelihood of this model leads to the follo wing cross-entropy-sigmoid loss: L C E ( o , c ) = − log( P ( Y = c )) = softplus( − o c ) + X k 6 = c softplus( o k ) . If we only minimize the first term and ignore the others, the values of o would systematically decrease and the network would not learn. If instead we keep only the first term but apply the Z-normalization beforehand, we obtain the Z-loss, as defined in equation 1. W e claim that the Z-normalization compensates the approximation, as the ignored term is more likely to stay approximati vely constant 4 because it is now in variant to shift and scaling of o . In our experiments, we will e valuate the L C E along the Z-loss. Generaliszation: Z-normalization befor e any classic loss functions : The Z-normalization could potentially be applied to any other classic loss functions (the resulting loss functions would always be scale and shift in variant). Therefore, we also compared the Z-loss to the Z-normalized version of the log-softmax L S . The shifting parameter b is useless as the softmax is shift-in variant. W e denote L S − Z the corresponding Z-normalized loss function: L S − Z ( o , c ) = − 1 a log(softmax c ( a z )) . Note that this is dif ferent from simply scaling the output acti vations o with a : L ( o , c ) = − 1 a log(softmax c ( a o )) . In that latter case, contrary to L S − Z , the effect of a could be undone by reciprocal rescaling of W . 3 Experiments 0 . 75 0 . 76 0 . 77 0 . 78 0 . 79 score v alues top1 0 . 57 0 . 58 0 . 59 0 . 60 0 . 61 0 . 62 0 . 63 top5 0 . 48 0 . 50 0 . 52 0 . 54 0 . 56 top10 0 . 40 0 . 42 0 . 44 0 . 46 0 . 48 top20 0 . 32 0 . 34 0 . 36 0 . 38 0 . 40 top50 0 . 26 0 . 28 0 . 30 0 . 32 0 . 34 top100 0 . 29 0 . 30 0 . 31 0 . 32 0 . 33 0 . 34 ARR Z-loss L Z log-softmax L S cross-en trop y-sigmoid L CE log-ta ylor-softmax L T MSE L MS E Figure 2: T op-k error rates and Mean Reciprocal Rank (MRR, equiv alent to the Mean A verage Precision) obtained by our best models for each loss function on the Penn Tree Bank language modeling task. The Mean-Square-Error (MSE) has the worst performance, followed by the T aylor - Softmax. The cross-entropy-sigmoid has the lowest top-1 error rate and surprisingly outperforms the log-softmax. The Z-loss has the lowest top-{5,10,20,50,100} error rates (the hyperparameters a and b were tuned individually for each top-k). Brébisson and V incent (2016) already conducted experiments with se veral spherical losses (the T aylor/Spherical softmax and the Mean Squared Error) and showed that, while they work well on problems with few classes, the y are outperformed by the log-softmax on problems with a large number of output classes. Therefore we focused our experiments on those problems and in particular on word-le vel language modeling tasks for which large datasets are publicly av ailable. The task of word-language modeling consists in predicting the next word follo wing a sequence of consecutiv e words called a n -gram, where n is the length of the sequence. For e xample, "A man eats an apple" is a 5-gram and "A man eats an" can be used as an input sequence context to predict the target w ord "apple". Neural language models (Bengio et al., 2001) tackles this classification task with a neural network, whose number of outputs is the size of the v ocabulary . As the Z-loss does not produce probabilities, we cannot compute likelihood or perplexity scores comparable to those naturally computed with the log-softmax model. Therefore we instead ev aluated our dif ferent loss functions on the following scores (which are often considered as the ultimate task losses ): top-{1,5,10,20,50,100} error rates and the mean reciprocal rank (equiv alent to the mean av erage precision in the context of multi-class classification), defined below . Let r c be the rank of the pre-activ ation o c among o , it can take v alues in [1 , ..., D ] . If r c = 1 , the point is well-classified. T op-k error rate : The top-k error rate is defined as the mean of the boolean random variable defined as r c ≤ k . It measures ho w often the target is among the k highest predictions of the network. Mean Reciprocal Rank (MRR) : It is defined as the mean of 1 r c . A perfect classification would lead to r c = 1 for all e xamples and thus an MRR of 1 . The MRR is identical to the Mean A verage Precision in the context of classification. These are popular score measures for ranking in the field of information retriev al. 5 3.1 Penn T ree bank W e first trained word-lev el language models on the classic Penn tree bank (Marcus et al., 1993), which is a corpus split into a training, v alidation and testing set of 929k words, a validation set of 73k words, and a test set of 82k words. The vocab ulary has 10k words. W e trained typical feed-forward neural language models with v anilla stochastic gradient descent on mini-batches of size 250 using an input context of 6 words. For each loss function, we tuned the embedding size, the number of hidden layers, the number of neurons per layer, the learning rate and the hyperparameters a and b for the Z-loss. Figure 2 reports the final test scores obtained by the best models for each loss and each ev aluation metric. As can be seen, the Z-loss significantly outperforms the other considered losses with respect to the top-{5,10,20,50,100} error rates. T o measure to which extent the hyperparameters a and b control how the Z-loss matches the task losses , we trained se veral times the same architecture for dif ferent values of a . The results are reported in Figure 3. Figure 4 sho ws the training curves of our best Z-score models for the top-{1,5,10,50} error rates respecti vely . W e can see that the hyperparameters a and b drastically modify the training dynamics and they are thus e xtremely important to fit the particular ev aluation metric of interest. Figure 3: top-{1,5,10} error rates for Z-loss models trained on the Penn T ree Bank dataset which differ only in the value of their hyperparameter a . More precisely , for each v alue of a , a sepa- rate model has been trained from scratch. b = 28 for all models. The three curves hav e very different shapes with dif ferent minima, sho wing that a (and b to a lesser extent) gi ves to the surr ogate Z-loss the flexibility to better fit the task loss . 10 2 10 1 10 0 a 0.76 0.77 0.78 0.79 0.80 top-k error top-1 10 2 10 1 10 0 a 0.57 0.57 0.58 0.58 0.59 0.59 0.60 0.60 top-5 10 2 10 1 10 0 a 0.49 0.50 0.51 0.52 0.53 top-10 0 10000 20000 Number of minibatches 0 . 76 0 . 78 0 . 80 0 . 82 0 . 84 top1 error rate 0 10000 20000 Number of minibatches 0 . 56 0 . 58 0 . 60 0 . 62 0 . 64 top5 error rate 0 10000 20000 Number of minibatches 0 . 48 0 . 50 0 . 52 0 . 54 0 . 56 top10 error rate 0 10000 20000 Number of minibatches 0 . 32 0 . 34 0 . 36 0 . 38 0 . 40 top50 error rate a=0.051, b=28, b est for top1 a=0.109, b=15, b est for top5 a=0.209, b=13, b est for top10 a=0.461, b=11, b est for top50 Figure 4: Evolution of the validation top-{1,5,10,50} error rates during training on the Penn Tree Bank dataset for four Z-loss language models with different combinations of hyperparameters a and b . Each of the four combinations has been chosen to minimize a particular top-k error rate. For example, the dashed green curve corresponds to the best model obtained with respect to the top-5 error rate. In particular we can see that the best top-1 model is the worst top-50 model and vice versa. The very high variations between top-k plots sho w how the hyperparameters a and b allow to better match the task loss . In contrast, the classic log-softmax lack these flexibility hyperparameters. Figure 5 reports the test scores obtained by our best Z-normalized versions of the log-softmax. As previously e xplained in section 2, the Z-normalization enables adding scaling hyperparameters a and b , which also help the log-softmax to better match the the top-k ev aluation metrics but not as much as the Z-loss. 3.2 One Billion W ord W e also trained w ord-level neural language models on the One Billion W ord dataset (Chelba et al., 2014), a considerably larger dataset than Penn T ree Bank. It is composed of 0.8 billion words belonging to a vocabulary of 793 471 words. Given the size of the dataset, we were not able to extensi vely tune the architecture of our models, nor their hyperparameters. Therefore, we first compared all the loss functions on a fixed architecture, which is almost identical to that of Chen et al. (2015): 10-grams concatenated embeddings representing a layer of 512*10=5120 neurons and 6 Figure 5: Comparison of top-{1,10,50} test error rates obtained by our best mod- els for the Z-loss and loss functions with hyperparameters on the Penn T ree Bank language modeling task. The h yperpa- rameters added to the log-softmax and cross-entropy do not seem to have an effect as important as for the Z-loss b ut still impro ve slightly the final scores. For the Z-loss, the Z-normalization is crucial and removing it would pre vent any mean- ingful learning. 0 . 757 0 . 758 0 . 759 0 . 760 0 . 761 0 . 762 score values top1 0 . 478 0 . 480 0 . 482 0 . 484 0 . 486 0 . 488 top10 0 . 315 0 . 320 0 . 325 0 . 330 top50 Z-loss L Z log-softmax L S log-softmax Z-normalized L S Z three hidden layers of sizes 2048, 2048 and 512. W e will refer to this architecture as net1 . From our experiments and those of Chen et al. (2015), we expect that more than 40 days w ould be required to train net1 with a nai ve log-softmax layer until con ver gence (on a high-end T itan X GPU). Among the workarounds that Chen et al. (2015) benchmarked, the y showed that the hierarchical softmax is the fastest and best method for a fixed budget of time. Therefore, we only compared the Z-loss to the hierarchical softmax (a two-layer hierarchical softmax, which is most efficient in practice due to the cost of memory accesses). The architecture net1 being fixed, we only tuned the initial learning rate for each loss function and periodically decreased it when the validation score stoped improving. T able 1 and 2 report the timings and con vergence scores reached by the three loss functions with architecture net1 . Although the hierarchical softmax yields slightly better top-k performance, the Z-loss model is more than 4 times faster to conv erge. This allows to train bigger Z-loss models in the same amount of time as the hierarchical softmax, and thus we trained a bigger Z-loss model with an architecture net2 of size [1024*10= 10240, 4096, 4096, 1024, 793471] in less than the 4.08 days required by the hierarchical softmax with architecture net1 to con ver ge. As seen in table 2, this new model has a better top-1 error rate than the hierarchical softmax after only 3.14 days. It is very likely that another set of hyperparameters (a, b) would yield lo wer top-20 error rates as well. T able 1: T raining timings to process 1 epoch ov er the training data of the One Billion W ord dataset (around 150 millions n-grams) for the different loss functions with the architecture net1 , i.e. a feedforward network composed of 5 layers of sizes [5120, 2048, 2048, 512, 793471], with a batch size of 200. The GPU used is an Nvidia T itan X while the CPU is an Intel i7-5930K CPU @ 3.50GHz. W e gi ve the timings for both the whole model and the output layer only . W e only timed a few thousands minibatches and extrapolated the timings for the whole epoch. T imings CPU T imings GPU Loss function whole model output only whole model output only softmax 78.5 days 69.7 days 4.56 days 4.44 days H-softmax / / 12.23 h 10.88 h Z-loss 7.50 days 8.68 h 2.81 h 1.24 h T able 2: Final test top-1 and top-20 error rates on the One Billion W ord language modeling task. The "Constant" line corresponds to a constant classifier predicting the frequencies of the words. The hierarchical softmax reaches a final perplexity of 80 (competiti ve with Chen et al. (2015)). The hyperparameters a and b of the Z-loss model with both architectures net2 and net1 hav e been tuned to maximize the top-1 error rate. The GPU used is an Nvidia Titan X. Loss function Architecture T op-1 error rate T op-20 error rate T otal training time Constant / 95.44 % 65.58 % / Softmax net1 / / about 40 days H-softmax net1 71.0 % 35.73 % 4.08 days Z-loss net1 72.13 % 36.43 % 0.97 days Z-loss net2 70.77 % 38.29 % 3.14 days net1 : 5 layers of sizes [10*512, 2048, 2048, 512, 793471], batch size of 200, net2 : 5 layers of sizes [10*1024, 4096, 4096, 1024, 793471], batch size of 1000. 7 4 Discussion The cross-entropy sigmoid outperforms the log-softmax in our experiments on the Penn T ree Bank dataset with respect to the top-{1,5,10,20,50} error rates. This is surprising because the cross-entropy sigmoid models a multi-label distribution rather than a multi-class one. This might e xplain why the Z-loss, which can be seen as an approximation of the cross-entropy sigmoid (see Section 2), performs so well: it is slightly worse than the log-softmax for the top-1 error b ut outperforms both the softmax and the cross-entropy sigmoid for the other top-k. It very significantly outperforms the other in vestigated spherical loss functions, namely the T aylor softmax and the Mean Square Error . Our results sho w that the two hyper -parameters a and b of the Z-loss are essential and allo w it to fit certain ev aluation metrics (such as top-k scores) more accurately than the log-softmax. W e saw that we can also add hyperparameters to any traditional loss function by applying the Z-normalization beforehand. In particular these hyperparameters slightly improve the performance of the log-softmax ev en though their effect is not as important as with the Z-loss (Figure 5). In practice, the hyperpa- rameters of the Z-loss are simple to tune, we found that running the search on the first iterations is sufficient. For the top-k error rates, the hyperparameter a is more important than b : the higher it is, the better the top- k scores with a high k and vice versa. On the One Billion W ord language modeling task, the Z-loss models train considerably faster than the hierarchical softmax (a 4x speedup for the identical architecture net1 ) b ut is slightly worse with respect to the final top-k scores. Thanks to the speed of the Z-loss, we were able to train a significantly larger architecture ( net2 ) faster than the hierarchical softmax on a smaller architecture ( net1 ) and obtain slightly better top-1 error rate. The Z-loss top-20 score is not as good because the hyperparameters a and b were tune for the top-1. 5 Conclusion W e introduced a new loss function, the Z-loss, which aims to address two potential limitations of the naive log-softmax: the speed when the problem has a large amount of output classes and the discrepancy with the task loss that we are ultimately interested in. Contrary to the log-softmax, the Z-loss has the desirable property of belonging to the spherical family , which allo ws to train the output layer efficiently , independently from the number of classes 1 . On the One Billion W ord dataset with 800K classes, for a fixed standard network architecture, training a Z-loss model is about 40 times faster than the naive log-softmax version and more than 4 times faster than the hierarchical softmax. For a fix ed b udget of around 4 days, we were able to train a better Z-loss model than the hierarchical softmax with respect to the top-1 error rate. Complexity-wise, if D is the number of classes, the computations of the hierarchical softmax scale in log ( D ) in theory (in practice √ D for a memory-ef ficient 2-layer hierarchical softmax implementation), while those of the Z-loss are independent from the output size D . This suggests that the Z-loss would be better suited for datasets with ev en more classes, on which the hierarchical softmax would be too slo w . In addition to the huge speedups, the Z-loss also addresses the problem of the discrepancy between the task loss and the surr ogate loss . Thanks to a shift and scale in variant Z-normalization, the Z-loss benefits from two hyperparameters that can adjust, to some extent, how well the surr ogate Z-loss matches the task loss . W e showed e xperimentally that these hyperparameters can drastically improve the resulting task loss values, making them very desirable. On the Penn Tree Bank, our Z-loss models yield significantly lower top-{5,10,20,50,100} error rates than the log-softmax. Further research will focus on updating these hyperparameters automatically during training to ensure that the loss function dynamically matches the task loss as close as possible. Beyond the Z-loss, the Z-normalization is interesting on its o wn and can be applied to an y classic loss functions, such as the log-softmax, allowing to add hyperparameters to any loss function and potentially mitigating the discrepancy with the task loss . Further research should inv estigate generalizations of the Z-normalization in a more general framew ork than the Z-loss. 1 The source code of our efficient Z-loss implementation is av ailable online: https://github .com/pascal20100/factored_output_layer . 8 References P . V incent, A. d. Brébisson, and X. Bouthillier . Ef ficient exact gradient update for training deep networks with very lar ge sparse targets. NIPS , 2015. C. Chelba, T . Mikolo v , M. Schuster, Q. Ge, T . Brants, P . K oehn, and T . Robinson. One billion word benchmark for measuring progress in statistical language modeling. INTERSPEECH 2014 , 2014. M. H. Maksim Lapin and B. Schiele. T op-k multiclass svm. In NIPS , 2015. D. B. Nicolas Usunier and P . Gallinari. Ranking with ordered weighted pairwise classification. In ICML , 2009. J. W eston, S. Bengio, and N. Usunier . Wsabie: Scaling up to large v ocabulary image annotation. In Pr oceedings of the International Joint Confer ence on Artificial Intelligence, IJCAI , 2011. Y . Bengio, R. Ducharme, and P . V incent. A neural probabilistic language model. In NIPS 13 , 2001. A. d. Brébisson and P . V incent. An exploration of softmax alternati ves belonging to the spherical loss family . In International Conference on Learning Repr esentations , 2016. M. Gutmann and A. Hyv arinen. Noise-contrasti ve estimation: A ne w estimation principle for unnormalized statistical models. In Proceedings of The Thirteenth International Confer ence on Artificial Intelligence and Statistics (AIST ATS’10) , 2010. T . Mikolo v , I. Sutske ver , K. Chen, G. Corrado, and J. Dean. Distrib uted representations of words and phrases and their compositionality . In NIPS’2013 , pages 3111–3119. 2013. A. Mnih and K. Kavukcuoglu. Learning word embeddings ef ficiently with noise-contrastiv e estima- tion. In Advances in Neural Information Pr ocessing Systems 26 , pages 2265–2273. 2013. A. Shri vastav a and P . Li. Asymmetric LSH (ALSH) for sublinear time maximum inner product search (MIPS). In Advances in Neural Information Pr ocessing Systems 27 , pages 2321–2329. 2014. S. Ji, S. V ishwanathan, N. Satish, M. J. Anderson, and P . Dubey . Blackout: Speeding up recurrent neural network language models with very lar ge vocab ularies. ICLR , 2016. F . Morin and Y . Bengio. Hierarchical probabilistic neural network language model. In Pr oceedings of the T enth International W orkshop on Artificial Intelligence and Statistics , pages 246–252, 2005. W . Chen, D. Grangier, and M. Auli. Strategies for training large v ocabulary neural language models. arXiv pr eprint arXiv:1512.04906 , 2015. S. Iof fe and C. Szegedy . Batch normalization: Accelerating deep network training by reducing internal cov ariate shift. In Pr oceedings of the 32th International Conference on Machine Learning (ICML-15) , 2015. M. P . Marcus, M. A. Marcinkiewicz, and B. Santorini. Building a large annotated corpus of english: The penn treebank. Computational linguistics , 19(2):313–330, 1993. 9
Original Paper
Loading high-quality paper...
Comments & Academic Discussion
Loading comments...
Leave a Comment