The IBM Speaker Recognition System: Recent Advances and Error Analysis
We present the recent advances along with an error analysis of the IBM speaker recognition system for conversational speech. Some of the key advancements that contribute to our system include: a nearest-neighbor discriminant analysis (NDA) approach (…
Authors: Seyed Omid Sadjadi, Jason Pelecanos, Sriram Ganapathy
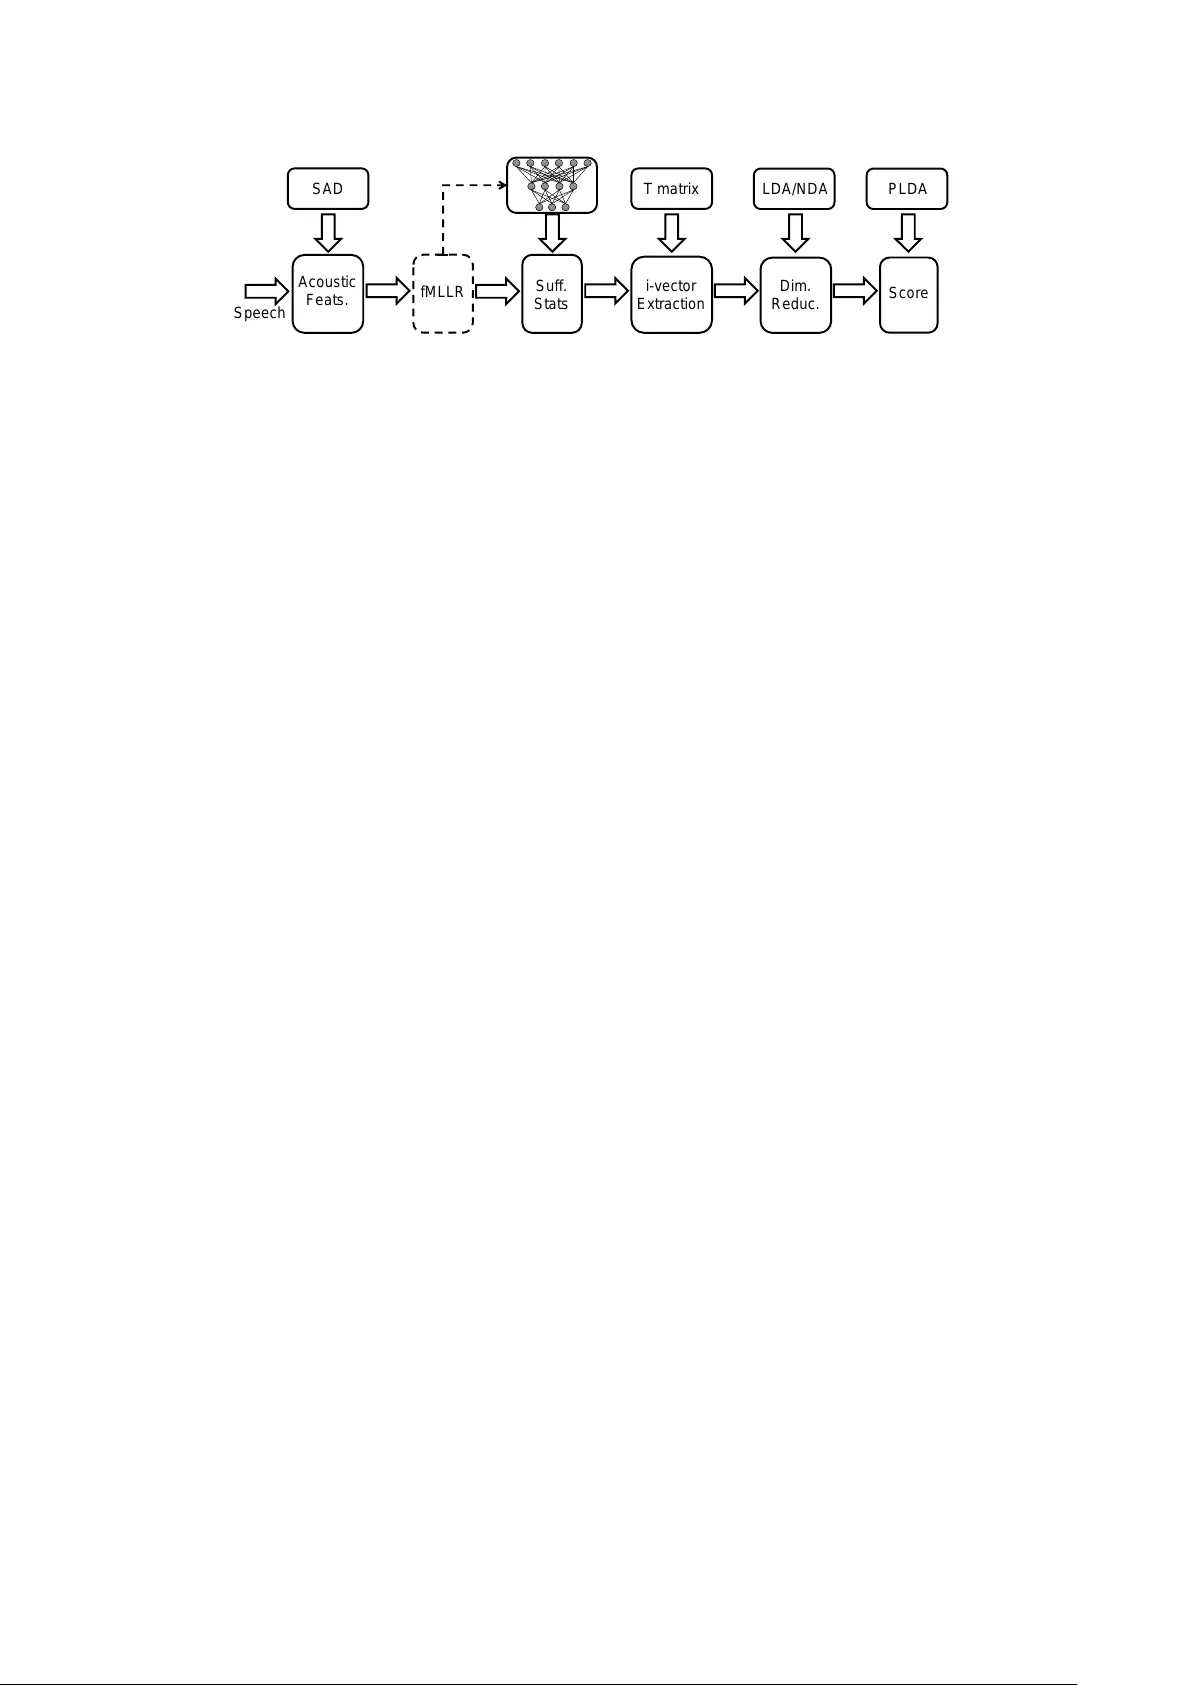
The IBM Speaker Recognition System: Recent Advances and Err or Analysis Se yed Omid Sadjadi 1 , J ason W . P elecanos 1 , Sriram Ganapathy 2 1 IBM Research, Y orkto wn Heights, NY , USA 2 Electrical Eng. Dept., Indian Institute of Science, Bangalore, India sadjadi@us.ibm.com Abstract W e present the recent advances along with an error analysis of the IBM speaker recognition system for con versational speech. Some of the k ey advancements that contribute to our system include: a nearest-neighbor discriminant analysis (ND A) ap- proach (as opposed to LDA) for intersession variability com- pensation in the i-vector space, the application of speaker and channel-adapted features deriv ed from an automatic speech recognition (ASR) system for speaker recognition, and the use of a DNN acoustic model with a very large number of output units ( ∼ 10 k senones) to compute the frame-le vel soft align- ments required in the i-vector estimation process. W e evaluate these techniques on the NIST 2010 SRE extended core condi- tions (C1–C9), as well as the 10sec–10sec condition. T o our knowledge, results achieved by our system represent the best performances published to date on these conditions. For exam- ple, on the extended tel-tel condition (C5) the system achiev es an EER of 0.59%. T o garner further understanding of the re- maining errors (on C5), we examine the recordings associated with the low scoring tar get trials, where v arious issues are iden- tified for the problematic recordings/trials. Interestingly , it is observed that correcting the pathological recordings not only improv es the scores for the target trials but also for the non- target trials. Index T erms : deep neural netw orks, discriminant analysis, fM- LLR, i-vector , nearest neighbor, speaker recognition 1. Introduction In recent years, the research trend in the speak er recognition field has ev olved from joint factor analysis (JF A) based meth- ods, which attempt to model the speak er and channel subspaces separately [1], tow ards the i-vector approach that models both speaker and channel variabilities in a single lo w-dimensional (e.g., a fe w hundred) space termed the total variability subspace [2]. State-of-the-art i-vector based speaker recognition systems employ universal background models (UBM), which are based on either unsupervised GMMs [3] or supervised ASR acous- tic models (e.g., GMM-HMM or DNN) [4, 5, 6], to generate frame-lev el soft alignments required in the i-vector estimation process. DNN Bottleneck and T andem features have also been explored for speaker recognition [7, 8] , and more recently suc- cessfully used in some state-of-the-art i-vector systems [9, 10]. The i-vectors are typically post-processed through a linear dis- criminant analysis (LD A) [11] stage to generate dimensionality reduced and channel-compensated features which can then be efficiently modeled and scored with various back ends such as a probabilistic LD A (PLD A) [12, 13]. In this paper , we report on the latest advancements made in the IBM i-vector speaker recognition system [14] for con ver- sational speech. Particularly , we describe the key components that contribute significantly to our system performance. These components include: 1) a nearest-neighbor based discriminant analysis (ND A) approach [15] for channel compensation in the i-vector space, which, unlike the commonly used Fisher LD A, is non-parametric and typically of full rank, 2) speaker- and channel-adapted features deri ved from feature-space maxi- mum lik elihood linear regression (fMLLR) transforms [16, 17], which are used both to train/ev aluate the DNN and to compute the sufficient Baum-W elch statistics for i-vector e xtraction, and 3) a DNN acoustic model with a large number of output units ( ∼ 10 k senones) to compute the soft alignments (i.e., the pos- teriors). T o quantify the contribution of these components, we ev aluate our system in the conte xt of speaker verification ex- periments using speech material from the NIST 2010 speaker recognition ev aluation (SRE) which includes 9 extended core tasks as well as a 10sec–10sec condition. Moti vated by the rel- ativ ely low speak er recognition error rates achieved by our sys- tem (e.g., 0.59% EER on C5 in SRE 2010), we also conduct an error analysis of low scoring target trials to gain insights re- garding the nature of the issues associated with the remaining system errors on C5. 2. System Overview In the following subsections, we briefly describe the major com- ponents of our speaker recognition system. A schematic block diagram of the system is depicted in Fig. 1. 2.1. DNN i-vector extraction The i-vector representation is based on the total variability modeling concept which assumes that speaker - and channel- dependent v ariabilities reside in the same lo w-dimensional sub- space [2]. In order to learn the bases for the total variability subspace, one needs to first compute the Baum-W elch statistics which are defined as, N g ( s ) = X t γ tg ( s ) , (1) F g ( s ) = X t γ tg ( s ) O t ( s ) , (2) where N g ( s ) and F g ( s ) denote the zeroth- and first-order statis- tics for speech session s , respectiv ely , with γ tg ( s ) being the posterior probability of the mixture component g giv en the ob- servation v ector O t ( s ) at time frame t . The observation vector O t ( s ) can be either the con ven- tional raw acoustic features such as MFCCs or their speaker- and channel-adapted versions which are computed through per recording fMLLR transforms [17, 16] typically obtained with a GMM-HMM system. Note from Fig. 1 that the same fMLLR transformed features can be used to train/e valuate the DNN i - v ector Extr ac ti on Ac ous ti c Feats . Speech SAD Suf f. Stats Dim. Reduc . T matr i x LDA/NDA Sc ore fMLLR PLDA Figure 1: Block diagram of the IBM speaker reco gnition system with fMLLR speaker- and channel-adapted features, DNN posterior based i-vectors, and ND A dimensionality r eduction. as well as compute the Baum-W elch sufficient statistics for i- vector e xtraction. T raditionally , the frame-le vel soft alignments, γ tg ( s ) , in (1) and (2) are computed with a GMM acoustic model trained in an unsupervised fashion (i.e., with no phonetic labels). Howe ver , in [4], a supervised GMM-HMM acoustic model (derived from a speech recognition system) was utilized to estimate the GMM- UBM hyperparameters for speaker recognition, assuming that class-conditional distributions for the v arious phonetic classes are Gaussian. More recently , inspired by the success of DNN acoustic models in the automatic speech recognition (ASR) field, [5] proposed the use of DNN senone (context-dependent triphones) posteriors for computing the soft alignments, γ tg ( s ) , which resulted in remarkable reductions in speaker recognition error rates. Motiv ated by these results, in this paper , we explore DNN i-vectors extracted with a very large number of senones for speak er recognition, and compare their effecti veness ag ainst GMM i-vectors on this task. 2.2. Near est-neighbor discriminant analysis (NDA) As noted previously , state-of-the-art speaker recognition sys- tems employ LDA for intersession variability compensation in the i-vector space. Ho we ver , there are some limitations asso- ciated with the parametric LDA where the underlying distribu- tion of classes is assumed to be Gaussian and unimodal. Nev er- theless, it is well known in the speaker recognition community that the actual distribution of i-vectors may not necessarily be Gaussian [18], particularly in the presence of noise and channel distortions [15, 19]. In addition, for the NIST SRE scenarios, speech recordings come from various sources (sometimes out- of-domain), therefore unimodality of the distributions cannot be guaranteed. In order to alleviate some of the limitations identified for LDA, a nonparametric nearest-neighbor based discriminant analysis technique was proposed in [20], and recently ev alu- ated for both speaker and language recognition tasks on high- frequency (HF) radio channel degraded data [15, 19] where it compared fa vorably to LDA. In ND A, the expected values that represent the global information about each class are replaced with local sample averages computed based on the k -NN of in- dividual samples. More specifically , in the ND A approach, the between-class scatter matrix is defined as, ˜ S b = C X i =1 C X j =1 j 6 = i N i X l =1 w ij l x i l − M ij l x i l − M ij l T , (3) where x i l denotes the l th sample from class i , and M ij l is the lo- cal mean of k -NN samples for x i l from class j . Here, C and N i denote the number of classes and the number of samples in class i , respectively . The weighting function w ij l is introduced in (3) to deemphasize the local gradients that are large in magnitude to mitigate their influence on the scatter matrix. The weight pa- rameter , w ij l , is larger for samples near the classification bound- ary , while it drops off to approximately 0 for samples that are far from the boundary . In this study , the within-class scatter ma- trix, S w , is computed similarly as in LD A. The ND A transform is then formed by calculating the eigen vectors of S − 1 w ˜ S b . Three important observations can be made from a careful examination of the nonparametric between-class scatter matrix in (3). First, the mean vector , M ij l , is calculated locally (as opposed to globally in LDA), which can result in more robust transforms, particularly for scenarios where unimodality of the class conditional distributions cannot be guaranteed. Second, because all the samples are taken into account for the calcula- tion of the nonparametric between-class scatter matrix (as op- posed to only the class centroids in LD A), ˜ S b , and hence the ND A projection, is generally of full rank. Finally , compared to LD A, ND A is more effecti ve in preserving the complex struc- ture (i.e., local structure) within and across dif ferent classes be- cause LD A only uses global gradients obtained with the cen- troids of the classes to measure the between-class scatter . On the other hand, NDA uses local gradients that are emphasized along the boundary through the weighting function, w ij l . 3. Experiments This section provides a description of our experimental setup including speech data, the ASR system configuration, and the speaker recognition system configuration. 3.1. Data W e conduct the core of our speaker recognition e xperiments using conv ersational telephone and microphone (phone call and intervie w) speech material extracted from datasets released through the LDC for the NIST 2004-2010 SREs [21, 22], as well as Switchboard Cellular (SWBCELL) Parts I and II and Switchboard2 (SWB2) Phases II and III corpora. These datasets contain speech spoken in U.S. English (the non English por - tion was filtered out) from a large number of male and female speakers with multiple sessions per speak er . The NIST SRE 2010 data is held out for ev aluations, while the remaining data are used to train the system hyper-parameters (i.e., the i-vector extractor , LD A/ND A, and PLDA). In our experiments, we con- sider all 9 extended core tasks (C1–C9) along with the 10sec– 10sec condition (C10sec) in the NIST SRE 2010 that in volv e telephone and microphone trials from both male and female speakers (consult [23] for a more detailed description of the tasks). 3.2. DNN system configuration A DNN model, with 7 fully connected hidden layers with 2048 units per layer e xcept for the bottleneck layer that has 512 units, is discriminativ ely trained using the standard er- ror back-propagation and cross-entropy objectiv e function to estimate posterior probabilities of 10,000 senones (HMM tri- phone states). The training is accomplished using the IBM Attila toolkit [24] on 600 hours of conv ersational telephone speech (CTS) data from the Fisher corpus [25] with a 9-frame context of 40-dimensional speaker-adapted feature vectors ob- tained using per recording fMLLR transforms [16, 17]. The fM- LLR transforms are generated for each recording with decoding alignments obtained from a GMM-HMM acoustic model (see [26, 27] for more details). 3.3. Speaker r ecognition system configuration For speech parameterization (other than the fMLLR based fea- tures), we extract 13-dimensional MFCCs (including c 0 ) from 25 ms frames every 10 ms using a 24-channel mel filterbank. The first and second temporal cepstral deriv ativ es are also com- puted ov er a 5-frame window and appended to the static fea- tures to capture the dynamic pattern of speech ov er time. This results in 39-dimensional feature vectors. For non-speech frame dropping, we employ an unsupervised speech activity detector (SAD) based on voicing features [28]. After dropping the non- speech frames, short-time cepstral mean subtraction (CMS) is applied to suppress the short term linear channel effects. In this paper , a 500-dimensional total v ariability subspace is learned and used to extract i-vectors from the recordings. T o learn the i-vector extractor , out of a total of 60,178 record- ings available from 1884 male and 2601 female speakers, we select 48,325 recordings from NIST SRE 2004-2008, SWB- CELL, and SWB2 corpora. The zeroth and first order Baum- W elch statistics are computed for each recording using soft alignments obtained from either a gender-independent 2048- component GMM-UBM with diagonal covariance matrices, or the DNN acoustic model with 2k, 4k, and 10k senones. The GMM-UBM is trained using 21,207 recordings selected from the NIST SRE 2004-2006, SWBCELL, and SWB2 corpora. After extracting 500-dimensional i-vectors, we either use LD A or NDA for inter-session variability compensation by re- ducing the dimensionality to 250. In order to train the ND A, we employ a one-versus-rest strategy to compute the inter-speaker scatter matrix in (3). This provides flexibility on the number of nearest neighbors used for computing the local means. A co- sine similarity metric (as opposed to Euclidean) is used to find the k -nearest neighbors for each sample. The dimensionality reduced i-vectors are then centered, whitened, and unit-length normalized. For scoring, a Gaussian PLD A model with a full cov ariance residual noise term [12, 13] is learned using the i- vectors extracted from all 60,178 speech segments (1884 male and 2601 female speak ers) as noted pre viously . The Eigen voice subspace in the PLD A model is assumed full-rank. 4. Results and Discussion 4.1. Experimental r esults In this section, we summarize the results obtained with the ex- perimental setup presented in Section 3. In the first experi- ment, we ev aluated the ef fectiveness of ND A versus LDA for inter-session variability compensation in the i-vector space. The outcome of this experiment on C5 is presented in T able 1, in terms of the equal error rate (EER), minimum detection cost function with the NIST SRE 2008 [29] and 2010 [23] defini- tions (minDCF08 and minDCF10). It can be seen from the table that the systems with ND A consistently provide better speaker recognition performance across all three metrics. For the GMM based system, a relativ e improvement of 30% in T able 1: P erformance comparison of IBM speaker r ecognition systems with various configurations on C5, with 10k senones. System EER [%] minDCF08 minDCF10 GMM-MFCC-LD A 2.11 0.113 0.440 GMM-MFCC-ND A 1.49 0.071 0.280 DNN-MFCC-LD A 0.91 0.045 0.172 DNN-MFCC-ND A 0.68 0.034 0.140 DNN-fMLLR-LD A 0.75 0.032 0.125 DNN-fMLLR-ND A 0.59 0.025 0.095 EER is achie ved with ND A ov er LD A, while for the DNN based systems with MFCCs and fMLLR features relati ve impro ve- ments of 25% and 21% are obtained, respecti vely . W e spec- ulate that this may be due to the nonparametric nature of the scatter matrices in ND A that makes no assumptions regarding the underlying class-conditional distributions (i.e., Gaussianity and unimodality). Another important observation that can be made from T able 1 is that, irrespectiv e of the dimensionality re- duction algorithm used, the systems with fMLLR features out- perform the MFCC based systems. This is possibly attributed to the ability of the fMLLR transforms in reducing the speaker and channel variabilities in the acoustic feature space. Finally , consistent with the results reported in recent studies [5, 6], the DNN based systems outperform the GMM based systems by significant margin (e.g., resulting in a relative improv ement of more than 54% in terms of the EER with MFCCs and ND A). In [14], we also inv estigated the impact of the senone set size (2k, 4k, and 10k) on speaker recognition performance, where we observed that the larger the number of senones, the better the performance. It is worth noting that increasing the number of components in the unsupervised GMM acoustic model (with diagonal cov ariance matrices) for speaker recognition did not seem to result in much performance gains in the recent studies [5, 6]. In the next set of experiments, we inv estigated the impact of in-domain and out-of-domain training for LD A versus ND A. This was accomplished by first splitting the training data into in- and out-of-domain parts, and then retraining the LDA and ND A models on these parts. Similar to the setup used in the do- main adaptation challenge (e.g., see [9, 30]), the in-domain part contains CTS data from the Mixer collection, i.e., SRE2004– 2008 corpora, while the out-of-domain part contains data from the older SWB2 and SWBCELL corpora. T able 2 shows the results from these experiments on C5 which are obtained with i-vectors computed using 10k DNN senones and fMLLR fea- tures. It is observed that while ND A outperforms LDA for out- of-domain training, it offers minimal improv ement (at least in terms of EER) when only in-domain training data is used. Ho w- ev er , with pooled in-domain and out-of-domain data (which is no longer unimodal), a significant impro vement in performance is obtained with NDA over LD A (i.e., 21% relativ e in terms of T able 2: Comparison of LDA vs ND A for in-domain and out-of- domain training on C5, with fMLLR featur es and 10k senones. System Domain EER [%] minDCF08 minDCF10 out 1.80 0.085 0.256 DNN-LD A in 0.78 0.034 0.149 in+out 0.75 0.032 0.125 out 1.55 0.071 0.226 DNN-ND A in 0.75 0.033 0.119 in+out 0.59 0.025 0.095 T able 3: P erformance comparison of IBM speaker reco gnition systems with various configurations on C1–C10sec (excluding C5). System EER [%] (minDCF10) C1 C2 C3 C4 C6 C7 C8 C9 C10sec GMM-MFCC-ND A 1.2 (0.22) 1.8 (0.32) 1.8 (0.30) 1.1 (0.25) 2.9 (0.55) 3.3 (0.59) 1.1 (0.25) 0.7 (0.11) 11.7 (0.99) DNN-MFCC-ND A 0.8 (0.11) 1.3 ( 0.16 ) 0.9 (0.13) 0.6 (0.11) 1.5 (0.34) 1.1 (0.32) 0.6 (0.14) 0.4 (0.05) 8.3 (0.94) DNN-fMLLR-ND A 0.9 (0.13) 1.3 (0.17) 0.9 (0.10) 0.7 ( 0.08 ) 1.0 (0.24) 1.4 (0.31) 0.4 (0.10) 0.3 (0.05) 12.3 (0.99) EER). This improv ement may be attributed to the robustness of ND A to multimodal data, as discussed in Section 2.2. For completeness, we also ev aluated the performance of our speaker recognition system on extended microphone and tele- phone tasks, under normal and high/low vocal ef fort, (C1–C9) as well as the 10sec–10sec condition in the NIST SRE 2010. The results are provided in T able 3 for both the GMM and DNN based systems. It is clear that the DNN based systems, with either MFCCs or fMLLR features, perform significantly bet- ter than the GMM based system. Additionally , the DNN based system trained with raw MFCCs tends to perform better than the fMLLR based system on interview microphone conditions (C1–C2). W e speculate that this is because the fMLLR trans- forms, which are obtained using GMM-HMMs trained only on telephony data, are unable to effecti vely reduce the v ariabil- ity due to channel mismatch on microphone recordings. F or other tasks, ov erall, MFCC and fMLLR based systems perform similarly e xcept for the C10sec where, among other challenges, the VTL normalizations and the fMLLR transforms are also ad- versely impacted by the short duration of recordings (i.e., 10 s). 4.2. Err or analysis In consideration of the obtained results, for example 0.59% EER on the e xtended condition 5, we attempt to gain an un- derstanding of some of the underlying issues in the system. In particular , we would like to examine the characteristics of the recordings contributing to some of the lowest scoring tar- get trials. T owards this, we analyzed 265 recordings relating to the 200 lowest scoring target trials and attempted to charac- terize them with various potentially problematic properties. It was found that, while many of the recordings are audibly ac- ceptable, there are 76 with co-channel speech (either through cross-channel feedback or from background competing speak- ers), 51 with background noise, music, breath, sniffle, and fid- geting sounds, 33 with very sparse speech acti vity , 8 with cock- tail party noise, and 2 exhibiting signal clipping ef fects. Our objecti ve is to impro ve the tar get trial scores relating to the problematic files. In particular , we focused our attention on three categories: (i) cocktail party effect, (ii) general noise, and (iii) co-channel speaker . These categories were chosen because they may benefit from manually changing the SAD information to more appropriately reflect the speech portions of the speaker of interest (i.e., the target speak er). Figure 2 sho ws the result of the manual modification of the SAD labels by plotting the trial scores (both target and non- target) that related to a selection of 18 modified SAD record- ings. The x-axis represents the scores from trials with the orig- inal recordings while the y-axis sho ws the scores for the mod- ified recordings. An interesting point is that not only did some of the target scores significantly improve, but man y of the non- target scores also decreased. One view is that the presence of a co-channel speaker has the effect of bringing the resulting i- vector closer to the general population of speaker i-vectors (on av erage). This raises an important observation that not only -600 -500 -400 -300 -200 -100 0 Scores from original recordings -600 -500 -400 -300 -200 -100 0 Scores from updated recordings Figure 2: Scatter plot of the scor es for r epaired trials versus the original trials. The asterisks ( ∗ ) repr esent the tar get trials while the dots ( · ) r epr esent the non-targ et trials. should a speech detection component be utilized but also a com- ponent that only focuses on the speaker of interest (or the ho- mogeneity of the class). The large mo vement in both target and non-target trials was basically described by 8 of the 18 record- ings. These consisted of intermittent noise conditions, cocktail party noise, and co-channel (cross-channel) speech where the interference was significant or comparable to the lev el of the target speech. Interestingly , by manually modifying the SAD for 18 recordings the EER is reduced from 0.59% to 0.56%. Future w ork will in volve the automation of such manual processes, perhaps through the use of speaker diarization and/or audio enhancement (e.g. see [31]), as well as the expansion of the types of issues addressed in the system such as short- duration modeling [32] and signal quantization issues. 5. Conclusions In this paper , we presented the recent advancement made in our state-of-the-art i-vector speaker recognition system. W e in ves- tigated the impact of several key components of the system on performance using extended core tasks in the NIST 2010 SRE that inv olved both microphone and telephone trials. Some im- portant observations were as follo ws: 1) the NDA w as found to be more robust than LDA to multimodality within data, hence more effecti ve than LD A for inter-session v ariability compen- sation, 2) the fMLLR based features provided a better repre- sentation than raw MFCCs for matched data conditions (i.e., telephony trials), and 3) the DNN based UBM with a v ery large number of components (i.e., 10k senones) resulted in remark- able improvements in the performance of our system. Motiv ated by the relativ ely low EER achieved by our system (e.g., 0.59% on C5), we also conducted an error analysis of low scoring tar- get trials in C5 that rev ealed various issues (such as co-channel speech, background noise/music, and signal clipping effects) in the recordings associated with these problematic trials. 6. References [1] P . K enny , G. Boulianne, P . Ouellet, and P . Dumouchel, “Joint fac- tor analysis versus eigenchannels in speaker recognition, ” IEEE T rans. Audio Speech Lang. Process. , vol. 15, no. 4, pp. 1435– 1447, 2007. [2] N. Dehak, P . Kenn y , R. Dehak, P . Dumouchel, and P . Ouellet, “Front-end factor analysis for speaker verification, ” IEEE T rans. Audio Speec h Lang. Pr ocess. , vol. 19, no. 4, pp. 788–798, 2011. [3] D. A. Reynolds, T . F . Quatieri, and R. B. Dunn, “Speaker veri- fication using adapted Gaussian mixture models, ” Digital Signal Pr ocess. , vol. 10, pp. 19–41, 2000. [4] M. K. Omar and J. Pelecanos, “T raining universal background models for speaker recognition, ” in Pr oc. The Speaker and Lan- guage Recognition W orkshop (Odyssey 2010) , Brno, Czech, June 2010, pp. 52–57. [5] Y . Lei, N. Scheffer , L. Ferrer, and M. McLaren, “ A novel scheme for speaker recognition using a phonetically-aware deep neural network, ” in Proc. IEEE ICASSP , Florence, Italy , May 2014, pp. 1695–1699. [6] D. Snyder , D. Garcia-Romero, and D. Povey , “T ime delay deep neural network-based univ ersal background models for speaker recognition, ” in Pr oc. IEEE ASR U , Scottsdale, AZ, December 2015, pp. 92–97. [7] L. P . Heck, Y . Konig, M. K. S ¨ onmez, and M. W eintraub, “Ro- bustness to telephone handset distortion in speak er recognition by discriminativ e feature design, ” Speech Commun. , v ol. 31, no. 2-3, pp. 181–192, 2000. [8] S. Y aman, J. W . Pelecanos, and R. Sarikaya, “Bottleneck fea- tures for speaker recognition, ” in Pr oc. The Speak er and Lan- guage Recognition W orkshop (Odyssey 2012) , Singapore, Singa- pore, June 2012, pp. 105–108. [9] F . Richardson, D. A. Reynolds, and N. Dehak, “ A unified deep neural network for speaker and language recognition, ” in Pr oc. INTERSPEECH , Dresden, Germany , September 2015, pp. 1146– 1150. [10] P . Mat ˇ ejka et al. , “ Analysis of DNN approaches to speaker iden- tification, ” in Pr oc. IEEE ICASSP , Shanghai, China, March 2016, pp. 5100–5104. [11] K. Fukunaga, Intr oduction to Statistical P attern Recognition , 2nd ed. Ne w Y ork: Academic press, 1990. [12] S. J. Prince and J. H. Elder , “Probabilistic linear discriminant anal- ysis for inferences about identity , ” in Pr oc. IEEE ICCV , Rio De Janeiro, October 2007, pp. 1–8. [13] D. Garcia-Romero and C. Y . Espy-W ilson, “ Analysis of i-vector length normalization in speaker recognition systems. ” in Pr oc. INTERSPEECH , Florence, Italy , August 2011, pp. 249–252. [14] S. O. Sadjadi, S. Ganapathy , and J. Pelecanos, “The IBM 2016 speaker recognition system, ” in Pr oc. The Speaker and Language Recognition W orkshop (Odyssey 2016) , Bilbao, Spain, June 2016. [15] S. O. Sadjadi, J. W . Pelecanos, and W . Zhu, “Nearest neigh- bor discriminant analysis for robust speaker recognition, ” in Pr oc. INTERSPEECH , Singapore, Singapore, September 2014, pp. 1860–1864. [16] V . Digalakis, D. Rtischev , and L. Neumeyer , “Speaker adaptation using constrained estimation of Gaussian mixtures, ” IEEE T rans. Speech Audio Process. , vol. 3, no. 5, pp. 357–366, September 1995. [17] M. J. F . Gales, “Maximum likelihood linear transformations for HMM-based speech recognition, ” Comput. Speech Lang. , v ol. 12, no. 2, pp. 75–98, 1998. [18] P . Kenny , “Bayesian speaker verification with heavy tailed pri- ors, ” in Proc. The Speaker and Language Recognition W orkshop (Odyssey 2010) , Brno, Czech, June 2010. [19] S. O. Sadjadi, S. Ganapathy , and J. W . Pelecanos, “Nearest neigh- bor discriminant analysis for language recognition, ” in Pr oc. IEEE ICASSP , Brisbane, Australia, April 2015, pp. 4205–4209. [20] K. Fukunaga and J. Mantock, “Nonparametric discriminant anal- ysis, ” IEEE T rans. P attern Anal. Mach. Intell. , vol. 5, no. 6, pp. 671–678, 1983. [21] C. Cieri, L. Corson, D. Graff, and K. W alker , “Resources for new research directions in speaker recognition: The Mixer 3, 4 and 5 corpora, ” in Pr oc.INTERSPEECH , Antwerp, Belgium, August 2007, pp. 950–953. [22] L. Brandschain, D. Graff, C. Cieri, K. W alker , C. Caruso, and A. Neely , “Mixer 6, ” in Proc. LREC , V alletta, Malta, May 2010. [23] NIST , “The NIST Y ear 2010 Speaker Recognition Evalua- tion Plan, ” http://www .nist.gov/itl/iad/mig/upload/NIST SRE10 ev alplan- r6.pdf, 2010. [24] H. Soltau, G. Saon, and B. Kingsbury , “The IBM Attila speech recognition toolkit, ” in Pr oc. IEEE SL T , Berkele y , CA, December 2010, pp. 97–102. [25] C. Cieri, D. Miller , and K. W alker , “The Fisher corpus: A re- source for the next generations of speech-to-text, ” in Pr oc. LREC , Lisbon, Portugal, May 2004. [26] S. Ganapathy , S. Thomas, D. Dimitriadis, and S. Rennie, “In- vestigating factor analysis features for deep neural networks in noisy speech recognition, ” in Pr oc. INTERSPEECH , Dresden, Germany , September 2015, pp. 1898–1902. [27] G. Saon, H. K. Kuo, S. Rennie, and M. Picheny , “The IBM 2015 English con versational telephone speech recognition system, ” in Pr oc. INTERSPEECH , Dresden, Germany , September 2015, pp. 3140–3144. [28] S. O. Sadjadi and J. H. L. Hansen, “Unsupervised speech activity detection using voicing measures and perceptual spectral flux, ” IEEE Signal Pr ocess. Lett. , vol. 20, no. 3, pp. 197–200, 2013. [29] NIST , “The NIST Y ear 2008 Speaker Recognition Evalua- tion Plan, ” http://www .itl.nist.gov/iad/mig/tests/sre/2008/sre08 ev alplan release4.pdf, 2008. [30] D. Garcia-Romero and A. McCree, “Supervised domain adap- tation for i-vector based speaker recognition, ” in Pr oc. IEEE ICASSP , Florence, Italy , May 2014, pp. 4047–4051. [31] O. Plchot, L. Burget, H. Aronowitz, and P . Mat ˇ ejka, “ Audio en- hancing with DNN autoencoder for speaker recognition, ” in Pr oc. IEEE ICASSP , Shanghai, China, March 2016, pp. 5090–5094. [32] P . Kenny , T . Stafylakis, P . Ouellet, M. J. Alam, and P . Dumouchel, “PLD A for speaker verification with utterances of arbitrary du- ration, ” in Proc. IEEE ICASSP , V ancouver, BC, May 2013, pp. 7649–7653.
Original Paper
Loading high-quality paper...
Comments & Academic Discussion
Loading comments...
Leave a Comment