Teaching Data Science
We describe an introductory data science course, entitled Introduction to Data Science, offered at the University of Illinois at Urbana-Champaign. The course introduced general programming concepts by using the Python programming language with an emp…
Authors: Robert J. Brunner, Edward J. Kim
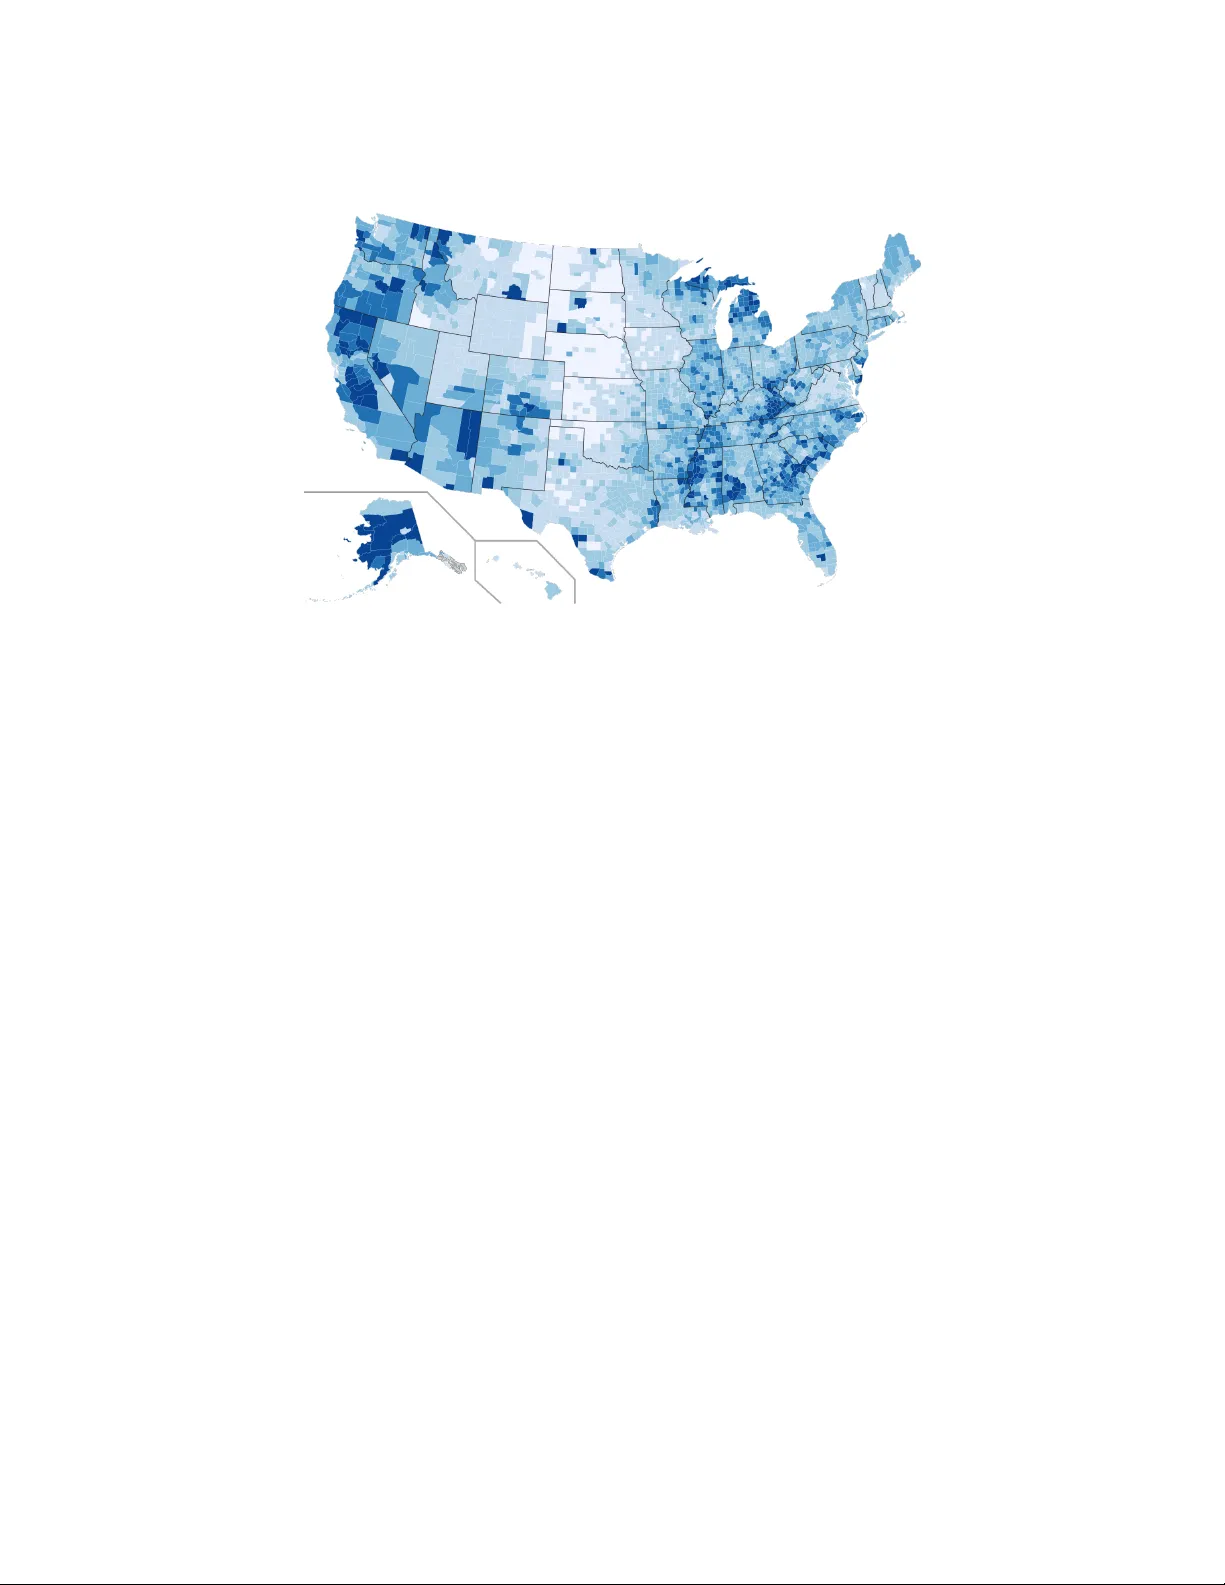
This space is reserv ed for the Pro cedia header, do not use it T eac hing Data Science Rob ert J. Brunner 1 and Edw ard J. Kim 2 1 Univ ersity of Illinois, Urbana, Illinois, U.S.A. bigdog@illinois.edu 2 Univ ersity of Illinois, Urbana, Illinois, U.S.A. jkim575@illinois.edu Abstract W e describe an introductory data science course, en titled Intr o duction to Data Scienc e , offered at th e Univ ersit y of Illinois at Urbana-Champaign. The course introduced general programming concepts b y using the Python programming language with an emphasis on data preparation, pro cessing, and presentation. The course had no prerequisites, and studen ts w ere not exp ected to hav e any programming exp erience. This introductory course w as designed to cov er a wide range of topics, from the nature of data, to storage, to visualization, to probabilit y and statistical analysis, to cloud and high p erformance computing, without b ecoming ov erly fo cused on an y one sub ject. W e conclude this article with a discussion of lessons learned and our plans to dev elop new data science courses. Keywor ds: Data Science, Informatics, Visualization, Probabilit y , Statistics, High Performance Com- puting, C loud Computing, Databases, Python Programming 1 In tro duction Data scien tist has b een dubb ed “the sexiest job of the 21st century” [5]. A rep ort from McKinsey Global Institute estimates that b y 2018 the United States alone could experience a shortage of 190,000 data scien tists with deep analytical skills, and 1.5 million data-savvy managers and analysts capable of taking full adv antage of Big Data [15]. Whether or not such media cov erage is h yp e, a surge in the p opularity of data science will naturally create a demand from studen ts for training in data science. Th us, it is not surprising that numerous data science programs ha ve emerged at ma jor univ ersities, including the Univ ersity of California at Berkeley , Stanford, New Y ork Univ ersit y , and the Universit y of Michigan. A t the Universit y of Illinois at Urbana-Champaign, we began offering an eigh t-week online course, Informatics 490: Intr o duction to Data Scienc e , in the Summer of 2014. This new course was not our initial foray in teac hing data science concepts. In 2010, we b egan adding data science concepts in to an undergraduate astronomy course, Astr onomy 406: Galaxy and the Universe . Subsequently , with the assistance of the Illinois Informatics Initiative, we created a new course in the F all of 2011, Astr onomy 496/596: Pr actic al Informatics for the Physic al 1 T eaching Data Science Brunner and Kim Scienc es [3]. Although these previous efforts were generally successful, their target audience w ere students in science and engineering disciplines. Given their p opularity , the Universit y of Illinois comm unity recognized the need for this material to be offered more broadly . As a result, w e created and taugh t Intr o duction to Data Scienc e as an online course in the Summer of 2014. This new course was successful, and was expanded and offered again in the Spring of 2015, but as a fifteen-w eek, dual-lev el undergraduate/graduate course. The new, semester-long course differed from t ypical courses offered in statistics or computer science departments. Our new course taught the Python programming language with more em- phasis on data preparation, pro cessing, and presentation. Many applied statisticians, including Nolan and T emple Lang [17], Cobb [4], and Donoho [9], lamen t that computing concepts are not a ma jor component of traditional statistics. F urthermore, a mo dern, practical data science course offered within statistics curricula will most lik ely use the R language [13]. Python (es- p ecially when using the Pandas library) is capable of p erforming most, if not all, of the data analysis op erations that a data scien tist migh t c omplete b y using R. Python, how ever, is a general purp ose programming language, while R is generally limited to tasks within the realm of statistical computing. With Python, students learn and build confidence using general programming concepts that are common amongst other p opular pro- gramming languages suc h as Ja v a, C, or C++. The course also differs from typical in tro ductory computer science courses that emphasize program design, as w e integrate general programming concepts with an emphasis on data preparation, processing, and presen tation. Moreov er, data- in tensive computer science courses, suc h as a mac hine learning course, often hav e one or more programming classes as a prerequisite, which b ecomes a barrier to enrollmen t for studen ts in some fields, such as the so cial sciences. Our course has no prerequisites, and students are not exp ected to ha ve an y programming exp erience. In the end, fifty studen ts completed the three-credit course in the Spring of 2015. Students w ere from diverse disciplines: Statistics, Physics, Computer Science, Economics, Electrical Engineering, T echnical Systems Management, Political Science, Industrial Engineering, Math- ematics, Nuclear Engineering, Astronomy , Actuarial Science, Library and Information Science, Material Science, Advertising, Agricultural Engineering, Biological Engineering, Bioph ysics, Comm unity Health, Finance, F o o d Science, Geographic Information Sciences, Graphic Design, Linguistics, Material Science, Psychology , and So ciology . With studen ts from suc h a diversit y of bac kgrounds, w e feel that the course clearly filled a pressing need. In the rest of this paper, w e detail our exp eriences in teaching this fifteen-week data science course. After whic h w e discuss some general lessons learned as w ell as our plans for the future. Course materials are a v ailable at https://github.com/UI- DataScience/info490- sp15 . 2 Course Structure Our course w as designed to cov er a wide range of topics, from the nature of data, to storage, to visualization, to probabilit y and statistical analysis, to cloud and high performance computing, without diving into any one sub ject to o deeply . This w as done to ensure that studen ts would b e exp osed to as many new topics as p ossible with sufficient exp osure so that they could indep enden tly explore topics of interest as desired. Ov erall, the class w as built b y using a Mo o dle installation operated b y the College of Lib eral Arts and Sciences at the Universit y of Illinois. This provided the studen ts with a common lo cation for obtaining all lecture material, supplementary material (including readings and co de examples), and online forums to facilitate class comm unication. How ever, we also forced the students to use the git v ersioning to ol b y spending an entire lecture on Git and b y hosting 2 T eaching Data Science Brunner and Kim Jup yter noteb o oks for lectures and assignmen ts on GitHub. Since this course w as deliv ered en tirely online via Mo o dle and GitHub, our course resembled a massive online op en course (MOOC) in sev eral asp ects. F rom the studen t’s p ersp ectiv e, eac h w eek b egan with an introduction video in which we summarized the topics that would b e cov ered, and dynamically demonstrated example co des or applications. Eac h w eek’s material was organized in to three lessons; each lesson w as comprised of a required reading list and one or more optional readings. F or some of the lessons, we pro vided Jup yter noteb o oks [16] (formerly IPython [21]; see Section 3.2), while in others we lev eraged freely av ailable, online resources. A t the end of eac h lesson, there w as a short lesson assessment with ten m ultiple-choice questions, and at the end of each week, there was a comprehensive quiz with forty m ultiple-choice questions. In addition, there was a programming assignment for w eeks t w o through fourteen (this was a fifteen week course), where Jupyter notebo ok templates w ere pro vided to assist students in preparing their solutions. All programming assignments w ere graded via peer assessmen t and where possible via automated mac hine grading (see Section 4). Giv en the online nature of the course, there w as no midterm or final exam. 3 Course Con ten t In this section, we detail the topics cov ered in the course within their own subsections. The presen tation order roughly matc hes the order the material was presen ted in the course. 3.1 UNIX and the Command Line In terface One of the ma jor b enefits of using Python is the large n umber of libraries that are av ailable; ho wev er, this can present a stumbling block for students who are uncertain on how to acquire, build, and install new co de, libraries, or applications. In a con v en tional classroom setting, a practical course such as ours would emplo y a computer laboratory , where all necessary soft ware w ould ha v e b een installed. How ever, since we created an online course, students had to use their o wn mac hines. Thus, w e needed a solution that remov ed the difficulties asso ciated with installing and upgrading softw are pack ages. Although the Anaconda Python distribution w as one possible solution, w e instead c hose to use the Do ck er con tainer technology [7], b ecause our course w ould start with an in tro duction to UNIX and the Command Line In terface (CLI). Data scientists are exp ected to b e at least familiar with a CLI b ecause sometimes shell commands are simply the b est to ol for cleaning and manipulating v arious types of data. In an announcemen t we sen t out to enrolled students one w eek prior to the b eginning of the semester, studen ts were instructed to follo w the provided do cumentation to install the Do ck er tec hnol- ogy , which depended on their host computer op erating system. W e also built and provided a Do c ker course image that con tained all soft ware and libraries needed for the course. Given the imp ortance of Do c k er in our course, the very first reading assignmen t introduced the concept of virtualization and basic Do c ker usage. In the follo wing tw o w eeks, students read sections from the The Linux Command Line [22] b o ok by entering commands into a terminal window within their Do ck er container. After tw o w eeks, students had a basic understanding of the UNIX file system, understoo d how UNIX pro cesses w ork, learned ho w to use vim to perform basic file editing, and were able to use data pro cessing to ols such as, grep , awk , and sed . Since w e hosted Jupyter noteb o oks for lessons and programming assignments on GitHub, w e also pro vided reading assignments on versioning and git . 3 T eaching Data Science Brunner and Kim Figure 1: An example session of Jupyter notebo ok. 3.2 The Python Programming Language Since our course had no prerequisites, we dev oted t wo w eeks to the general concepts of pro- gramming. F or this, studen ts were asked to read from Think Python [10]. This in tro duced conditionals, functions, the basic Python data types, the Python ob ject oriented approach to data, and Python data structures suc h as the tuple, list, and dictionary . Man y reading assignments were provided to studen ts as Jupyter noteb o oks [16], and stu- den ts completed all Python programming assignmen ts b y using Jup yter noteb o oks. T he Jup yter noteb o ok is an in teractive computational environmen t, in which y ou can present and execute co de, include descriptiv e text, and inline visualizations in a single do cumen t as shown in Fig- ure 1. This tec hnology is becoming p opular as an instructional to ol, and although its interface sometimes can complicate debugging, w e hav e found it to b e an excellen t to ol for teac hing data science. 3.3 Data Visualization The next phase of the course in tro duced one of the most important yet least discussed asp ects of data science, namely data visualization. Although only one week was explicitly devoted to visualization, w e introduced additional visualization ideas and examples throughout the rest of the course wherev er appropriate. T o demonstrate the imp ortance of plotting data b efore analyzing it, we show ed Anscombe’s quartet [1]. W e also presen ted ideas c hampioned by Edw ard T ufte, such as minimizing chart junk—that is, just b ecause a soft ware pack age can add unnecessary embellishments to a plot do es not mean the user should do so. W e also linked to a video of McCandless’s 2010 TED talk, The b e auty of data visualization , whic h demonstrates how hidden patterns can emerge from b eautiful, simple visualizations of complex data sets. Visualizing data with Python required the introduction of the Numpy [23] and Mat- plotlib [14] libraries, which w e used to demonstrated ho w to plot a theoretical curve, ho w to make a scatter plot from a data set, and how to make a histogram. W e demonstrated ho w 4 T eaching Data Science Brunner and Kim to use the Seaborn [24] library to improv e the appearance of a plot, and, throughout the rest of the course, we used Seab orn to create a v ariety of plots, such as b ox plots, violin plots, k ernel densit y estimation plots, pair plots, distribution plots, time series plots, and heat maps. 3.4 Statistical and Time Series Analysis W e devoted three weeks to statistical and time series analysis. First, w e in tro duced the P andas library , which in tro duces concepts from the R language into Python to greatly simplify working with large, structured data sets. The primary ob ject in Pandas is the DataF rame, a tw o- dimensional tabular data structure with both row and column labels. The DataF rame pro vides sophisticated functionalit y to mak e it easy to select, group, and filter data. After an in tro duction to P andas, we transitioned to statistical analysis, which is very impor- tan t with large data sets, especially when we need to mak e a quick decision based on summary information without being able to completely scan a (p otentially large) data file. It is also nec- essary to use statistical analysis when w e wish to model some data component in order to make future predictions or to b etter understand some physical process. All of these cases require an understanding of summary statistics, densit y functions, distributions functions, basic Ba yesian analysis, and basic statistical analysis including linear mo deling and regression. F or most of this section of the course, w e leveraged the freely av ailable b o oks, Think Stats [12] and Think Bayes [11], by Allen Do wney . While a considerable co de base accompanies these b o oks, w e encouraged students to not use the author’s code, but to instead use standard Python, Nump y , or Pandas data structures. This was because Downey’s code is written like a soft ware pro ject and is spread across multiple files and classes. While his approach mak es the code quite robust and easy to extend, we felt it complicated learning statistical concepts, esp ecially for studen ts who ha ve little previous programming experience. Finally , we devoted one week to learn ho w to w ork with time series data in P andas and ho w to visualize them by using Seab orn. Time series data are everywhere, and while often simple in con tent (e.g., a one-dimensional array indexed by time) they often provide ric h data mining opp ortunities. As an example, the last lesson in this week fo cused on mining twitter streams b y using Twitter’s API. W e also in tro duced Marko v Chain Monte Carlo (MCMC) metho ds b y leveraging Chapter 1 of Bayesian Metho ds for Hackers [6], which demonstrates the use of PyMC [18] to sample from the p osterior to estimate mo del parameters. 3.5 Data F ormats Recognizing and understanding how to use standard data formats is essential to b eing a data scien tist. Therefore, w e devoted one week to basic data pro cessing tasks and differen t data file formats, such as fixed-width text, delimited text, XML, JSON, and HDF. As a practical example, we demonstrated ho w to make a Choropleth visualization, which was inspired b y Nathan Y au [26]. T o create a Choropleth map suc h as the one in Figure 2, studen ts needed to access web resources, parse an XML-based data format, extract meaningful data from a second w eb-access ible resource, and com bine it all into a new and in teresting visualization. 3.6 Data Persistence Relational database management systems (RDBMS) remain the most p opular data storage tec hnology . Thus, they are essen tial to any data science course, and w e devoted tw o weeks to introduce this tec hnology and to explore ho w to programmatically work with them. First, w e demonstrated how to perform simple data p ersistence via the Pickle library . This provided 5 T eaching Data Science Brunner and Kim Figure 2: A Choropleth map that visualizes count y-level unemplo yment rate in 2013. a simple in tro duction to the basic idea of storing data before w e in tro duced RDBMS. Next, w e introduced SQL and the SQLite database, by presenting basic SQL data types, including the SQL NULL v alue, the SQL Data Definition Language (DDL), the SQL Data Manipulation Language (DML), and the o v erall concept of a database sc hema. F ollo wing one week of learning to w ork with SQL by using the SQLite database from a UNIX command line, w e transitioned to using Python and SQLite to programmatically interact with a database. W e demonstrated ho w to establish a database connection from within a Python program and ho w to use this connection to obtain a reference to a database cursor. Students learned ho w to dynamically interact with an SQLite database in Python b y issuing queries, and also by updating and inserting rows on existing database. Students also learned how they can use a P andas DataF rame to simplify most of these tasks. Finally , we pro vided reading assignmen ts on NoSQL databases, including the MongoDB and Apach e Cassandra technologies. 3.7 In tro duction to Mac hine Learning Although machine learning is an enormous field that can easily fill an entire semester course, the simple, consistent API of the scikit-learn library [19] and its excellent do cumentation al- lo wed us to devote one w eek to an introduction of sup ervised learning metho ds (e.g., k -Nearest Neigh b ors, Supp ort V ector Machine, and Decision T rees), dimensionalit y reduction (Principal Comp onen t Analysis), and cluster finding ( k -means). While it is debatable whether machine learning belongs in a truly introductory course suc h as ours, most studen ts found the topic fascinating, and we felt that b y introducing machine learning, we could motiv ate students to indep enden tly pursue further studies in adv anced machine learning or to enroll in existing offerings in computer science departmen t. 3.8 In tro duction to HPC and Cloud Computing The final w eek of the course introduced computational technologies that are often required in data intensiv e analyses. W e b egan by in tro ducing the concept of cloud computing and 6 T eaching Data Science Brunner and Kim instructed students to register for a free trial of Go ogle Compute Engine. After reviewing the Do c ker engine, studen ts learned ho w to run containers of our course Dock er image on the Google Compute Engine, whic h enabled web-accessible Jupyter noteb o ok serv ers in the cloud. Finally , w e demonstrated how to run a Hadoop Streaming MapReduce job in a Do ck er container as w ell as the use of the Hado op file system (HDFS) and the Hado op Streaming pro cess mo del. 4 Assignmen ts As mentioned previously , our course was delivered en tirely online. As a result, it was similar to a MOOC platform in v arious asp ects. Email and online forums were the primary form of communication betw een studen ts and instructors; all assignments w ere submitted online; programming assignmen ts w ere graded b y p eers for sixt y percent of the assignment grade; and for the remaining fort y percent they w ere graded automatically , except for some problems that w ere not amenable to unit testing. There w ere three t yp es of assignmen ts: multiple-c hoice quizzes; w eekly programming as- signmen ts; and peer assessmen ts. Since a programming class has not b een a prerequisite to this class, w e provided template co de for eac h programming assignment. During this pro cess, w e first wrote a Jup yter notebo ok that demonstrated a data science task by using unit-testable functions. Next, we remov ed a few lines of code from one or more functions. W e provided a detailed description for each function, the data types of an y input parameters and return v alues, and we provided sev eral examples of correct output given a sp ecific input. Except for a few visualization problems, all programming assignments w ere graded automatically by using unit tests that compared studen t outputs against the correct answ ers. F or p eer assessmen ts, at least four studen ts were assigned to ev aluate each student’s assign- men t. W e pro vided a grading rubric that detailed how p oin ts should be allocated according to differen t asp ects of the assignmen t, suc h as correctness and readability . W e believe that there are significant benefits to p eer assessments, as students can learn from seeing v arious approac hes to the same problem. F urthermore, by autograding programming assignmen ts and utilizing p eer assessment, the course could easily be scaled up, allowing ev en more studen ts to enroll in future v ersions of this course. In man y programming assignments, w e used the airline on-time p erformance data set from the American Statistical Asso ciation (ASA) Data Exp o 2009 [2, 25]. The data, which originally comes from the Bureau of T ransportation Statistics, tracks all commercial flights in the U.S. b et ween 1987 and 2012. The size of the data set, with more than 120 million records in total and taking up t welv e Gigab ytes, precludes traditional, in-memory processing. Therefore, we used the CSV file for the most notable y ear, 2001, whic h con tains around six millions rows and t wen ty-nine columns, and tak es up 573 Megabytes. One programming assignmen t asked students to use the 2001 data to visualize the total n umber of flights and curren t temp erature of the top tw ent y airp orts (by traffic) in the U.S. as sho wn in Figure 3. Students read t wo columns, origin and destination airports, from this CSV file, and used groupby and aggregate op erations to aggregate the coun t of fligh ts at eac h airp ort. Eac h airp ort in the original CSV file w as identified by an IA T A code (a three-letter co de designating man y airp orts around the w orld). Thus, students had to map an airp ort in the SVG template file, which was identified by its cit y name, e.g., Chicago or San F rancisco, to an IA T A co de and then programmatically retriev e the current temperature for that city . This w as completed b y issuing an HTTP request and pro cessing the XML resp onse from the F ederal Aviation Administration (F AA) web service. Students parsed the SVG file and searc hed for all 7 T eaching Data Science Brunner and Kim Figure 3: T op tw ent y U.S. airp orts. The size of eac h circle is p rop ortional to the total n um- b er of arriv als and departures in 2001. The redder the color, the higher the temp erature at the airp ort; the bluer the color, the low er the temp erature. Figure 4: Clustering of Delta Airline’s air- craft. instances of circle in order to construct the target visualization:
Original Paper
Loading high-quality paper...
Comments & Academic Discussion
Loading comments...
Leave a Comment