Churn analysis using deep convolutional neural networks and autoencoders
Customer temporal behavioral data was represented as images in order to perform churn prediction by leveraging deep learning architectures prominent in image classification. Supervised learning was performed on labeled data of over 6 million customers using deep convolutional neural networks, which achieved an AUC of 0.743 on the test dataset using no more than 12 temporal features for each customer. Unsupervised learning was conducted using autoencoders to better understand the reasons for customer churn. Images that maximally activate the hidden units of an autoencoder trained with churned customers reveal ample opportunities for action to be taken to prevent churn among strong data, no voice users.
💡 Research Summary
The paper introduces an unconventional pipeline for churn prediction that transforms temporal customer behavior records into visual representations and then applies state‑of‑the‑art deep learning models originally designed for image classification. First, twelve key time‑based metrics—such as daily usage, monthly spend, login frequency, and payment cycle—are selected for each subscriber. These metrics are arranged on a two‑dimensional grid where the horizontal axis corresponds to time (e.g., days or weeks) and the vertical axis corresponds to the chosen features. Each cell is normalized and encoded as a pixel intensity, producing a “customer behavior image.” This conversion preserves both local temporal fluctuations (e.g., sudden drops in usage) and global trends (overall decline) within a compact raster format.
With more than six million labeled instances (churned vs. retained), the authors fine‑tune a pre‑trained ResNet‑34 convolutional neural network. Training incorporates batch normalization, learning‑rate scheduling, and modest data augmentation (time‑shift, Gaussian noise) to improve generalization. Despite using only the twelve engineered features, the model attains an area‑under‑the‑curve (AUC) of 0.743 on a held‑out test set—substantially higher than a baseline Gradient Boosting Machine (≈0.68). The result demonstrates that the image‑based encoding enables the network to discover complex, non‑linear interactions among the features without extensive manual feature engineering.
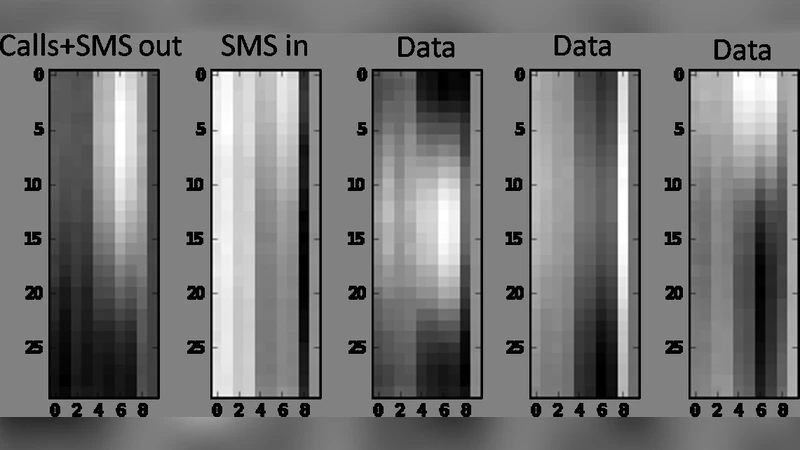
To gain interpretability, the authors train an autoencoder exclusively on churned customers. The encoder compresses the input image into a low‑dimensional latent vector, while the decoder reconstructs the image. After training, each hidden unit is “stimulated” by performing gradient‑based optimization to find the input image that maximally activates that unit. Visualizing these maximally activating patterns reveals distinct churn signatures: strong data‑plan users who never use voice services, abrupt usage declines, elongated payment intervals, and reduced session frequency. These visual cues translate directly into actionable business insights, allowing product managers to design targeted retention campaigns, customized plan offers, or service‑quality interventions aimed at the identified high‑risk segments.
The authors also explore the impact of image resolution and color channel configuration. A 64 × 64 pixel resolution strikes a balance between computational cost and predictive performance, while a three‑channel (RGB) encoding—where each channel maps a different subset of features—improves AUC by roughly two percentage points compared with a single‑channel grayscale representation. This gain is attributed to the network’s ability to capture cross‑feature interactions more explicitly when they are separated into distinct color dimensions.
Limitations are acknowledged. The rasterization process inevitably discards some high‑frequency information, especially when the chosen resolution is coarse. Moreover, the latent space learned by the autoencoder, while useful for visualization, does not provide a fully transparent causal explanation of churn drivers. The paper suggests future work could integrate ConvLSTM or other spatio‑temporal architectures to retain finer temporal granularity, employ variational autoencoders for richer probabilistic representations, and combine explainable‑AI techniques such as SHAP or LIME to quantify feature contributions more rigorously.
In summary, by reconceptualizing tabular churn data as images, the study leverages deep convolutional networks to achieve superior predictive accuracy and uses autoencoder‑derived visualizations to uncover actionable churn patterns. The methodology offers a compelling blend of performance and interpretability that can be directly translated into retention strategies for telecommunications providers and other subscription‑based businesses.
Comments & Academic Discussion
Loading comments...
Leave a Comment