Modeling Inter-Country Connection from Geotagged News Reports: A Time-Series Analysis
The development of theories and techniques for big data analytics offers tremendous flexibility for investigating large-scale events and patterns that emerge over space and time. In this research, we utilize a unique open-access dataset "The Global D…
Authors: Yihong Yuan
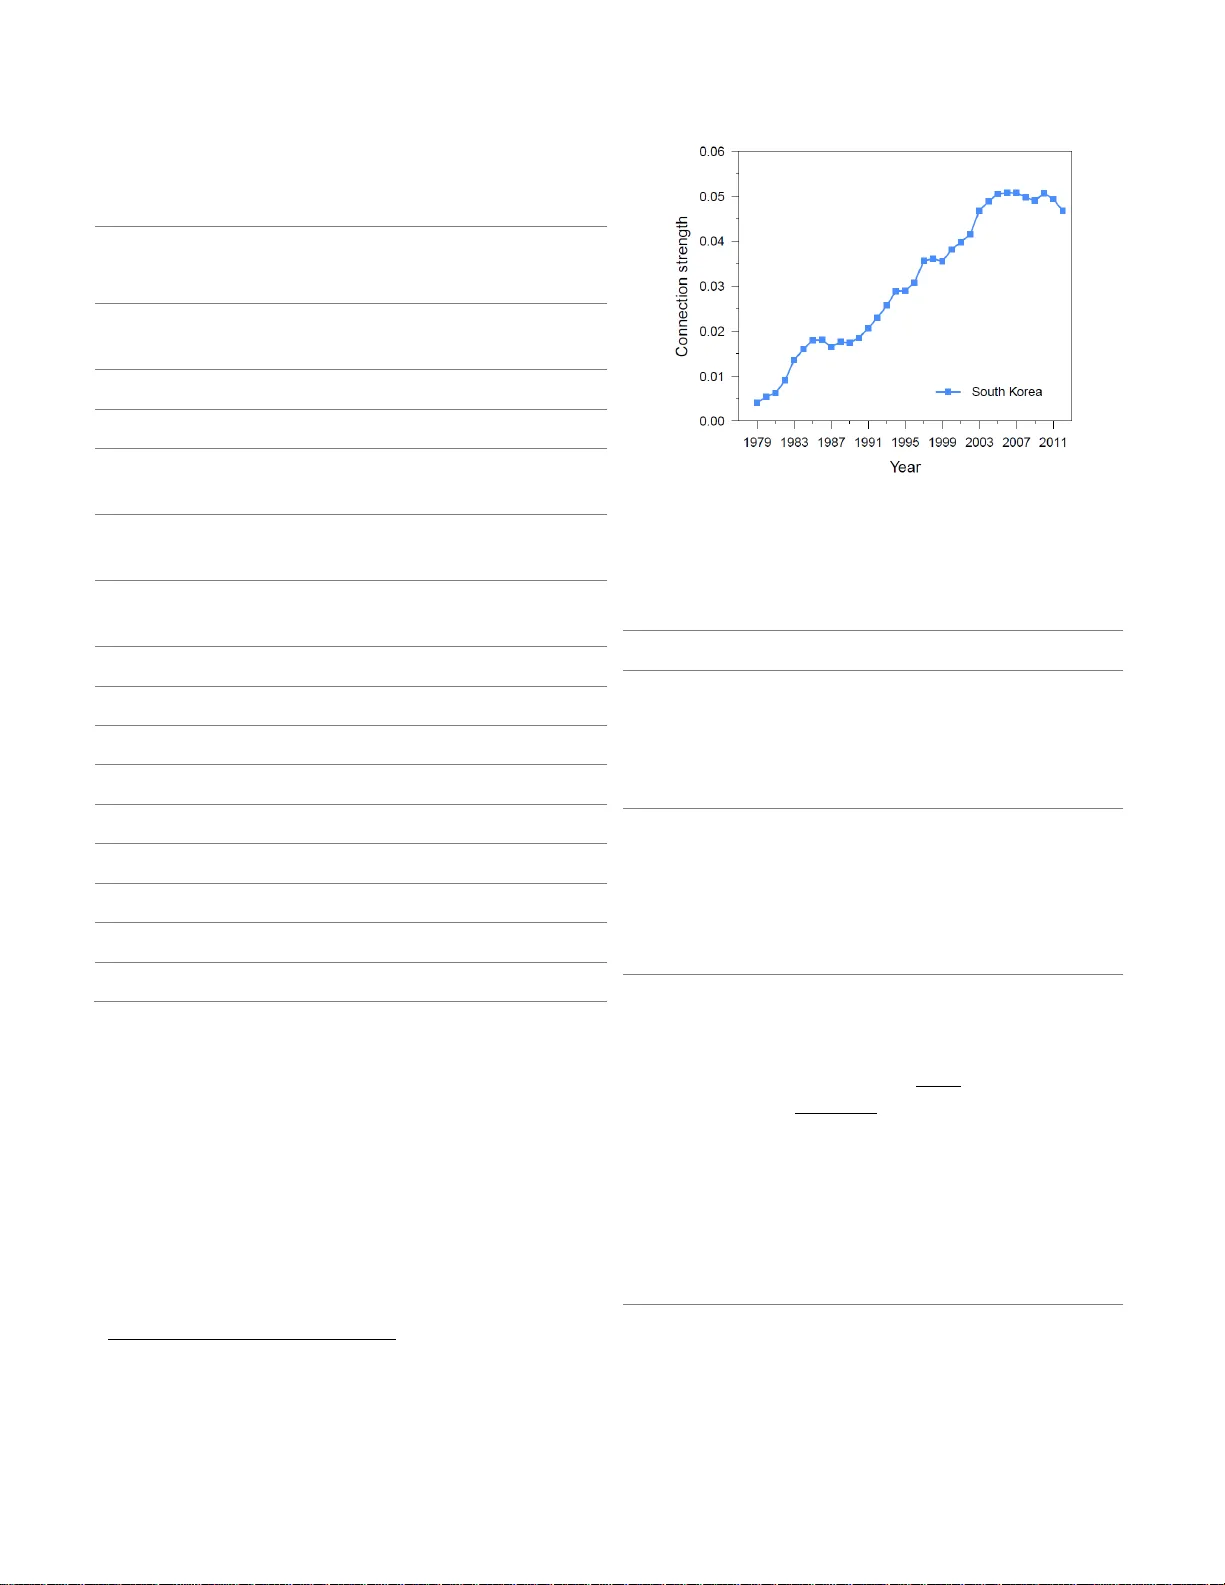
MODELING INTER-COUNTRY CONNECTION FROM GEOTAGGED NEWS REPORTS: A TIME-SERIES ANALYSIS Yihong Yuan Department of Geography , Texas State Universit y, San Marc os, TX, USA, 78666. ABSTRACT The development of theories and techniques f or big data analytics offers tremendous flexibility for investigatin g large-scale events and patterns that emerge over s pace and time. In this resear ch, we utilize a unique open -acces s dataset “The Global Data on Events, Location and Tone” (GDELT) to m odel the i mage of China in mass media, specifically, how China has relate d to the rest of the worl d and how this co nnection has evolved upon ti me based on an autoregressive integrated m oving average (ARIM A) model . The results of this r esearch contribute in both methodolo gical and empirical perspectives: We examined the ef fectiveness of time series models in predicting trends in long-term mass media data. In addition, w e identified various types of connection st rength p atterns between China and its top 15 related countries. T his study generates valuable input to interpret Ch ina ’ s diplomatic and regional relations based o n m ass media data, as well a s p roviding methodological references for investigating inter national relations in other co untries and r egions in the big data era. Index Terms — Time s eries analysis, ARIMA, Inter- country relations, Ma ss media events, GDE LT 1. INTRODUCTION In recent decades, th e rapid develop ment of techniques and theories in the big d ata field has introduced new challenges and oppor tunities to analyze the large amount of in formation available online [1 - 3] , including user-contribut ed (personalized) information such as social m edia data and central-generated traditional mass media. Social media are best characterized b y a ser ies of Social Net work Sites (SNS ) (such as Facebo ok and Twitter) that ha ve attracted worldwide users to communicate, socialize and share their daily lives, whereas mass m edia refers to various f orms of media technologies that aims to reach a large audience via mass communication, including broadcast, prin ted media, film, and new c hannels developed w ith the widespread of the w orld w ide web (W WW), such as online news rep orts. Although many stu dies have focused on how the user - generated contents have revolutionized tr aditional media communications landscape es pecially in the marketi ng field [4 - 5] , researchers have a lso re alized the advantages of mass media contents in its pro fessorial nature: Compared to social media, traditional mass media nat urally ad dresses significant and ag gregated even ts [6]; therefore, they pla y an important ro le in analyzing the so cial, eco nomic, and cultural status of a society. In addition, traditional m ass media ha s evolved for decad es (or even ce nturies), and the data ar e often co llected i n a longer time span, so they ar e more appropr iate to investigate long -term trends and patterns, su ch as the evolvement o f an urban s ystem in the past fe w decades, as w ell as exploring collec tive patter ns o f a society or the connection bet ween societal sys tems [7] . Realizing the necessit y to explore the geographic component of these geota gged news reports, t his researc h utilizes an open- source dataset “The Glo bal Data on E vents, Location and To ne” (GDELT) to analyze the time series of inter-country connections of China w ith respect to ti me . GDELT monitors print, br oadcast and web ne ws media in over 1 00 languages w orldwide and automatically e ncode such data i nto a struct ured database (CAMEO 1 -coded). Although researcher s i n various fields s uch as sociology a nd communication have explored th e potential o f su ch data i n analyzing societal events [8 - 9] , there is limited research in utilizing these extracted mass media data in geography, s uch as analyzing the evol vement of a geographic entit y, or the connection bet w een geographic entities u pon time [10- 11] . We adop t an autor egressive integrated mov ing average (ARIMA) model to a nalyze time series due to its capability of dealing with bo th Autoaggressive (AR) m oving average (MA) and “Integrated” componen ts . T hese models ar e appropriate for ti me series data either to better interpret th e autocorrelation of the d ata, o r to forecast future po ints in the series [12]. Additionally the ARIMA model has the capability to deal with non -stationar y time series data w hich is typicall y associated w ith long-term ne ws events. T his research concentrates on dem onstrating the effectivene ss of applying time serie s analys is to geotagged m ass media data. We do not aim to interpret these patterns from a socio logical perspective. The applied met hodology c an be further extended to various f ields as a data pre-processing strategy, such as public relation, communication and political geography. 1 Conflict and Mediatio n Event Observations (CAMEO) is a framework for coding event d ata 2. METHDOLOGY This research utilizes an open dataset named GDELT. This CAMEO-coded dataset 2 [13] is updated dail y and co nsists of over a quarter-billion ne ws event records dating back to 1979. It captures what has happened/is happening worldwide [3, 8]. The d ata include multiple columns such as the source, actors, time, and approximated location of recorded events. For instance, in news report entitled “In Malaysia, O ba ma carefull y calibrates message to B eijing”. Actor 1 w ill be “ United State s government” a nd Actor 2 is “Chinese Government”. T he associated geograp hic locations of Actor 1, Actor 2 and th e actual ac tion are “ Beij ing, China ” , “ Washingto n DC, United Sta tes ” , and “ Kuala Lumpur, Malaysia ” . As discussed in Section 2, this research concentrates on the inter-countr y relatedness bet w een China and foreign countries. T he anal yses will be conducted fro m t he following two steps : Data Preprocessing First we extrac t all news record s inv olving China and another country as two parties. Note that the location of “action” is not considered as a substantial factor here, si nce an even t r elated to a certain country can happen inside or outside of that country. Based on the pre-processed d ata, we calculate d escriptive s tatistics to provide a general interpretation of the trend at various spatio-te mporal scales. For each y ear each country, we calculate the frequencies of “co - occurrence” w ith China (donated as C ) in the dataset. The frequencies are noted as ( , ) y F i c , which stands for the “co - occurrence” frequency between China a nd co untry i in year y . Here we first define connection strength as follo ws: ( , ) ( , ) ( , ) y y y jc F i c Co i c F j c (1) Where ( , ) y F i c is the frequency of co -occurrence between China and I , an d is the total number of reco rds which involve China and another country as two actors. Note that here the connection strength is not normalized by the total occurrence o f co untry I . U nlike the “ two - way” spatial d ecay ef fect, h ere w e concentrates o n the “one - way” effect focusing o n China as a target geo graphic entity, i.e., how i mportant country I is to China (based on the percentage of its co-occurrence with C hina) without considering how important China is for country I . In this way the ti me series study pro vides more valuable input from China’s perspective. To explore the changing dynamics of this pattern, we compute the yearly connection strength between China and the top 15 countries, rep resented as time serie s data. The following series provides an example series between US and China, wh ich indicates th at the conn ection strength is 0.162 in the year 1979 and 0.179 in 2013 (cf. Equation ( 1) ): US [0.162, 0.174, 0 .191, 0.193, 0.189, 0.189, 0.181, 0.177 , 0.174, 0.169, 0.17, 0.165, 0.162, 0.157, 0.157 , 0.161, 0.17, 0.165, 0.164, 0.165, 0.166, 0.16 , 0 .164, 0.16, 0.159, 0.155, 0 .153, 0.151, 0.153, 0.156 , 0.162, 0.169, 0.175, 0.178, 0.179] Modeling and interpreting time series da ta As discussed in Sectio n 1, ARIMA model ca n be ap plied for bot h station ary and non-stati onary time series data. Due t o its flexibili ty in data processing, this research constructed ARIMA models to better interp ret the summarized time series. ARIMA model is generally referred to as an ARIMA( p , d , q ) model where three parameters p , d , and q are non-negative integers. They refer to the autoregressive , integrated, and moving average parts of the mod el respectively, and are interpr eted as follows: p : the autoregressive parameter indicates how much the outpu t variable depends lin early on its own previous values (e.g., how much the value in 2010 depends o n the years 2009, 2008, and etc.) d : the integrated p arameter is the number of non- seasonal di fferences and long term trend. For instance, in the random walk model ( ) - ( 1 ) Y t Y t (where the a verage difference in Y is a constant, denoted by ), since it includes (only) a non-seasonal difference and a constant term, it is classified as an "ARIM A(0,1,0) model with constant. q : the order of lagged forecast err ors in the prediction. For instance, if series t can be represented by the weighted average of q w hite no ise patterns (Equation 1, where ε t are white noi se series, 1 … q are constants), then t corresponds to ARIMA (0,0, q ). q can be interpr eted as a lev el of uncertainty in time series analysis: q t t t q 1 t 1 (2) The construction of ARIMA m odels provides quantitativ e evidences of ho w the inter-n ation connection of China has changed upon time, and the fitted parameters can be ap plied for predictions and estimatio n of future patterns. 3. RESULTS AND DISCUSSIONS ARIMA models introduced in Section 2 are constructed based on these time serie s. To test th e effectiveness of the models, we u tilized data fro m 1979 -2012 as training set and ( , ) y jc F j c the year 2 013 as testing set for model validation. Tab le 1 presents the models and fit ted results. Table 1. ARIM A models and predicted results Country FIPS Code 3 ARIMA model Fitted 2013 Observed 2013 United States US ARIMA(1,1,0) 0.1798 0.1792 Japan JA ARIMA(1,0,0) 0.0924 0.0929 Russia RS ARIMA(1,0,0) 0.0819 0.0808 South Korea KS ARIMA(0,1,1) 0.0467 0.0465 North Korea KN ARIMA(0,1,1) 0.0421 0.0424 United Kingdom UK ARIMA(1,0,2) 0.0405 0.0414 France FR ARIMA(0,1,0) 0.029 0.029 Iran IR ARIMA(0,1,0) 0.0242 0.0238 Pakistan PK ARIMA(2,0,0) 0.0217 0.0236 India IN ARIMA(1,1,0) 0.0229 0.0227 Australia AS ARIMA(1,1,0) 0.0223 0.0219 Vietnam VM ARIMA(1,2,0) 0.0173 0.0193 Germany GM ARIMA(0,1,1) 0.0184 0.0184 Philippines RP ARIMA(0,1,1) 0.016 0.0152 Canada CA ARIMA(2,1,0) 0.0143 0.014 The fitted ARIMA models in T able 1 indicate interesting patterns. First, the non -zero d value (integrated parameter) for most countries indicates a fact that non -stationary long term trend exists i n the connection b etween China and t hese countries. Figure 1 shows an exam ple time series in South Korea sho wing a clear increasing trend ( d =1). 3 Federal Information P rocessing Standards (FIPS) are publicly announced standar dizations developed b y the United States federal go vernment for use in co mputer systems . Figure 1. Yearl y connection strength between China a nd South Korea Moreover, T able 1 indicates that the 15 co untries can be characterized into the following categories (T able 2 ): Table 2. Categ orized ARIMA m odels and countrie s Characteristics Countries Autoregressive models (p > 0, d = 0, q = 0) The output variable depends linearly on its own previous values JA, RS, PK Autoregressive integrated models (p > 0, d >0, q = 0) Autoregressive models with non- stationary behavior (e.g., long-ter m trend) US, IN, AS, VM, CA Integrated moving average models (p = 0, d > 0, q > 0) For moving average model, the output variable is conceptually a linear regression of the linear combination of q + 1 white noise variables. Integrated moving average models is MA model with non-stationar y behavior KS, KN, GM, RP Autoregressive Moving avera ge models (p > 0, d = 0, q > A combination of MA and AR models without non- stationary UK 0) component General integrated models (p = 0, d > 0, q = 0) The output variable depends only on the orders of non- stationary component FR, IR Table 2 indicates varying patter ns between different countries a nd China. For instance, the connection strength between China a nd Russia is f itted as a stationary process, in which the connection strength for a certain year auto- correlates w ith the value of the previous y ear; ho wever, between China and France, the co nnection strength is a basic rando m walk model (ARIMA(0,1,0 )) where the difference between t wo consecutive years can b e modeled as a co nstant. To validate the m odels w e also computed the predicted connection strength i n 2013 . T he forecast accuracy level of the model is evaluated u sing mean absolute percentage error (MAPE) : 1 1 || n tt t t YF MA PE nY ( 2) Where n is the number of time points, F t is the f orecast value at time t and Y t is the actual data . In Table 2 the average MAPE is 2.39%, which indicates a reliable m odel with low prediction erro r rate (<5%). 4. CONCLUSION This paper employed the GDE LT dataset to examine the connection between Chi na and foreign countries based o n time series analysis. We exa mined the effectiveness o f ARIMA in predictin g trends in long -term mass m edia data. Although ARIMA has been previously applied in political geography and communication fields, the applicatio n in determining inter -country relatio n in the big d ata era is limited. We also d emonstrated the powerfulness o f applying GDELT and big data techniques to investigate informative patterns for interdisciplinary researchers. This research does not aim to p rovide in-depth interpr etation of the causes and consequences of these inter-nation events from a political perspective; instead, it prop osed a method to discover t he patterns that can provide in sights in different research fields. Potential future directio ns include extending this method to other countries to test its robustness. GDELT provides a rich data source to analyze inter-region relatio ns at various spatial scales, such as i nvestigating the co nnection between different provinces i n China. Anot her valuable directio n is to co mpare the perfor mance of mass media and social media in charac terizing urban-level patterns. Fu ture study can also look into the co rrelation betw een connection strengt h and various demographic variables such as population, economic status and the to ne of each event record. 5. REFERENCES [1] N. Eagle , et al. , "Inferring friendship network structure by using mobile phone data," Proceed ings of the Nationa l Academy of Sciences of the Un ited States of America, vol. 106, pp. 1 5274-15278, Sep 8 2009. [2] D. Liben-Nowell , et al. , "Geographic routi ng in social networks," Proceedin gs of the National Academy of S ciences of the United States o f America, vol. 10 2, pp. 11623 -11628, Aug 16 2005. [3] Y. Yuan and Y. Liu, " Exploring inter -country connection in mass media: a case study of China," presented at the Internationa l Conference on Location-based Social Me dia, Athens, Georgia, 2015. [4] A. Stephen and J. Galak, "The Effects of Traditional and Social Ear ned Media on Sales: A Study of a Micro lending Marketplace," Journal of Marketing Research, vol. 49, pp . 624-639, 2012. [5] S. Meraz, " Is there an elite ho ld? Traditio nal media to social media agenda setting influence i n blogs networks," Journal of Comp uter-Mediated Communication , vol. 14, pp. 682-707, 2009. [6] R. M. Liebert and N. S. Sc hwartzberg, " Effects of Mass-Media," Annual Review of Psycho logy, vol. 28, pp. 141 -173, 1977. [7] Y. Yuan and Y. Liu, " Exploring inter -country connections in mass media: a case study of China," presented at the Inter national Conference on Location-based Social Me dia, Athens, GA, 201 5. [8] K. Leetaru and P. Schrodt, "GDELT: Global Data on Events, Language, a nd Tone, 1979 -2012," presented at the Internationa l Studies Association Annual Conference, Sa n Diego, CA, 2 013. [9] J. E. Yonamine, "P redicting future levels of violence in Afghanistan distri ct using GDELT ," UT Dallas20 13. [10] S. B. Cohen and S. B. Cohe n, Geop olitics : the geography o f international relations , 2nd ed. Lanham, Md.: Ro wman & Littlefield, 2009 . [ 11] Y. Liu , et al. , "Analyzing Related ness by Toponym Co -Occurrences o n Web Pages," Transa ctions in Gis, vol. 18, pp . 89-107, Feb 201 4. [12] G. J. S. W ilde, "Effects of Mass-Media Communications on Healt h and Safety Habits - an Overview of Issues and E vidence," Addiction, vol. 88, pp. 983 -996, Jul 1993. [13] P. Schrodt. Conflict a nd Mediation Event Observations Event and Actor Codebo ok V.1.1b3 [Online]. Available: http://eventdata.psu.e du/cameo.d ir/CAMEO.Manua l.1.1b3.pdf
Original Paper
Loading high-quality paper...
Comments & Academic Discussion
Loading comments...
Leave a Comment