Multi-centrality Graph Spectral Decompositions and their Application to Cyber Intrusion Detection
Many modern datasets can be represented as graphs and hence spectral decompositions such as graph principal component analysis (PCA) can be useful. Distinct from previous graph decomposition approaches based on subspace projection of a single topolog…
Authors: Pin-Yu Chen, Sutanay Choudhury, Alfred O. Hero
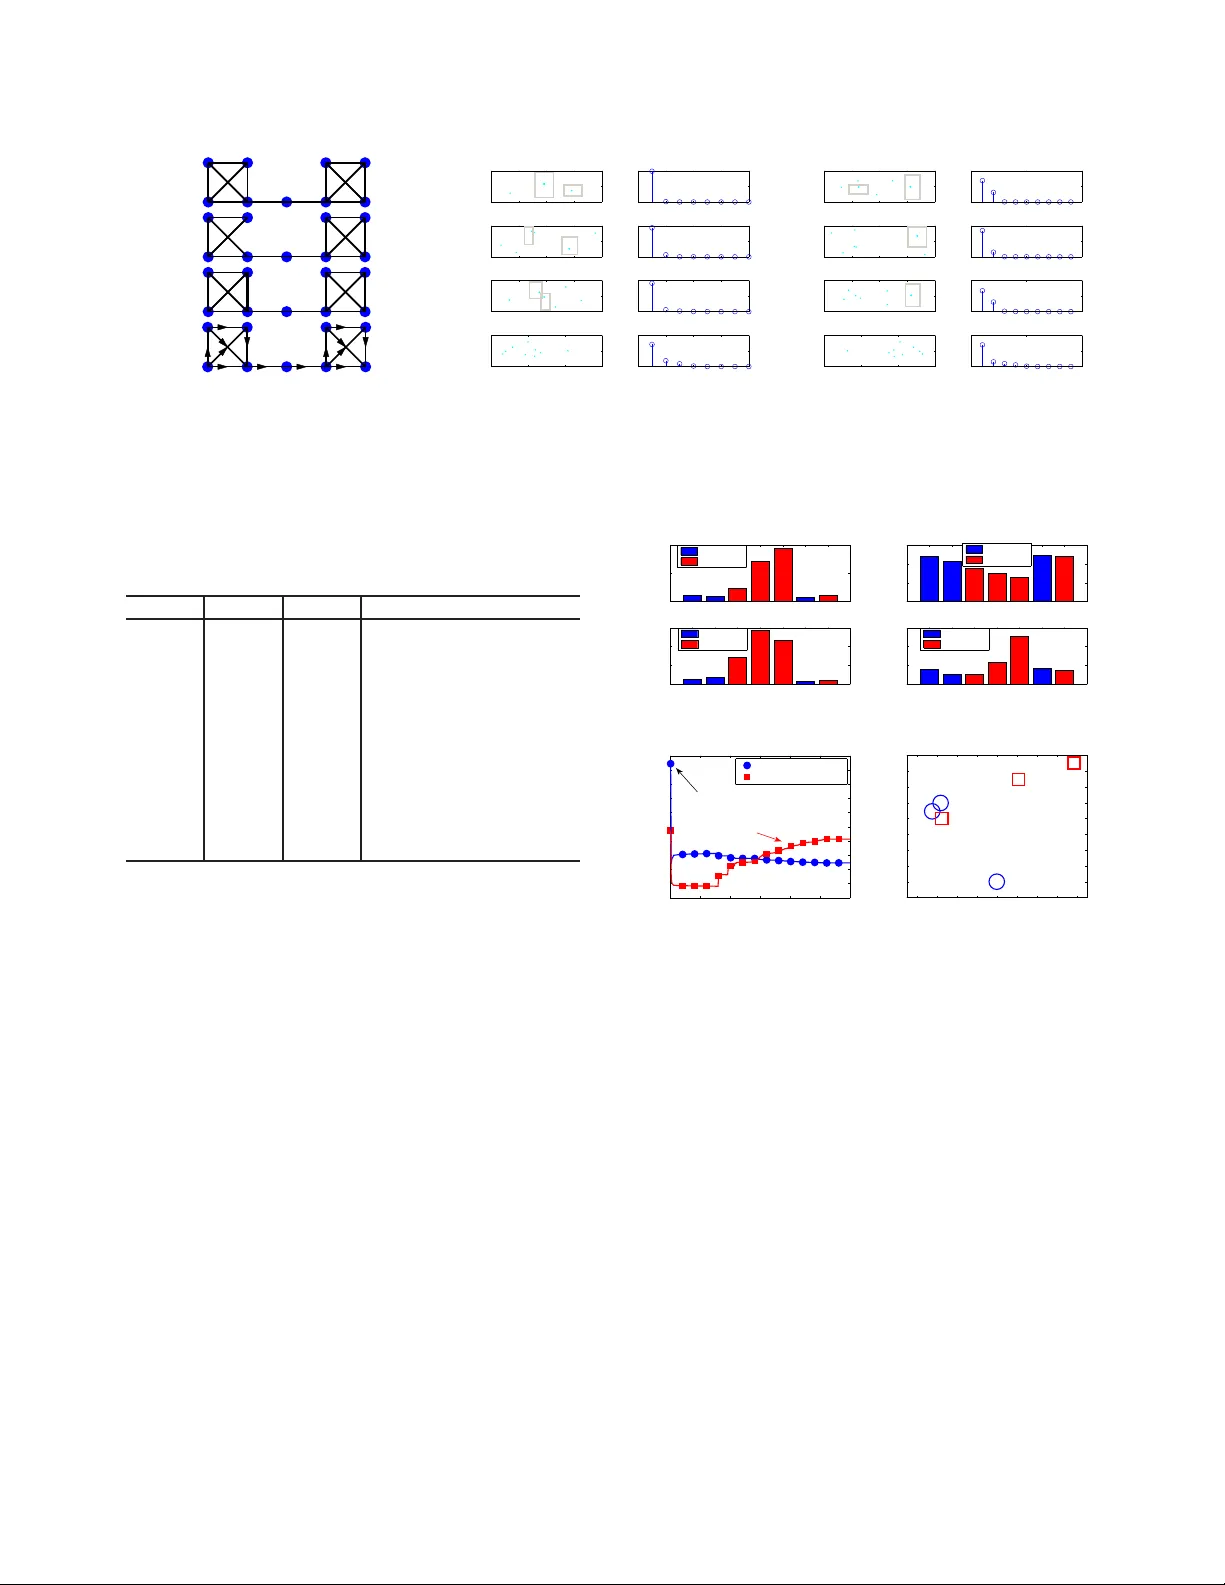
MUL TI-CENTRALITY GRAPH SPECTRAL DECOMPOSITIONS AND THEIR APPLICA TION T O CYBER INTR USION DETECTION Pin-Y u Chen ⋆ Sutanay Choudhury † Alfr ed O. Her o III ⋆ , F ellow , IEEE ⋆ Department of Electrical Engineering and Computer Science, Univ ersity of Michigan, Ann Arbor , USA { pinyu, hero } @umich.edu † Pacific Northwest National Laboratory Sutanay .Choudhury@pnnl.gov ABSTRA CT Many modern datasets can be rep resented as graphs and h ence spe c- tral decompositions such as graph principal componen t analysis (PCA) can be useful. Distinct from pre vious g raph deco mposition approaches based on subspace projection of a single topological feature, e.g., the Fiedler vector of centered g raph adjacency matrix (graph Laplacian), we propose spe ctral decomposition approaches to graph PCA and graph dictionary learning that integrate multiple fea- tures, including graph w alk statistics, centrality measu res an d graph distances to reference nodes. In t his paper we propose a new PCA method for single graph analysis, called mu lti-centrality graph PCA (MC-GPCA), and a ne w dictiona ry learn ing method for ensembles of graphs, called multi-centrality graph dictionary learning (MC- GDL), both based on spectral decomposition of multi-centralit y matrices. As an application to cy ber intrusion detection, MC-GPCA can be an effecti ve indicator of anomalou s connectivity pattern and MC-GDL can pro vide discriminativ e basis for attack classification. 1. INTRODUCTION Many rea l-world data rang ing from physical systems, social inter- actions, network flo ws, kno wledge graphs to biological and chemi- cal reactions are often represented as grap hs, especially for anoma ly or community detection [1–9] and graph signal proc essing [10–14]. Dimensionality redu ction methods on graph s allow one to decom- pose a graph i nto principal compon ents using a spectral decompo- sition of the graph ad jacency or graph Laplacian matrix. In this paper we prop ose a general framew ork to dimensionality reduction based on spectral deco mposition of a matrix composed of many dif- ferent graph centrality statist ics. This general framew ork leads to a single-graph decom position method that extends graph principal componen ts analysis (PCA) a nd a graph-ensemble decomposition method that extends dictionary learning. These me thods are app li- cable to both directed and undirected grap hs with edge weights and are based on a sp ectral decomposition, specifically the singular v alue decomposition (SVD), of a matrix composed of multiple graph cen- trality statistics. The propos ed methods are denoted multi-centrality graph PCA (M C-GPCA) and multi-centrality grap h d ictionary learn- ing (MC-GDL), respecti vely . By integ rating multiple descriptions of graph centrality , the propo sed methods provide graph commu nity This w ork w as partially supported by the Con sortium for V erificat ion T echnology under Departmen t of Energy National Nuclear Security Admin- istrati on awa rd number de-na0002534 and by the Asymmetric Resilient Cy- ber Sec urity initi ati ve at Pacific Nort hwest Nati onal Laboratory , which is op- erated by Bat telle Memorial Instit ute. detection an d graph structure learn ing that are sign ificantly more ro- bust to n oise and v ariation affecting graph conne ctivity structures. In [15], a kind of graph PCA is performed on the distance ma- trix of av erage commu te time between nodes. In [16], PCA can also be performed on the graph Laplacian matrix of nodal similarities. In [1 7], the grap h Laplacian matrix is used as a sm ooth regularization function for rob ust PCA on gra phs. In [18, 19], PCA is performed on the matrix of o rigin-destination traffics. In [20–22 ], dictionary learning methods for graph signals are proposed based on the graph Laplacian matrix. D ictionary learning, also k no wn as sparse cod- ing, linea r unmixing and matrix factorization, has been applied to collections of images, audio, and graph signals to learn low dimen- sional representations that gi v e a sparse approximation to the en- tire collection. Dicti onary learning finds a l o w rank f actored-matrix approximation to the observ ation matrix, whos e co lumns span this collection. Man y dif ferent methods for t his approximation problem hav e been proposed [23, 24 ]. Among the simplest method s is the K-SVD appro ach [25] which uses a sp ectral de composition to deter - mine the best low rank approximation to the observed matrix. For the p urposes of illustration, in this paper we adopt this latter spectral approach for learning a dictionary spanning an ensemble of graphs. More often graph PCA and graph d ictionary learning approaches start with a set of raw multi v ariate data samples, create a similar- ity (or dissimilarity) grap h of the data samples, and aim to learn a lo w-dimensional or sparse representation of the original multiv ariate dataset. When applied to graph data, these methods are o ften limited to graphs that are weighted, undirected and connected, which may not be feasible for applications such as cyber network data analysis. Furthermore, these methods often accomp lish graph decomposition based on a single measure of centralit y , e.g., betweeness central- ity [26], closen ess centrality [27], eg o centrality [28], or eige n v ector centrality [1]. In t his paper we introduce graph spectral de compo- sition me thods that combine multiple centrality measures such as graph walk statistics and graph distances as structural features and apply them to differen t graph types including weighted , directed and disconnected graphs. The proposed M C-GPCA metho d d ecomposes a single graph utilizing multiple centrality features, achieving d i- mensionality reduction and feature decorrelation of the graph. The proposed MC-GDL performs dictionary l earning across a popula- tion o f grap hs using multiple centrality features to learn the atoms of the d ictionary and the correspon ding coef ficients to represent each indi vidual graph in terms of it s projection onto the dictionary . Ap- plying ou r approach to c yber intrusion detection, we u se MC-GPCA to define a structural dif ference score (SDS) that reflects structural v ariations wi thin a graph and we use MC-GDL t o l earn discrimina- tiv e structural atoms for classifying the presence of cy ber attacks. 2. STRUCTURAL FEA TURE EXTRA CTION ON GRAPHS Here we describe three catego ries of generic structural features that can be extracted from a graph, namely graph walk statistics, cen tral- ity measures and internode distanc es. T he utility of the i ntroduced features wi th respect to different graph types, including weighted, di- rected and disconn ected graphs, is summarized in T able 1. While not in v estigated in this paper , application-specific features such as web- site hit rates, social interaction frequenc y , source-destination traffics can also be lev eraged as structural features. Withou t loss of general- ity a graph G = ( V , E ) can be characterized by two n × n matrices A and W representing t he adjacen cy and weight matrix, respectiv ely , where V ( E ) is the set of nodes (edges), and n is the total nu mber of nodes (i.e., graph size). A is a binary matri x such that it s entry [ A ] ij = 1 if there is an edge connecting from nod e i to node j , and [ A ] ij = 0 otherwise. Throughout t his paper we con sider g raphs with nonne gativ e edge weights such that W is a nonne gati ve matrix, where its entry [ W ] ij ≥ 0 if [ A ] ij = 1 , and [ W ] ij = 0 otherwise. 2.1. Graph walk statistics Graph w alk statistics include commute time and cov er time [29], graph dif fusion [3 0], hitting times [3 1], and hop w alks. In this pa per we focus on hop walk statistics. An h -hop walk of a node on a graph is a path starting from t he node and trav ersing through ( possibly re- peated) h edges. An h -hop walk weight is defined as the sum of edge weights of the corresponding path. W e consider the number and to- tal weight of h -hop wa lks of each node as features since they entail the st ructural information of nodal reachab ility relative to its h -hop vicinity . In principle one should ex tract grap h w alk statist ics from h = 1 to at least h = graph diameter hops as structural features, where graph diameter is the largest shortest path hop count between any node pairs in all connected comp onents of a graph. W e propose an ef fi cient iterati v e computation me thod to incrementally computes these two struc tural features with respect to the hop count n umber h : • Iterativ e computation of number of h -hop walks Let A h denote the matrix product of h copies of A . Observe that the entry of A 2 , [ A 2 ] ij = P k [ A ] ik [ A ] kj , is the number of 2 -hop walks f rom i to j . Extending this result t o A h we ha ve [ A h ] ij be- ing the number of h -hop walks from i to j . Let a ( h ) = A h 1 n be a column vector where its entry [ a ( h ) ] i is the number of h -hop walks starting from i and 1 n denotes t he n × 1 column vector of on es. Then a ( h +1) can be computed by the matrix-vector produc t iterati on a ( h +1) = A h +1 1 n = A · A h 1 n = Aa ( h ) . (1) • Iterativ e computation of total h -hop walk weight Let W ( h ) be an n × n matrix su ch that its entry [ W ( h ) ] ij is the sum of all h -hop walk weights from nod e i to node j . Then we hav e [ W ( h +1) ] ij = X k ∈V [ W ] ik · [ A h ] kj + [ W ( h ) ] kj · A ik = X k ∈V [ W ] ik · [ A h ] kj + X k ∈V [ W ( h ) ] kj · A ik = [ W A h + A W ( h ) ] ij , (2) where we use [ W ] ik · [ A ] ik = [ W ] ik . Let w ( h ) = W ( h ) 1 n denote a column vec tor suc h tha t its entry [ w ( h ) ] i is the total h -hop walk weight starting from node i . Then w ( h +1) can be computed by w ( h +1) = h W A h + A W ( k ) i 1 n = W a ( h ) + Aw ( h ) . (3) T able 1 : Utility of the introduced structural features. Feature / Graph T ype W eighted Directed Disconnected # of h -hop graph walks X X X total h -hop walk weight X X X degree X X X betweenness X X closeness X X eigen vector centrality X X X ego X X X LFVC X X graph distance X X 2.2. Centrality measur es A centrality measure is a quantity that ev aluates the level of impor- tance or influence of a node in a graph a nd it reflects certain topolog- ical characteristics. Here we introduce several centrality measures, which will be used i n the sequ el to define feature sets associated wi th a graph or a set of graphs. • Degree. Degree is defined as the number of edges associated wi th a node. It can be exten ded to directed graphs by considering the num- ber of edges connecting to (from) a node as in-de gree (out-degree). • Betweenness [26]. Betweenness is the fraction of shortest pa ths passing through a node relative to the total number of shortest paths in the graph. It is in feasible for d isconnected graphs since it is b ased on shortest path distance. The betweenness of node i is defined as betweenness ( i ) = X k ∈V ,k 6 = i X j ∈V ,j 6 = i,j >k σ kj ( i ) σ kj , (4) where σ kj is the total number of sho rtest paths from k to j and σ kj ( i ) is the number of such shortest paths passing through i . • Closeness [27]. Closeness is associated with the sho rtest path dis- tances of a node to all o ther nodes. Let ρ ( i, j ) denote the shortest path distance between no de i and node j in a connected g raph. Then closeness ( i ) = 1 P j ∈V ,j 6 = i ρ ( i, j ) . (5) • Eigen v ector centrality [1]. Eigen vector centrality of node i is the i -th en try of the eigen vector associated with the largest eigen v alue of the weight matrix W . It is defined as eigen vector centrality ( i ) = λ − 1 max X j ∈V [ W ] j i [ ξ ] j , (6) where ( λ max , ξ ) is t he largest right eigenpair of W T . • Ego centralit y [28]. Ego centrality can be vie wed as a local ver - sion of betweenness that computes the shortest paths between its neighboring n odes. Let d i denote the degree of node i , W ( i ) de- note the ( d i + 1) × ( d i + 1) local weight matrix of node i , I be the identity matrix, and let ◦ denote entrywise matri x produ ct. Ego centrality is defined as ego ( i ) = X k ∈V X j ∈V ,j>k 1 [ W 2 ( i ) ◦ ( I − W ( i ))] kj . (7) • Local F iedler V ector Centrality (LFVC) [32] . L FVC is a cen- trality measure that e v aluates the structural importance of a nod e re- garding graph connectiv ity . Let y denote the eigenv ector associated with the smallest nonzero eigen value of the graph Laplacian matrix. LFVC is defined as LFVC ( i ) = X j ∈N i ([ y ] i − [ y ] j ) 2 , (8) where N i is the set of nodes connecting to or from i (i .e., neighbors). 2.3. Graph d istances to a set of refer ence nodes W e propo se to u se graph distances of each node to a set of refer- ence nodes as structural features that co mpensate the insufficienc y of graph walk stat istics and centrality measures when one performs MC-GPCA on grap hs with high structural symmetry . For exam- ple, consider a star-lik e graph where the central node is a si ngleton and each leaf node is an identical clique (i.e., a complete graph). All edges in the graph are undirected and have identical weight. Therefore this g raph has hig h structural sy mmetry and apparen tly the node s of identical structural property (e.g., connected to the cen- tral node or n ot) have the same graph walk statistics and centrality measures. T o resolve the ambiguity o f graph walk statistics and ce n- trality measures due to high structural symme try in graphs we us e the shortest path distance of each nod e to the selected r reference nodes as the r additional structural features. In the example of t he star-like graph with high structural symmetry , if r = 1 then selecting any but the central node as a reference node can yield distingu ish- able structural features due to difference in shortest path distance to the reference node. The reference nodes are selected according to a user specified criterion, e.g. the nodes of maximal degrees. 3. MET HODOLOGY The ex tracted centrality features introduced in Sec. 2 can be rep- resented as an n × p matrix X , where n is t he graph size, p is the number of extracted features and each column of X correspond s to a particular centrality feature that is normalized to ha ve unit norm. The multi-centrality feature matrix X is then centered by su btracting the ro w-wise empirical av erage from each ro w . 3.1. Mu lti-centrality graph PCA (MC-GPCA) In analogy to standard graph PCA , which is applied to the graph Laplacian matrix, MC-GPCA is PCA applied to X . P CA can b e formulated as finding an orthonormal transformation Q on X such that after transformation th e mu lti-centrality fea ture matrix X is rep- resented by an n × q ( q ≤ p ) matrix Y = XQ that maximally preserves the total data v ariance trace ( Y T Y ) /n , where trace ( · ) de- notes the sum of diagona l entries of a ma trix and Q i s a p × q matrix such that Q T Q = I . Such a matrix Q can b e obtained by solving the q r ight singular v ectors asso ciated with the q largest singu lar v al- ues of X , which is d enoted by a p × q matrix V q . Moreo ver , the total v ariance of Y is equi valent to the sum of t he q squared largest si n- gular v alues of X divide d by n . Therefore using MC-GPCA we ob- tain n q -dimensional coordinates representing structural scores with respect to the q principal components (i.e., columns of V q ). The algorithm for MC-GPCA is summarized in Algorithm 1. 3.2. Stru ctural difference sc ore (SDS) W e use these structural coordinates (i.e., each ro w of Y = XV q ) to define a st ructural dif ference score (SDS ) for each node in a graph. The SDS of node i is associated with the total squared E uclidean Algorithm 1 Multi-centrality graph PCA (MC-GPCA) Input: A graph G = ( V , E ) , desired dimension q Output: n structural coordinates Y for each nod e in G 1. Extract p structural vectors X from G 2. Normalize each column of X to hav e unit norm 3. Subtract row-wise empirical a verage from X 4. Solve the right singular vectors V q of X 5. Y = XV q Algorithm 2 Multi-centrality graph dictionary learning (MC-GDL) Input: A set of g raphs { G ℓ } g ℓ =1 , number of atoms K , sparsity constraint S , nu mber of highest SDS feature z Output: graph structure dictionary D , coefficient matrix C 1. Obtain z highest SDS from (9) for each graph as columns of Z 2. Subtract column-wise empirical average from Z 3. Perform K-SVD on Z to obtain D and C distance to it s neighboring nodes N i and its nu mber of edge s (i. e., degree d i ), which is defined as SDS ( i ) = P j ∈N i k ro w i ( Y ) − ro w j ( Y ) k 2 d i + 1 , (9) where ro w i ( Y ) denotes the i -th row of Y , k · k den otes Euclidean distance, and the denominator d i + 1 is such that the SDS of a sin- gleton node is well-defined. 3.3. Multi-centrality graph dictionary learning (MC-GDL) Consider t he case where a set of graphs { G ℓ } g ℓ =1 is available, each possibly being of different graph size and connectivity pattern, e.g., data from a c yber netwo rk at different time instance s. Multiple- centrality graph dictionary learning (MC-GDL) is proposed to learn a sparse structure representation of { G ℓ } g ℓ =1 by finding a dictio- nary D consisting of K atoms (columns of D ) and an associated sparse coefficient matrix C ∈ R K × g such that the representation error k Z − DC k F is minimized while satisfying the colum n-wise sparsity constraints on C that the n umber of nonzero entries of each column can not exceed a specified v alue S , where the columns in Z are structural features of { G ℓ } g ℓ =1 and k · k F denotes the F robe- nious norm. Many dif ferent methods exist for solving the dictiona ry learning problem of estimating D and C , often called the sparse cod- ing problem [23, 24]. In this paper , we foc us o n a spectral metho d (K-SVD) of dictionary learning introduced in [25]. The proposed MC-GDL selects the z highest SDS from each graph as one column of Z and applies K-SVD to find the dictionary and the correspon ding coef ficient matrix. The algorithm is summarized in Algorithm 2. 4. EXPERIMENTS AND CYBER INTRUSION DETECTION 4.1. Illustration of sensitivity to structural changes on graphs Here we consider four si milar graphs with dif ferent structural char- acteristics as displayed in Fig. 1 (a). From top to bottom, these four graphs represent high structural symmetry , reduced structural sym- metry due to edge remov al, increase of the weight of edge (3,4), an d change in edge direction. The extracted multi-centrality features are 1) graph walk statistics from 1 to 4 hops, and 2) the graph distance to node 1 (the r eference node). It can be observ ed from Fig. 1 (b) unweighted with high structural symmetry 1 2 3 4 5 6 7 8 9 unweighted with low structural symmetry 1 2 3 4 5 6 7 8 9 weighted 1 2 3 4 5 6 7 8 9 directed 1 2 3 4 5 6 7 8 9 (a) Four exa mple graphs −0.4 −0.2 0 0.2 0.4 −0.05 0 0.05 1 2 3 4 5 6 7 8 9 total variance=100% 0 2 4 6 8 0 50 100 principal component variance −0.4 −0.2 0 0.2 0.4 −0.1 0 0.1 1 2 3 4 5 6 7 8 9 total variance=99.82% 2nd principal score 0 2 4 6 8 0 50 100 variance (%) −0.4 −0.2 0 0.2 0.4 −0.1 0 0.1 1 2 3 4 5 6 7 8 9 total variance=97.95% 0 2 4 6 8 0 50 100 −1 0 1 2 −1 0 1 1 2 3 4 5 6 7 8 9 total variance=90.03% 1st principal score 0 2 4 6 8 0 50 100 pricipal component (b) MC-GPCA without reference nodes −0.4 −0.2 0 0.2 0.4 −0.5 0 0.5 1 2 3 4 5 6 7 8 9 total variance=99.73% 0 5 10 0 50 100 pricipal component variance −0.4 −0.2 0 0.2 0.4 −0.2 0 0.2 1 2 3 4 5 6 7 8 9 total variance=99.65% 2nd principal score 0 5 10 0 50 100 variance (%) −0.4 −0.2 0 0.2 0.4 −0.5 0 0.5 1 2 3 4 5 6 7 8 9 total variance=98.20% 0 5 10 0 50 100 −2 −1 0 1 −1 0 1 1 2 3 4 5 6 7 8 9 total variance=84.58% 1st principal score 0 5 10 0 50 100 pricipal component (c) MC-GPCA with one reference node Fig. 1 : Illustrati on of sensiti vity of pro posed MC-GPCA a lgorithm to structural perturbations. Each node on a graph is represented by a 2-dimensional structural coordinate. Nodes marke d by a gray box have identical MC-GPCA score. T able 2 : Description of the Univ ersi ty of New Brunswick (UNB) Intrusion Detection Ev aluation Dataset [33] Dataset # nodes # edges Description Day 1 5357 1 2887 Normal activ ity Day 2 2631 5614 Normal activ ity Day 3 3052 5406 Infiltrating attack and normal acti vity Day 4 8221 1 2594 HTTP denial of service attack and normal activ ity Day 5 24062 32848 Distributed d enial of service attack using Botnet Day 6 5638 1 3958 Normal activ ity Day 7 4738 1 1492 Brute force SSH attack and normal activ ity that MC-GPCA ca n re flect st ructural perturbations, and total data v ariance is ex plained by one or two principal compone nts. More- ov er , the fir st principal component is shown to comp leter describe the netw ork flo w pattern for the directed e xample graph. Fig. 1 (c) sho ws that the graph distance feature adds discrimination power as the MC-GPCA scores are better dif ferentiated. 4.2. Cyber in trusion detection The UNB intrusion detection ev aluation dataset [33] described in T able 2 is a collection of directed cyber network graphs where each node is a host (machine) in a c yber system and a n edge indicates the existence of communication between hosts. No information beyond graph topology is used f or analysis. The extracted multi-centrality features are 1) graph w alk statistics from 1 to 20 hops, 2) all central- ity measures introduc ed in Sec. 2.2 (edge directions are omitted for computing LFVC), and 3) graph distances to 10 reference nodes of highest degree, resulting in p = 56 features (columns of X ). Fig. 2 (a) sho ws that the proposed SDS statistic (Eqn . (9)) with q = 2 prin- cipal compo nents from MC-GPCA. The SDS statistics are similar ov er days without attacks, whereas they are significantly higher in days under att acks that induc e anomalous connec tivity patterns (i.e. Days 3, 4 and 5). On the other han d degree statistic (Fig. 2 (b)) f ails to be a v alid indicator of cyber attacks. The SDS statistic fails to detect the SSH attack (Day 7 ) since it is a passwo rd attack that tak es place only between a single host and a single server . 1 2 3 4 5 6 7 0 5 10 Day average Normal Under Attack 1 2 3 4 5 6 7 0 2 4 6 Day standard deviation Normal Under Attack (a) Graph-wise SDS statistic 1 2 3 4 5 6 7 0 2 4 6 Day average Normal Under Attack 1 2 3 4 5 6 7 0 50 100 150 Day standard deviation Normal Under Attack (b) Graph-wise degree statistic 0 50 100 150 200 250 300 0.03 0.04 0.05 0.06 0.07 0.08 0.09 0.1 0.11 0.12 0.13 SDS feature feature value normal activity atom attack activity atom main router for external and internal traffics higher variantion in SDS feature (c) Dictionary from MC-GDL −80 −60 −40 −20 0 20 40 60 80 −60 −50 −40 −30 −20 −10 0 10 20 30 1 2 3 4 5 6 7 coefficient of normal activity atom coefficient of attack activity atom (d) Coefficien ts from MC-GDL Fig. 2 : Cyber intrusion detection on the UNB dataset. MC-GPCA and MC-GDL are sho wn to be effecti v e indicators of cybe r attacks. W e applied MC-GDL to the entire UNB database of graphs t o learn a d ictionary that s pans the dataset. For this implementation of M C-GDL we select K = 2 atoms, z = 300 SDS features and S = 2 sparsity level. The two learned structural atoms in Fig. 2 (c) can be interpreted as a normal acti vity atom consisting of identical SDS features e xcept for one spik e accounting for the main r outer and an attack activity atom of higher variance in SDS features. The correspondin g coef ficients in Fig. 2 (d) reflect the mixture portion of these atoms and they can be used for attack classification. For instance, K -means clustering with 2 clusters identifies Days 3, 4 and 5 as being anomalous and thus under attack. 5. CONCLUSION This paper prop oses PCA and dictionary learning graph decomposi- tion me thods that are based on multi-centrality features of the graph. The proposed metho ds ca n reflect structural perturbations in graph symmetry , edge weight and edge d irection. When applied to cyber intrusion detection, our experiments sho w that MC-GPCA and MC- GDL can ef fecti vely detect attacks on the netw ork. 6. REFERENCES [1] M. E . J. Newman, Networks: An Intr oduction . Oxford Uni- versity Press, Inc., 20 10. [2] C. C. Noble and D. J. Cook, “ Graph-based anomaly detection, ” in ACM SIGKDD international confer ence on Knowledg e dis- covery and da ta mining , 2003, pp. 631–636. [3] E. Hogan, P . Hui, S. Choudhury , M. Halappanav ar, K. Oler , and C. Jo slyn, “T o wards a multiscale approach to cybersecurity modeling, ” in IEEE International Confere nce on T echnolo gies for Homeland Security (HST) , 2013, pp. 80–85. [4] P .-Y . Chen and A. O. Hero, “ Assessing and safeguarding network resilience to nodal attacks, ” IEEE Commun. Mag. , vol. 5 2, no. 11, pp. 138–143 , N ov . 2014 . [5] C. Joslyn, S. Choud hury , D. Haglin, B. Ho we, B. Nick less, and B. Olsen, “M assi ve scale cybe r traffic analysis: A dri ver for graph database resea rch, ” in Interna tional W o rkshop on Grap h Data Mana gemen t Experiences and Systems (GRADES) , 2013, pp. 3:1–3:6. [6] P .-Y . Chen an d A. Hero, “ Phase transitions in sp ectral commu- nity detection, ” IEEE T rans. Signal Pr ocess. , vo l. 63, no. 16, pp. 4339–4 347, Aug 2015. [7] L. Akoglu, H. T o ng, and D. K outra, “Graph based anomaly detection and description: a surve y , ” Data Mining and Knowl- edge Discov ery , vol. 29 , no. 3, pp. 626–688, 2015. [8] B. M iller , M. Beard, P . W olfe, and N. Bliss, “ A spectral frame- work for anomalous subgraph detection, ” IEEE T rans. Signal Pr ocess. , v ol. 63, no. 16, pp. 419 1–4206, Aug. 2015. [9] K. O ler and S. Chou dhury , “Graph based role mining tech- niques for cy ber security , ” in FloCon , 2015. [10] D. Shuman, S . Narang , P . Frossard, A. Ortega, and P . V an- dergh eynst, “The emerging field of signal processing on graphs: Extending high-dimensional data analysis to networks and other irregular domains, ” IEEE Signa l Pr ocess. Mag . , vol. 3 0, no. 3, pp. 83–98, 2013. [11] A. B ertrand and M. Moonen, “Seeing the bigger picture: Ho w nodes can learn their place within a complex ad hoc network topology , ” IEEE Signa l Pro cess. Mag. , vol. 30, no. 3, pp. 71– 82, 2013. [12] A. Anis, A. Gadde, and A. Ortega, “T o ward s a sampling theorem for signals on arbitrary graphs, ” in IEEE I nterna- tional Confer ence on Acoustics, Speec h and Signal Pr ocessing (ICASSP) , 2014 , pp. 3864–3868. [13] X. W ang, P . Liu, and Y . Gu, “Local-set-based graph signal re- construction, ” IE EE Tr ans. Signal Pr ocess. , vol. 63, no. 9, pp. 2432–2 444, May 2015. [14] S . C hen, A. Sandryhaila, J. Moura, and J. K ov acevic, “Signal recov ery on graph s: V a riation minimization, ” IEEE T rans. Sig- nal Pr ocess. , v ol. 63, no. 17, pp. 4609– 4624, Sept. 2015. [15] M. Saerens, F . Fouss, L. Y en, and P . Dupont, “The principal componen ts analysis of a graph, an d its relationships to spec- tral clustering, ” in Machine Learning: E CML . Springer, 2004, pp. 371–38 3. [16] B. Jiang, C. Ding, B. Luo , and J. T ang , “Graph-laplacian PCA: Closed-form solution and robustness, ” in IEE E Confer ence on Computer V ision and P attern Reco gnition (CVPR) , 2013, pp. 3492–3 498. [17] N. Shahid, V . Kalofolias, X. Bresson, M. M. Bronstein, and P . V an derghe ynst, “Rob ust principal component analysis on graphs , ” CoRR , vo l. abs/1504.061 51, 2015. [Online]. A v ailable: http://arxiv .org /abs/1504.061 51 [18] A. Lakhin a, M. Crovella, and C. Diot, “Diagnosing network- wide traffic anomalies, ” in A C M SIGCOMM C omputer Com- munication Review , v ol. 34, no. 4, 2004, pp. 219–230. [19] J. T errell, K. Jeffay , F . D. Smit h, L. Zhang, H. Shen, Z. Zhu, an d A. Nobel, “Multi v ariate SVD analyses for network anomaly detection, ” in ACM SIGCOMM Confer ence P os ter Session , 2005. [20] D. Thanou, D. S human, and P . Frossard, “Learning parametric dictionaries for signals on graphs, ” IE EE T rans. Signal Pro- cess. , vo l. 62, no. 15, pp. 3849–386 2, Aug. 2014. [21] X. Zhang, X . Dong, and P . Frossard, “Learning of struc- tured graph d ictionaries, ” in IEEE In ternational Confer ence on Acoustics, Speec h and Signal Pr ocessing (ICASSP) , Mar . 2012, pp. 3373–3 376. [22] D. Thano u and P . Frossard, “Multi-graph learning of spec- tral graph dictionaries, ” in IEEE International Con fer ence on Acoustics, Speech and Signal Pr ocessing (ICASSP) , Apr . 2015, pp. 3397–3 401. [23] H. Lee, A. Battle, R . Raina, and A. Y . Ng, “E fficient sparse coding algorithms, ” in A dvances in neural information pr o- cessing systems (NIPS) , 2006, pp. 801–8 08. [24] R. Jenatton, J. Mairal, F . R. Bach, and G. R. Obozinski, “Prox- imal methods for sparse hierarchical dictionar learning, ” in In- ternational Confer ence on Mac hine Learning (ICML) , 2010, pp. 487–49 4. [25] M. A haron, M. El ad, and A. Bruckstein, “K-SVD: An algo- rithm for designing ov ercomplete dictionaries for sparse rep- resentation, ” IEEE Tr ans. Signal Pr ocess. , vol. 54, no. 11, pp. 4311–4 322, 2006. [26] L . Freeman, “ A set of measu res of centrality based on b etween- ness, ” Sociometry , vo l. 40, pp. 35–41, 1977. [27] G. Sabidussi, “The centrality index of a graph, ” P sycho metrika , vol. 3 1, no. 4, pp. 581–603, 1966. [28] M. Everett and S. P . Bor gatti, “Ego network between ness, ” So- cial Networks , vo l. 27, no. 1, pp. 31–38, 2005. [29] L . Lo v ´ asz, “Random walks on graphs: A surv ey , ” Combina- torics, P aul er dos is eighty , vol. 2, no. 1, pp. 1–46, 1993. [30] M. Gomez Rodriguez, J. Lesk ov ec, and A. K rause, “Inferring networks of diffusion and influence, ” in ACM SIGKDD inter- national confer ence on Knowledg e discover y and data mining , 2010, pp. 1019–10 28. [31] L . Galluccio, O. Michel, P . Comon, M . Kliger , and A. O . Hero, “Clustering with a ne w distance measure based on a dual- rooted tree, ” Information Sciences , v ol. 251, pp. 96–113 , 2013. [32] P .-Y . Chen and A. O. Hero, “Loc al Fiedler v ector c entrality for detection of deep and overlapping communities in networks, ” in IEEE International Confer ence on Acoustics, Speec h and Signal Pr ocessing (I CASSP) , 2014, pp. 1120–1 124. [33] A. Shirav i, H. Shiravi, M. T a v allaee, and A. A. Ghorbani, “T o ward de veloping a systematic approach t o generate bench - mark datasets for intrusion detection, ” Computers & Security , vol. 3 1, no. 3, pp. 357–374, 2012.
Original Paper
Loading high-quality paper...
Comments & Academic Discussion
Loading comments...
Leave a Comment