Measures of Human Mobility Using Mobile Phone Records Enhanced with GIS Data
In the past decade, large scale mobile phone data have become available for the study of human movement patterns. These data hold an immense promise for understanding human behavior on a vast scale, and with a precision and accuracy never before poss…
Authors: Nathalie E. Williams, Timothy A. Thomas, Matthew Dunbar
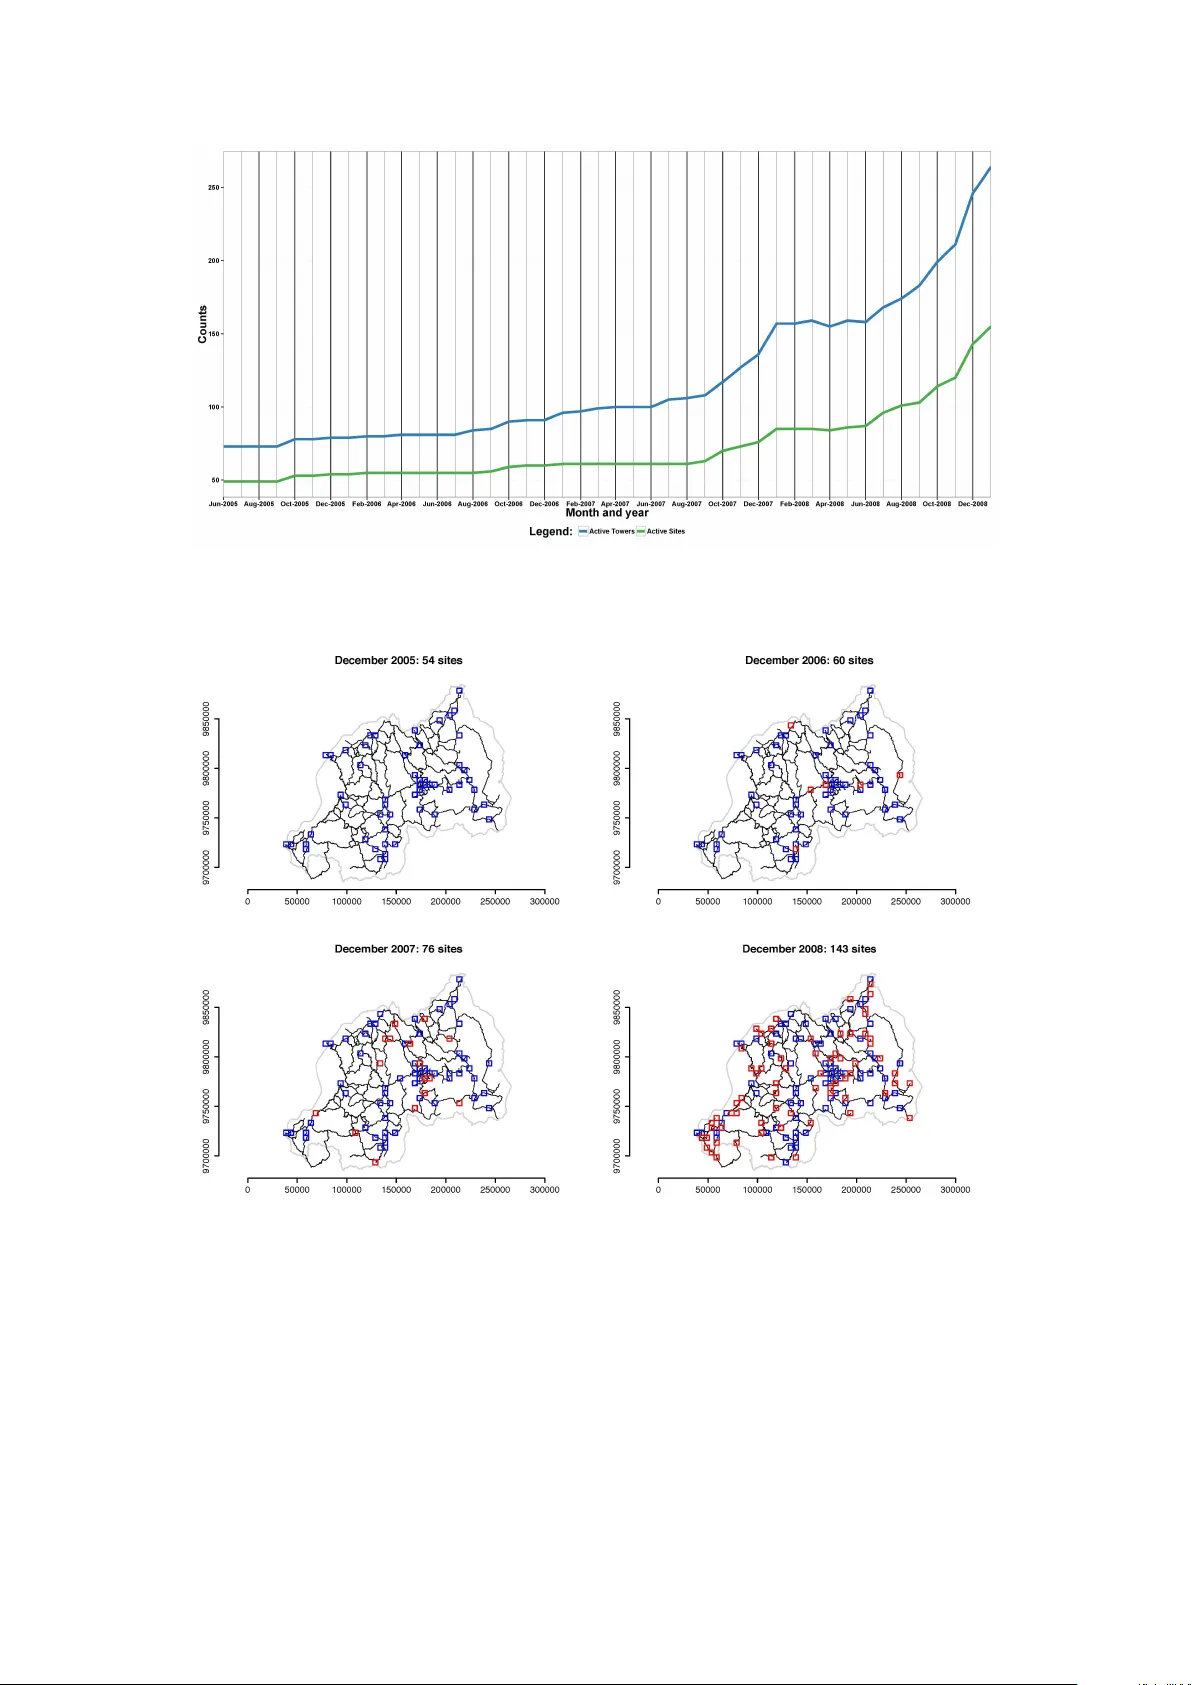
MEASURES OF HUMAN MOBILITY USING MOBILE PHONE RECORDS ENHANCED WITH GIS D A T A NA THALIE E. WILLIAMS, TIMOTHY A. THOMAS, MA TTHEW DUNBAR, NA THAN EAGLE, AND ADRIAN DOBRA Abstract. In the past decade, large scale mobile phone data hav e become av ailable for the study of human mov emen t patterns. These data hold an immense promise for understanding h uman b eha vior on a v ast scale, and with a precision and accuracy never before p ossible with censuses, surv eys or other existing data collection techniques. There is already a significant b ody of literature that has made key inroads in to understanding human mobility using this exciting new data source, and there hav e b een sev eral different measures of mobility used. Ho wev er, existing mobile phone based mobility measures are inconsisten t, inaccurate, and con- founded with social c haracteristics of lo cal context. New measures w ould b est be dev eloped immediately as they will influence future studies of mobility using mobile phone data. In this article, we do exactly this. W e discuss problems with existing mobile phone based measures of mobilit y and describ e new metho ds for measuring mobility that address these concerns. Our measures of mobility , which incorp orate b oth mobile phone records and detailed GIS data, are designed to address the spatial nature of human mobility , to remain indep enden t of so cial c haracteristics of context, and to b e comparable across geographic regions and time. W e also con tribute a discussion of the v ariet y of uses for these new measures in developing a b etter understanding of how human mobility influences micro-level human b ehaviors and well-being, and macro-lev el so cial organization and change. KEYW ORDS: Big data, call detail record, human mobility , migration Contents 1. In tro duction 2 2. Dimensions of Mobility 3 3. Existing CDR-Based Measures of Mobility 3 4. New CDR-Based Measures of Mobility 6 4.1. Group A: Measures of frequency of mobilit y 7 4.2. Group B: Measures of spatial range of mobility 8 4.3. Group C: Measures of spatial range and frequency of mobilit y 9 5. Assessmen t of the Prop osed Measures of Mobility 9 6. Discussion 11 Ac kno wledgments 12 Supplemen tary Information (SI) App endix 12 SI1: The Road Netw ork and the Grid Cell System 12 SI2: The T em poral Dynamics of the Cellular Netw ork 15 SI3: Measures of Mobility 15 SI4: Addressing the Possibilit y of Air T ra v el for the Prop osed Mobility Measures 19 SI5: Longitudinal Pairwise Asso ciations of Measures of Mobility 19 SI6: Categories of callers defined by their mobilit y with resp ect to the measures in Groups A, B and C 26 SI7: Chec king the Quality of CDRs with the Measure of Mobilit y Time T rav eled (TT-R) 29 References 31 Date : No vem ber 19, 2021. 1 1. Introduction Human mobility , or mov emen t o ver short or long spaces for short or long p erio ds of time, is an imp ortan t yet under-studied phenomenon in the so cial and demographic sciences. While there hav e been consistent adv ances in understanding migration (more permanent mov emen t patterns) and its impact on h uman well-being, macro-so cial, p olitical, and economic organiza- tion [1, 2, 3, 4, 5, 6, 7, 8, 9, 10, 11, 12, 13, 14], adv ances in studies of mobilit y ha v e b een st ymied b y difficulty in recording and measuring ho w h umans mo ve on a min ute and detailed scale. This gap is particularly glaring given that mobility is lik ely a fundamental factor in b ehavior and macro-level social c hange, with lik ely asso ciations with k ey issues that face human so cieties to da y , including spread of infectious diseases, resp onses to armed conflict and natural disasters, health b eha viors and outcomes, economic, social, and p olitical well-being, and migration. In this context, new metho ds for measuring human mobilit y could lead to significan t adv ances in the p olicy relev an t so cial and demographic sciences. Mobile phone data hav e recen tly become a v ailable for the study of h uman mobility . Suc h data are contin uously collected by wireless-service pro viders for billing purp oses and to improv e the operation of their cellular net works [15]. Every time a person mak es a v oice call, sends a text message or go es online from their mobile phone, a call detail record (CDR) is generated which records time and day , duration and type of communication, and an iden tifier of the cellular tow er that handled the request. The appro ximate spatiotemporal tra jectory of a mobile phone and its user can be reconstructed by linking the CDRs asso ciated with that phone with the lo cations (latitude and longitude) of the cellular tow ers that handled the calls. This exciting new type of data holds immense promise for studying human b eha vior with precision and accuracy on a v ast scale nev er b efore p ossible with surveys or other data collection techniques [16]. As mobile phone penetration increases dramatically w orldwide to an estimated 120.8 (90.2) mobile-cellular subscriptions p er 100 inhabitants in dev eloped (developing) countries b y the end of 2014 [17], selection in who uses mobile phones is decreasing, thereb y reducing biases related to phone o wnership [18] and making CDRs ever m ore appropriate for studying human mobility of whole p opulations. There is a significan t bo dy of literature that has already made k ey inroads into understandin g mobilit y using this exciting new data source, and there ha v e b een several different measures of mobility used [19, 20, 23, 24, 25, 26, 27, 28, 18]. Ho w ev er, there has b een little discussion and assessmen t of these measures. Consequently , we understand little about what they actually measure and ho w they p erform. Indeed, w e argue that existing measures of mobility from CDRs do not measure mobilit y accurately or consisten tly , are confounded with other con textual c haracteristics, and are therefore not suitable to adv ance mobilit y studies. W e further argue that the need for impro v ed measures of mobility would b e best addressed immediately as this will influence the conclusions of future studies of mobility using mobile phone data. T ow ards developing accurate and meaningful measures of mobilit y with CDRs, and adv ancing this promising area of so cial science, in this article we propose six no vel measures of mobility deriv ed from CDRs. W e define key dimensions of mobility and describ e existing measures of mobilit y and the problems they entail. Using this background, we then prop ose and analyze six new measures that directly address eac h dimension of mobility and o v ercome the inheren t problems with existing measures by com bining CDRs with detailed GIS data on road netw orks. W e carefully assess our measures using CDR and GIS data from Rw anda. An imp ortant dif- ference in our proposed measures from those used previously is that they are fundamen tally based on existing spatial analytical metho ds, reflecting the spatial nature of mobilit y . A second k ey difference is that they accoun t for ho w humans actually mov e, whic h is most often via road net w orks and through man y places, instead of by apparition or “as the crow flies” from one place to another. A consequence of our spatial and mov emen t p ersp ectiv es is that they pro duce pure measures that address only mov emen t of humans and are not affected by other character- istics of so cial con text b esides the roads up on whic h p eople mov e. Another consequence is that they are designed to b e broadly applicable to differen t geographic settings regardless of human 2 b eha vioral patterns or v ariation in context. This article ends with a discussion of the new wa ys in whic h these measures can be used to adv ance the scientific study of human mobility . F or illustration we analyze anonymized CDRs pro vided b y a ma jor cellular phone service pro vider in Rw anda. These data comprise all mobile phone activity in the provider’s netw ork b et w een June 1, 2005 and January 31, 2009 [19, 20]. T o ev aluate existing and new measures of mobilit y , we define spatiotemp oral tra jectories of each caller in the pro vider’s net w ork from the CDRs they generate in ev ery given month. This yields 20,139,971 p erson months of spatiotem- p oral tra jectories — for additional details, see SI Appendix, Section SI2 . Calculation of our measures from these spatiotemp oral tra jectories is detailed in SI App endix, Section SI3.2 whic h provides formulas and technical details. 2. Dimensions of Mobility In order to b etter define the problems with existing measures of mobility , to design new measures, and to assess measures, we delineate t w o key dimensions of mobility . The first k ey dimension is the frequency of mo v emen t, and represents the n umber of times a p erson go es an ywhere. The higher the frequency , or more times a p erson mov es, the higher should b e the v alue of their mobility measure. What constitutes going somewhere and what designates separate trips dep ends on definition and these definitions v ary by study and con text [21, 22]. One of our primary motiv ations is to create coherent measures of mobilit y , including frequency of mov emen t, that are meaningful in each sp ecific context but comparable across con texts. The second k ey dimension of mobility is spatial range, or how far a p erson mov es. The further a p erson mov es, the higher should b e the v alue of their mobility measure. 3. Existing CDR-Based Measures of Mobility Existing measures of mobilit y deriv ed from CDRs include n um b er of to w ers used (NTU), distance tra v eled-straigh t line (DT-SL), maxim um distance tra v eled (MDT), and the most com- monly used measure, radius of gyration (RoG) – see, among others [18, 19, 20, 23, 24, 25, 26, 27, 28]. Measures of mobilit y are defined with respect to a fixed pe riod of time, e.g. hours, da ys, w eeks, months or y ears. Here w e c hose months as the reference time perio d, but our metho dological dev elopmen ts and conclusions are relev ant for shorter or longer reference time p eriods. The NTU measure counts the num b er of cellular tow ers from which a p erson called in the requisite p eriod of time. The DT-SL measure, also called av erage trav el distance [24], is the sum of straight line or “as the cro w flies” distances b et w een tow ers from whic h consecutive calls or texts were made. The MDT measure calculates the maximum straight line distance b et w een t w o tow ers that a p erson used. The RoG is determined b y first finding the center of mass of all cellular tow ers that a person used. The straigh t line distances from the cen ter of mass to eac h used to w er are calculated, and the v alue of RoG is the square ro ot of the mean of the squares of these distances. SI App endix, Section SI3.1 gives formulas and related details. W e exemplify the ev aluation of these four measures with the spatiotemp oral tra jectory of the caller, P , who had the largest RoG from all 20 million tra jectories in the Rwandan data — see Figure 1. During Octob er 2005, P made only tw o calls in this provider’s net work: the first call from a lo cation near the northern b order with Uganda and the second call from a lo cation near the w estern border with Demo cratic Republic of Congo. The NTU measure for this p erson is equal to 2 (10th p ercen tile). The DT-SL and the MDT measures are b oth 236.8 km (78th and 100th p ercen tile, resp ectiv ely). The RoG of P is 118.6 km. These four measures of mobilit y hav e sev eral critical shortcomings. Two of the primary problems are caused by their direct definition with resp ect to the lo cation of the cellular tow ers and the fact that to w er placemen t is not random or ev enly spaced [15]. Figures 1 and S1 ( SI App endix ) show the unev en v ariation in to w er placement in Rwanda: the capital Kigali has a high tow er density with resp ect to the rest of the country which comprises mostly rural areas. Consider a p erson who liv es in Kigali with 50 to wers within a 5 km radius. This individual could regularly mo v e within only this 5 km disk, but their CDRs w ould document them as using 3 Figure 1. Map of the monthly spatiotemp oral tra jectory of the caller with the largest mon thly RoG. This caller whic h w e refer to as P made t w o calls in Octob er 2005: the first one from a cellular tow er lo cated in the grid cell lab eled “Site 1976” and the second one from a cellular to w er located in the grid cell lab eled “Site 360.” There are 2040 5km x 5km grid cells indexed from 1 (the cell in the lo w er left corner) to 2040 (the cell in the upp er righ t corner). A site is a grid cell that con tains at least one cellular to w er. The map shows the lo cation of the straigh t path b etw een sites 1976 and 360, and also the location of the quic k est road route – the road route with the smallest estimated trav el time – b et w een the t w o sites. The straight path betw een the t w o to w ers used b y P is 236.8 km long, while the straight line path b etw een the centroids of sites 1976 and 360 is 237.2 km long. The quic kest road route b et w een the cen troids of sites 1976 and 360 is 432.1 km long. The estimated tra v el time along this route is 6 hours and 4 min utes. The map also shows the cen ter of mass required for the calculation of RoG whic h is lo cated in the middle of the straight path, as well as Rw anda’s b orders, Rw anda’s road netw ork structure with trunk, primary , secondary and tertiary roads, and the lo cations of the all the 239 cellular tow ers references in the Rwandan CDRs. W e note that only 78 of these to w ers were activ e (i.e., handled at least one communication) in October 2005. The grid cells that contain at least one activ e to wer in October 2005 are referred to as sites for that mon th. The visited sites associated with the spatiotemporal tra jectory of P are the sites which are intersected by the quick est road route b etw een sites 1976 and 360. There are 19 visited sites which are shown in blue. All the grid cells in tersected b y this route are called visited cells. The visited cells that are not visited sites are sho wn in green. The inset sho ws the capital Kigali and its surrounding area. This is the region with the highest cellular to w er densit y in Rw anda. The Rw andan road net w ork is publicly a v ailable data under the Op en Database License, and comes from Op enStreetMap (op enstreetmap.org), a global op en-source mapping pro ject. 4 50 tow ers and their mobility could b e then calculated as high. Compare this p erson to a second p erson living in a rural area with only one to w er in a 5 km radius of their home. Even if they mo v e ab out this 5 km disk as often as our urban individual, the rural individual w ould only ev er use this one to w er and th us b e classified as not moving an ywhere and attain the lo west mobilit y rating. Th us, if not taken in to account, v ariations in tow er density create v ariations in mobility that do not actually exist. This issue is further exacerbated by the fact that cellular to w ers are placed more often in urban areas with high p opulation density , p olitically imp ortan t areas, suc h as capital cities, or w ealthy areas with higher mobile phone p enetration. In short, b ecause to w er density is confounded with so cial, economic, p olitical, and demographic characteristics of con text, existing mobilit y measures that rely on to wer density are confounded with these con textual factors as well. A second, and related, concern is that the placement of cellular to w ers v aries with time. In man y countries, where the mobile infrastructure has not yet reached saturation, new cellular to w ers are built ev ery year to accommo date increasing num bers of users. F or example, the total 269 tow ers in Rwanda existed in v arious time p erio ds from June 2005 to January 2009 and Figure S3 ( SI App endix ) documents the gro wth in the n um b er of Rwandan callers from 190 thousands in June 2005 to more than 1 million in Decem ber 2008. T ow ers are added in the proximit y of other to w ers, but also in regions without previous cellular co v erage — see Figures S4 and S5 ( SI App endix ), while others are taken off the grid. This creates a situation where the spatial density of cellular to wers, which is already a problem for existing CDR-based mobilit y measures, is time-v arying. In other words, there is temp oral v ariance in the spatial v ariance of cellular to w ers. Because existing measures use tow ers as their spatial reference p oin ts, this causes a situation of spatial and temp oral bias in these measures. In addition to the problem that existing measures are confounded with to w er density , they are also inherently confounded with call frequency . The more often a p erson calls, the more tow ers at which they will b e registered. A p erson who uses their phone frequen tly will likely ha v e a differen t mobility rating, compared to a p erson with the same spatiotemp oral tra jectory but lo w er calling frequency . This problem is particularly acute giv en that call frequency is selective of men and wealthier p eople [18]. Confounding with call frequency is essentially a missing data problem and creates inconsistencies b et w een individuals. An analogous missing data problem is with areas that hav e no cellular tow ers. CDRs do not accoun t for mov emen t of p eople in areas with no to w er co verage. Th us this zero to wer issue is also a missing data problem, but creates inconsistencies b et w een areas. The temporal and spatial sparsit y of CDRs [15] that affects the call frequency and zero tow ers problems b ecomes apparent in the spatiotemp oral tra jectory of the highest RoG caller P . This p erson made only tw o calls near tw o distan t Rwandan borders. Giv en the time elapsed b et w een the tw o calls and Rwanda’s transp ortation infrastructure, it is very unlikely that P tra veled by air b et w een the t wo locations. Therefore P w as most likely presen t in sev eral other lo cations in Rwanda, somewhere along the w ay betw een the t w o tow ers that handled their tw o calls. This leads to underestimates of the v alues of NTU, DT-SL and MDT. Ev en more serious is the fact that locations with cellular co v erage that w ere visited but not represented in the CDRs can hav e a significant effect in the determination of the lo cation of the center of mass, whic h subsequen tly translates into biased v alues of RoG. A fourth problem is that the existing measures of mobilit y are fundamen tally based on im- plicit, y et unrealistic assumptions ab out the nature of h uman mo vemen t. Their definitions in v olve measuremen t of distances in straight lines b et w een cellular tow ers. In fact, h umans almost never trav el in straigh t lines and outside of air tra v el (which we discuss in SI App en- dix, Section SI4 ) they do not usually appear in one place, then disapp ear and app ear again in another distan t place. F or example, with caller P , who was registered as b eing presen t in one side of Rwanda, then again in another side of the coun try , it is lik ely that he/she tra v eled longer distances on roads b et ween these points. The straight line distance b etw een the to w ers used is 236.8 km, but the quick est road route b et w een the same lo cations measures 432.1 km – 5 an increase of 82%. This clearly causes underestimates in the v alues of DT-SL and MDT and v arying bias in RoG. The fifth problem is that it is not en tirely clear which asp ect(s) of mobilit y most of these measures capture. Due to v arying densit y of cellular to w ers, the NTU measure do es not capture spatial range. How ever, b ecause it counts unique tow ers, it also do es not assess frequency of mo v ement. The DT-SL measure captures b oth frequency of mo v emen t and spatial range. The MDT measure, b ecause it incorp orates only tw o of the tow ers used, captures neither frequency nor spatial range well. The RoG measure do es not capture frequency of mov emen t. While it initially app ears to capture spatial range, it do es so in an inconsistent manner that is influenced b y call frequency from eac h tow er used. T ake the example of caller P (see Figure 1) and of another fictiv e caller, P 0 , who mak es 1000 calls from the tow er used b y P for their first call, and only one call from the tow er used by P for their second call. The center of mass of P 0 ’s tra jectory will b e very close (236.5 meters a w a y) to the lo cation of the to w er used by P for their first call, and will b e 118 . 1 km a w a y from the cen ter of mass of P ’s tra jectory . Th us, despite the spatial range co v ered b y P and P 0 b eing exactly the same, the v alue of RoG for P 0 will b e 7.5 km which is very small compared to 118.6 km, the v alue of RoG of P . In summary , three of the four existing measures (NTU, MDT and RoG) do not clearly and consistently measure either of the k ey dimensions of mobility . Only DT-SL, whic h incorp orates b oth frequency and spatial range do es so. Y et even this measure suffers from the ma jor shortcomings outlined ab ov e. 4. New CDR-Based Measures of Mobility Giv en these concerns about existing measures of mobilit y , our in tent is to design new measures that: (i) are independent of mobile tow er densit y and the so cial characteristics of con text that influence tow er density; (ii) are less dep enden t on users’ call frequency , mov ement in areas with no to wer co v erage, and the temp oral dynamics of the underlying cellular netw ork of to wers; (iii) measure clearly defined asp ects of mobilit y such as the frequency and spatial range of mo v emen t; and (iv) are relev an t and comparable across contexts, countries, and time. The first foundation of our measures is a system of grid cells of even size placed across a coun try or area of study . F or Rw anda we c hose to w ork with 2040 grid cells each measuring 5 km x 5 km. Several key explanations related to the practical implemen tation of a grid system for mobilit y measurement, including how the grid is placed on a map and the size of grid cells, are discussed in SI App endix, Section SI1 . As shown in Figures 1 and S2 ( SI App endix ), some grid cells ha ve a cellular tow er in them, some do not, and some hav e multiple cellular to w ers. W e refer to a grid cell with at least one active tow er as a site. With the grid system, if an example p erson, R , calls from a cellular to w er, we register them as b eing located at the centroid of the corresp onding site (grid cell). Mov ement is then calculated only when R mo v es from one site to another. If R calls again from another tow er in the same site, then they are registered in the same site, and th us hav e not mov ed. But if the next call R mak es is handled by a to wer in a different site, then they hav e mov ed. Our metho dology en tirely disp oses of cellular tow ers and instead replaces them with the sites they b elong to. By doing so, the problem of spatial v ariation in tow er density is eliminated b ecause grid cells are of ev en size and non-ov erlapping. By replacing cellular tow ers with sites, the adv erse effect of the temp oral v ariabilit y of the spatial exten t of cellular to w ers co v erage is also significan tly diminished. In a giv en time perio d, a to w er is activ e if it handled at least one cellular comm unication during that perio d. Otherwise a tow er is inactive and do es not contribute to the creation of a site. Figure S5 ( SI App endix ) sho ws that, in the Rw andan data, the month to mon th increase in the num b er of sites is muc h smaller than the month to mon th increase in the num ber of active tow ers. Spatiotemp oral tra jectories constructed with resp ect to sites instead of cellular tow ers will hav e less temp orally induced bias as the set of sites will alwa ys change less than or equal to the set of active cellular to w ers during any time p erio d. The second foundation of our measures is a set of realistic assumptions about how h umans tra v el: they most often use roads, will tak e the quick est, most accessible road route from one 6 place to another, and the sp eed of tra v el is affected b y sp eed limits and qualit y of road surfaces. With these assumptions, we use publicly av ailable GIS data on road systems to create routes of tra v el from one place to another that are not straight lines – see SI App endix, Section SI1 . With this information, it is p ossible to calculate an assumed route of trav el b et w een any t w o p oin ts in a coun try , where the assumed route has the shortest p ossible trav el time compared to all other routes. Because all our measures are based on a grid system, we create assumed routes of trav el that begin at the centroid of a site from which a person placed a call, tak e the shortest distance route to the nearest road from the site’s centroid, trav el the quic kest route of tra v el to the site in which their next call w as placed, and end at the centroid of that site. The third foundation of our measures is that humans most often trav el on the ground. Even if they do not make calls at every place they visit, w e can assume they existed for some amount of time in every place along a road route, betw een t w o subsequent calls. This assumption partially ameliorates the confounding influence of call frequency and no av ailable tow ers on mobilit y measuremen t. In the existing measures of mobilit y , only places where a p erson made calls are included in the spatiotemp oral tra jectories these measures are based on, thus higher call frequency inflates mobility ratings. Here, b ecause w e account for places where p eople made calls and places where they did not but lik ely existed for an y amount of time, call frequency is less confounding. F or spatiotemp oral tra jectories that inv olv e longer trips with one call at their origin, another call at their destination and no calls in-b et w een (see the example of caller P ), the absence of in-b etw een calls has a reduced effect on our prop osed measures of mobilit y b ecause we also include in the tra jectory sites and grid cells lo cated on the quick est road routes – see Figure 1. Based on these foundations w e create six new mobility measures, and divide them into three groups dep ending on which of the t w o k ey dimensions of mobilit y they capture. Group A includes measures that capture the frequency of mobility , but do not capture spatial range; group B includes measures that capture spatial range, but not frequency; and group C includes measures that capture b oth frequency and spatial range. There is more than one measure in groups B and C and these differ primarily b y unit of measuremen t. The measures within groups are of course related and th us correlate strongly . Below w e describ e these new measures, their b enefits, and their limitations. W e exemplify the ev aluation of our new measures with the spatiotemp oral tra jectory of caller P who made t wo calls in Octob er 2005, one call from site 1976 and a second call from site 360 (Figure 1). Com binations of measures that belong to every one of these three groups are needed to iden tify v arious mobility patterns that exist in a population. F or example, caller P (Figure 1) made only one long trip, therefore their mobilit y will b e rated as high by measures from group B, but not by measures in groups A and C. Consider tw o other callers P 1 and P 2 that go from home to work and back for 20 da ys eac h month, but P 1 ’s w ork is 1 km from his home and P 2 ’s work is 10 km from her home. Th us they mo v e with equal frequency in a giv en p erio d of time, but distances b etw een consecutiv e places in P 1 ’s tra jectory are shorter than those for P 2 ’s tra jectory . In this case, the mobility of P 1 and P 2 will b e equal when ev aluated by measures from group A, but will differ when ev aluated by measures from groups B and C. The particular measure or combination of measures one uses will dep end on the research question and context of each study . W e advocate at least testing analyses with all six mobility measures. 4.1. Group A: Measures of frequency of mobilit y . Num b er of trips (NT) . This mea- sure is a coun t of the num ber of times a p erson makes a call from a different grid cell than the previous call. If a p erson makes a call from one grid cell and their next call is from the same grid cell (regardless if it is from a different to w er) then this is not a trip. P made tw o calls from t w o different sites, th us the v alue of NT is equal to 1 (10th p ercen tile). If P would hav e made an y num ber of subsequen t calls using only the tw o to wers from site 360, the v alue of NT would b e unc hanged. Note that this measure do es not depend on ho w far a p erson trav els (spatial range): P could hav e called from any t w o of the active sites, and the v alue of NT would b e the 7 same. But if P makes a call from another site, the v alue of NT will increase by 1. The amount of time b et w een the calls is disregarded when calculating NT. The limitations of NT come from the incomplete information on mobilit y contained in CDRs. This measure relies on a sp ecific definition of a trip as a mo v emen t betw een t w o places where a person existed for any amount of time. The transp ortation literature often defines a trip as mo v ement b etw een t w o places where a p erson sta y ed for a minimum amount of time (often 5 or 10 minutes) – see, for example, [22]. Using CDRs, it is not p ossible to determine how long a p erson sta y ed at eac h place they made a phone call. This CDR-deriv ed measure could record few er trips if a minimum time at a destination were required or if a p erson do es not mak e a call when at a particular destination b efore lea ving for their next destination. More trips w ould b e recorded in cases where a p erson makes sev eral phone calls when tra veling betw een an origin and destination (or makes longer calls using m ultiple to w ers), and no minim um time at a destination w ere required. Ho wev er, this limitation is precisely what mak es NT comparable across time and place. Definitions of a trip that use any more information than we do here, will necessarily b e time and con text sp ecific; an intricate definition of what constitutes a meaningful trip in rural Mongolia will certainly b e differen t from what constitutes a trip in New Y ork City . Th us, the limited information that NT uses is b oth a detraction and a b enefit. 4.2. Group B: Measures of spatial range of mobilit y. The next tw o measures represen t the n umber of places that a p erson visited. Just as with trips, a careful definition of what constitutes a place is required for consistency and comparability across geographic contexts and time. Both group B measures require an assumption that all places in which a p erson exists for an y amount of time could b e imp ortant. Some of these places are mark ed by a person making a call. Ho w ev er, there are other places that a p erson tra v els through on a road route in whic h they did not make a call. The logic b ehind this assumption is fundamentally that of a missing data problem: w e do not know ho w long a p erson sta yed in eac h place, how important was eac h place to a particular person, or if places where they made calls w ere more or less imp ortan t than other places they trav eled through. Consequently , these measures assume all places along a p erson’s road route are of equal imp ortance and counts them all. T o calculate the group B measures, w e take every pair of sites that are consecutive in a spatiotemp oral tra jectory M and iden tify the grid cells that belong to the quic k est road route b et w een the tw o sites. W e form the set of all the grid cells V ( M ) on these quick est road routes whic h also include their start and end cells, the sites from whic h calls w ere made. A grid cell app ears only once in V ( M ). The elemen ts of V ( M ) are called visited grid cells. The visited grid cells that hav e cellular tow ers in them are called visited sites. Grid cells visited (GCV-R) . This measure is given by the num b er of visited grid cells. The GCV-R measure for P is equal to 93 (98th p ercentile) because there are 93 visited grid cells b et w een sites 1976 and 360. This measure relies on the assumptions that a person must ha v e existed on the ground in places b etw een subsequen t calls and that, without further information, all places a p erson might hav e visited are equally important. Sites visited (SV-R) . This measure is the ratio b et ween the n um b er of visited sites and the total num b er of sites in the reference time p erio d of the tra jectory M . As discussed in SI App endix, Section SI2 , the num ber of sites could c hange from a reference time p erio d to another as cellular to wers are installed or decommissioned. Th us adjusting for the time v arying n um b er of sites is required to define a measure whose v alues are consistent across reference time p eriods. F or example, 19 out of the 93 visited grid cells betw een sites 1976 and 360 were sites in Octob er 2005. Since the total num b er of sites in Octob er 2005 is 53, the measure SV-R is 19 / 53 = 0 . 358 (98th percentile) for P . The definition of the SV-R measure is based on the assumption that there is something important ab out where a cellular tow er is placed, either high p opulation density , high through-traffic, near an imp ortant area, at a cross-roads, etc. The reason that cellular to w ers are lo cated in certain areas migh t differ b et ween contexts and across time, but what do es not differ is that there is likely a reason for cellular tow er placement. 8 W e use this particular assumption b ecause it assumes the least possible in order to define a place and is therefore the most comparable across contexts and time. These tw o measures take in to accoun t the spatial range of a p erson’s mobilit y: the further eac h trip, the larger the num ber of sites and grid cells visited. But the frequency of mov emen t is not captured by these measures. If P would mak e a third call from site 1976, a fourth call from site 360, a fifth call from site 1976, and so on, the v alues of GCV-R and SV-R will remain the same. 4.3. Group C: Measures of spatial range and frequency of mobility . The final three measures of mobility calculate the sum of distances b etw een sites where consecutive commu- nication episo des occurred. They differ only in terms of the t yp e of units of distance used. These distances are related to the quick est of all p ossible road routes b et w een tw o sites that are consecutiv e in a spatiotemp oral tra jectory . Distance trav eled (DT-R) . The distance metric for this measure is the length of the quic k est road route. There are tw o key differences b et ween DT-R and the existing measure DT-SL: (i) DT-SL in v olv es mo v ement b et ween cellular tow ers, while DT-R inv olv es mo vemen t b et w een sites; and (ii) DT-SL is the sum of straight line distances, while DT-R is the sum of distances via road trav el. If tw o consecutiv e calls were made using t wo to w ers that b elong to the same site, DT-SL will record the straight line distance b et w een the t wo tow ers while DT-R will not record an y mo vemen t. On the other hand, DT-SL will underestimate distances b et w een t w o p oin ts since straigh t line distances are almost alwa ys (if not alwa ys) smaller than distances via roads. The DT-R measure of P is 432.1 km (38th p ercen tile) since this is the length of the quic k est road route b etw een the tw o sites from which P called. Time trav eled (TT-R) . The distance metric for this measure is the estimated trav el time on the quic k est road route. T ra vel time can b e estimated in several wa ys. Speed limits can b e used where av ailable. If sp eed limit information is not av ailable or the qualit y of roads is suc h that sp eed limits cannot b e met, then av erage trav el sp eeds must estimated for each t yp e of road – see SI App endix, Section SI1.1 . The TT-R of P is 6 hours and 4 min utes (33rd p ercen tile) since this is the smallest estimated tra v el time via roads b et w een the t wo sites from whic h calls were made. Grid cells trav eled (GCT-R) . The distance metric for this measure is the num b er of grid cells intersected b y the quick est road route. The start site of a route is coun ted, but the end site is not coun ted. Sites that are b oth the end of one route and the b eginning of another are not counted twice. The GCT-R of P is 92 (42nd percentile) since there are 93 grid cells on the quick est road route b et ween the tw o sites from which P called, including the start and end sites. These three measures all incorporate the frequency and the spatial range of a p erson’s mo- bilit y . The more times a p erson mo ves, the higher will b e their distance, time, and grid cells tra v eled. The further each trip, the higher will b e these measures as w ell. When jointly em- plo y ed, these three distance metrics are useful in iden tifying v arious patterns of mobility . F or example, the mobilit y of tw o individuals that tra v el the same distance but use different t yp es of roads (e.g., highw a ys vs. minor country roads) will b e rated the same by DT-R, but will differ with resp ect to TT-R. The distance metric for GCT-R is less dep endent on particular shap es of the roads or their quality which might help when comparing mobilit y for spatial tra jectories recorded in distant regions or countries. 5. Assessment of the Proposed Measures of Mobility The assessmen t of CDR mobilit y measures is limited b y the realit y that there currently exists no standard measure of mobility , or no gold standard to w hic h we can compare new measures. In this regard, the most imp ortan t assessment tool av ailable is face v alidit y . In other words, the b est assessment to ol is a careful discussion of whic h measures make sense and if they actually measure what we think they should b e measuring. Part of this face v alidity discussion is ab ov e 9 in the description of the measures, dimensions of mobility , and assumptions required for eac h measure. W e undertake additional assessmen t of our six new measures against the existing measures of mobilit y and against each other b y estimating longitudinal pairwise correlations based on the spatiotemp oral tra jectories of callers for eac h of 44 months of Rwandan CDRs. Results, figures and a discussion are presented in SI App endix, Section SI5 . All longitudinal asso ciations are positive with v alues from medium to high, and are v ery stable through time. Measures within groups hav e the strongest associations, as w e would expect. But other, less intuitiv e high asso ciations emerge, especially betw een certain existing and new measures. In particular, the DT-SL measure, whic h is conceptually consisten t with b oth key dimensions of mobility , has the strongest asso ciations with the measures in group B (spatial range), and only the second strongest asso ciations with the measures in group C (spatial range and frequency). While this is somewhat surprising, it also emphasizes the fundamen tal differences in the w ay DT-SL is defined as opp osed to our new measures, esp ecially DT-R. In addition to face v alidit y and correlations, it is important to assess which groups of measures and which measures within eac h group should be used for studies of population mobilit y . The six measures w e in tro duce offer multiple choices of combinations whic h could b e selected based on particular researc h questions and con texts. W e also argue that all our six measures are needed in principled, thorough p opulation mobility studies. Despite having common c haracteristics in terms of the t w o k ey dimensions of mobility we discussed, each measure captures a sligh tly differen t asp ect of mobility , and is thus relev ant alone as well as join tly with the other five measures. T o demonstrate this, we used our six measures to define categories of callers with differen t mobility profiles for four of the 44 months of data (June 2005 to January 2009) — see SI App endix, Section SI6 . A monthly spatiotemp oral tra jectory of a caller w as classified as having high or low mobilit y with resp ect to a measure if the v alue of their mobility measure w as ab ov e or b elow the median of observed v alues during that month. F or each month, with six separate measures this leads to 64 categories. T ables S1–S4 ( SI App endix ) sho w that at least 11 of the 64 categories con tain at least 1 . 0% of the callers in eac h of the four months we examined. This suggests that there are man y distinct mobilit y types in this p opulation that can only b e identified b y using all six measures in combination. Ov erlo oking any one measure w ould lead to conflating segments of the p opulation with distinct mobility profiles. F urther, w e find several notable patterns with these tables. Tw o profiles which rate mobilit y as low or high for all six measures are the largest ones in all four mon ths, and comprise ab out 30% of the monthly callers. The third and fourth largest segments rate mobility as low or high for groups A and C, and as the opp osite for group B. These segments comprise ab out 7% of the mon thly callers, and sho w the relev ance of capturing frequency of mobility (groups A and C) versus spatial range (group B). Another notable result is the relativ ely common mobility profiles that rank high on one spatial range measure, low on the other spatial range measure, and high or lo w on all other measures. These tw o groups comprise ab out 5% of the p opulation and indicate p eople who likely trav el often and far, but mostly in areas with few cellular tow ers (th us a high GCV-R but lo w SV-R). In contrast, there are p eople who tra v el seldom and short distances, but in areas with many cellular tow ers (thus a low GCV-R but high SV-R). Again, assessing all six mobilit y measures for eac h individual is necessary to identify particular mobilit y t yp es in a p opulation. The mobilit y measure time trav eled (TT-R) has an additional imp ortan t use. As w e show in SI Appendix, Section SI7 , the v alues of this measure can be used to iden tify and p ossibly filter out spatiotemp oral tra jectories affected b y errors in cellular services provider’s databases, or by intruders who gain unauthorized access to mobile phones and use them to comm unicate at the same time as the actual owners. The iden tification of such unusual tra jectories is not p ossible with the existing measures of mobilit y . 10 6. Discussion Our mobility measures are designed to b e applicable to an y research setting, from wealth y coun tries with well-dev eloped mobile phone and transportation infrastructure, to p o orer coun- tries that are yet developing transp ortation and communication netw orks. They constitute an imp ortan t adv ance in the so cial scientific study of mobility whic h could lead to impro v ed understanding of human health and well-being and macro-economic, social, p olitical, and de- mographic dynamics. Being almost en tirely spatially derived, and using CDRs enhanced with GIS data, these new measures circumv en t man y of the problems inheren t in existing mobility measures and are independent of cellular tow er densit y and the social, p olitical, economic, or de- mographic characteristics that influence tow er density . They are thus relev an t and comparable in differen t contexts. Another k ey goal with this paper is to stimulate discussions on mobilit y measures using CDRs, and to promote so cial science researc h on the causes and consequences of h uman mobility . In this regard, we herewith discuss some of the many wa ys in whic h these new CDR-based measures of mobility can b e used to enhance and expand our understanding of h uman well-being and so cial organization. First, these new measures can replace older measures, often based on sample surveys, to impro v e understanding of existing mobility related questions. The b enefit here is clear, given that CDR-based measures can significantly increase the accuracy , detail, and time perio d o v er whic h mobility can b e recorded. They are also m uc h less costly to obtain than detailed survey measuremen ts. CDRs can be collected and measures of mobility calculated for respondents who participate in sample surv eys, giving the researc her not only immense detail ab out resp ondent mobilit y , but the opp ortunity to compare it with survey records of other c haracteristics and b eha viors. Second, these new measures op en up entirely new av en ues of research. Because CDRs can co v er millions of p eople, it is possible to calculate p opulation-lev el mobilit y measures. F or ex- ample, one can calculate a measure of general mobilit y for a cit y , state, province, or region. This could then b e compared to individual lev el behaviors and outcomes to in v estigate questions suc h as how p opulation mobilit y influences individual migration, tuberculosis infection, or w omen‘s lab or force participation. P opulation lev el mobility can also b e related to p opulation-lev el c haracteristics, suc h as HIV prev alence rates, birth rates, so cial norms, economic w ell-being, or p olitical participation. With sample surveys, it has never b efore b een p ossible to calculate p opulation lev el characteristics, thus CDR-based measures, if appropriately calculated to b e in- dep enden t of tow er density and the related con textual c haracteristics, create new and p ossibly groundbreaking opp ortunities for social science. Third, CDR-deriv ed p opulation level measures mobility can be used to identify and study emergency ev en ts, such as natural disasters and armed conflict. F or example, theory and evi- dence predict that p eople will change their mobility patterns during and after an earthquake or a large b omb blast [30, 31]. With access to real time data, it would then b e p ossible to pinp oint an earthquake or b omb blast in real time, even in remote areas with p oor comm unication and transp ortation link ages. Giv en that the time to humanitarian resp onse significan tly influences the magnitude and time of the p ost-ev en t disaster p eriod, real-time identification of hazardous ev en ts could ultimately lead to decreasing the human toll of disasters. While CDR-based measures can create immense new opp ortunities for understanding human mobilit y , there are sev eral limitations of which researc hers m ust b e aw are. As with all organic big data [32], selection is a ma jor concern. F or mobile phone data, mobile phone users are included in the data set and non-users are excluded. Research suggests that users are more lik ely to b e male, educated, and liv e in urban areas [18, 20]. Alternately , research has also sho wn that there are an estimated 90.2 mobile phones p er 100 people in p oorer coun tries [17]. Considering that mobile phone p enetration statistics are largely analogous to response rates in surv eys, we can sa y that CDR based data essen tially ha v e a 90.2% resp onse rate in po orer coun tries, which is generally considered go o d if not excellent, regardless of selection. 11 Another key limitation to the use of CDR-based mobility measures is the inherent error. The primary problem is that although mobile calls are recorded as o ccurring at a cellular tow er, the p erson making the call is rarely at that to w er. Instead they are lik ely to be within 5 or 10 km from the tow er, dep ending on the t yp e of antenna used in the to wer and top ograph y . How ever, w e argue that the b enefits of CDR-based mobilit y measures v astly out w eigh the detractions, esp ecially when compared to the alternative of surv ey-based measures with inherent error due to human difficulties in recalling location, time, and mov emen t accurately and the inabilit y to measure p opulation level mobilit y . A cknowledgments The authors thank Daniel Bjorkegren and Joshua Blumensto ck for their help with the initial stages of pro cessing of the call data records. This work w as partially supported by National Science F oundation Grant DMS-1120255 (to A.D.). N.W.’s con tribution has b enefited from generous supp ort of a NIH Path w a ys to Indep endence grant (R00HD067587). Supplement ar y Informa tion (SI) Appendix SI1: The Road Net w ork and the Grid Cell System. Two of our metho dological dev el- opmen ts that are based on Geographic Information Systems (GIS) are the road netw ork system from Rwanda and the grid cell system which divides a spatial b ounding b ox for Rwanda’s b oundary into 2040 5 km x 5 km cells. With any GIS, the choice of an appropriate coordinate system, determined by the geographic lo cation and scale of analysis, is required to assure ac- curate measures of distance and area. Our road net w ork and grid cell system are based in the Univ ersal T ransverse Mercator (UTM) zone 36S co ordinate system, using the W GS84 datum 1 . Figures S1 and S2 display the locations of the 269 cellular to w ers that app ear in the Rwandan CDR data with resp ect to the road netw ork and the grid cell system, resp ectiv ely . The grid cells that contain at least one tow er are called sites. Only 155 out of the 2040 grid cells are sites. F our sites in the Kigali area contain the largest num ber of cellular tow ers: 41, 22, 6 and 5, resp ectively . Sev en sites contain four tow ers, four sites contain three to w ers, 14 sites contain t w o tow ers and the other sites contain only one to w er. These counts represen t the to w ers that b elong to a site b et w een June 1, 2005 and January 31, 2009. In any p erio d of time b et w een these dates, all, some or none of the tow ers that b elong to a site are actually active (i.e. handle cellular communications). As such, the n um b er of sites (i.e., grid cells that con tain at least one activ e tow er) in a time perio d might b e smaller than 155 – see Section SI2. SI1.2: The Grid Cel l System. Our approach, whic h inv olves o v erla ying a customized rectangular grid with square cells of equal size on the map of Rw anda, creates a systematic metho d of circum v enting the ma jor problem of spatial v ariance in cellular tow er density . W e replace tow er lo cations with the centroid of the sites they b elong to. Instead of measuring straight line distances from to w er to tow er, we measure distances b et w een the cen troids of the sites via the quic k est road route which connects these centroids. Cho osing the size of the grid cells is an important decision. W e are in terested in country lev el mobilit y patterns and b elieve that 5 km x 5 km grid cells are appropriate for this purpose 2 . Based on geographical and technological considerations, w e estimated catchmen t areas in which a user of a cellular tow er is lik ely to be lo cated. W e estimated that the maxim um signal distance for the t yp e of to w ers in Rwanda is roughly 10 km. Sev eral factors further reduce this maxim um signal distance, including relative lo cation of a user with resp ect to a tow er, top ography of the areas surrounding tow ers, and the deca y in signal strength with increasing distances from tow ers. As such, we reduced the maximum user-to-to wer distance to 5 km. The resulting 5 km x 5 km 1 Suc h types of linear and areal measurements cannot b e p erformed in a GIS using an unpro jected or spherical co ordinate system, such as degrees latitude and longitude, which measure angles rather than surface distance. 2 F or other applications that inv olv e an in-depth lo ok at mobility within predominantly urban settings such as Rw anda’s capital Kigali, the same methodology can be used with the grid cell size modified to a more appropriate scale to capture local scale mobility (e.g., 1 km x 1 km grid cells). 12 Figure S1. Map of Rwanda sho wing the p osition of the 269 cellular tow ers ( red ) and the structure of the net w ork of roads (trunk, primary , secondary and tertiary) used for our mobility measures ( gra y ). Roads that are also segments on quick est routes are shown in blue . grid cell system is a 51 x 40 matrix (2040 grid cells) that cov ers 51,000 km 2 extending just outside of the b order of Rw anda – see Figure S2. Eac h grid cell is indexed b y a num ber from 1 to 2040: grid cell 1 is lo cated in the low er left corner and grid cell 2040 is located in the upp er right corner. The indices increase first by row, then b y column. Each of the 269 to w ers is subsequently mapp ed to its corresp onding grid cell (site). A possible cav e at of using a grid cell system as a foundation for measuring mobilit y is that the spatial placemen t of the grid creates arbitrary b oundaries that could non-systematically influence mobilit y measures. F or example, p erson A could call from a cellular tow er that is one meter a w a y from a grid cell b oundary . If A mo v es t w o meters to cross the grid cell b oundary and mak es a call from a tow er in the new grid cell, A will b e registered as mo ving b et w een grid cells, even with only t w o meters of actual trav el. On the other hand, another p erson B could call from a to w er inside a grid cell, mo ve up to 5 √ 2 ≈ 7 . 07 km without crossing a grid cell b oundary , and mak e another call. Because B remained in the same grid cell, B w ould not b e registered as having mov ed, despite trav eling a lot further than A . There is a reasonably simple, though computationally intensiv e, metho d to accoun t for the bias induced b y the arbitrary spatial placemen t of the grid cells. Consider a system of 5 km x 5 km grid cells whic h is placed ov er a map of the study area, and calculate the corresp onding v alues of the measures of mobilit y which are dependent on the lo cations of the cells. Next, mo v e the entire grid system 1 km east ov er the map, and recalculate the v alues of the mobility measures. The grid system can b e mo v ed 25 times (by 1 km east and 1 km south each time), and the resulting 25 sets of v alues of the measures of mobility can b e determined. These 25 sets of v alues can be used to produce mobility measures estimates as w ell as standard errors which accoun t for the arbitrary placement of grid cell b oundaries. 13 Figure S2. Map of Rw anda showing the p osition of the cellular tow ers ( red ) with resp ect to the 2040 5 km x 5 km grid cells. Rwanda’s boundary is sho wn in blue . The ra w OSM’s data for Rw anda was suc h that 11 sites w ere not in tersected b y the Rw andan road net work. T o connect these sites to the road net w ork, w e mov ed the lo cation of their cen troids to adjacent grid cell centroids. The adjacent grid cell used was the one closest to the to w er in the original cell. In a few cases this led to an ov erlap b et w een tw o sites, one of whic h happ ened in the Kigali area whic h has a high tow er density . W e b elieve this is not a ma jor problem b ecause, as mentioned ab o v e, the cov erage of a cellular tow er is roughly a circular area with a 5 km radius. The distance b etw een tw o centroids is exactly 5 kilometers and each of the roads that were barely missed w as within 3 km of the centroid of the nearest grid cell. In all cases, we sp ot c hec ked the change to make sure it w as the most reasonable. When we replace to w ers with grid cells, there is the p ossibilit y of increasing the error in a p erson’s lo cation. Notably , there is the symmetric p ossibilit y that the grid system could decrease lo cational error. In most cases, it is lik ely that the combined error (uncertain t y of a p erson’s lo cation in relation to a to w er combined with additional grid system lo cational error) is negligible. In the most extreme circumstance, with a 5 km x 5 km grid system, to wers that broadcast to a 10 km radius, and a tow er that is in a far corner of a grid cell, a p erson’s lo cation could b e calculated as being up to 13.5 km from their actual lo cation. Note that the ma jorit y of the error here (10 out of 13.5 km) is due to tow er-lo cation uncertaint y and the minorit y of error (3.5 km) is due to the imposition of the grid system. This maxim um p ossible error of 13.5 km is lik ely not as problematic when measuring mobilit y on a national scale compared to a smaller lo cal scale. When measuring mobility on a smaller scale in areas with higher tow er densit y , or to w ers that are closer to each other than 10 km, the maximum p ossible lo cational error will b e less. It can be further reduced by decreasing the size of grid cells. Thus, lo cational error must b e carefully considered when CDR-based data is used to measure mobility and further w ork should b e done to assess the effects of selection and locational error. 14 SI2: The T emp oral Dynamics of the Cellular Net w ork. The net work of cellular tow ers managed by a wireless service provider could v ary significantly o ver months and years in terms of the total num ber of to w ers, their spatial cov erage, and the num ber of users of the netw ork. A cellular tow er is called activ e in a given time p eriod (e.g., a month or a year) if it handled at least one call during that p erio d. W e used the a v ailable Rwandan CDRs to determine the n um b er of callers in this provider’s net w ork, and which cellular tow ers handled their calls every mon th from June 2005 to Jan uary 2009. Figure S3 shows that the num ber of users using this cellular netw ork increased from 190 thousands in June 2005 to 238 thousands in December 2005, 310 thousands in Decem b er 2006, 552 thousands in Decem b er 2007, and reac hed more than 1 million p eople b y Decem ber 2008. Figure S4 reveals that the n um b er of activ e to wers that handled comm unications in this netw ork con tin ually increased from 73 in June 2005 to 79 in December 2005, 91 in Decem ber 2006, 136 in Decem b er 2007 and reached 246 in December 2008. During this time the netw ork expanded with progressively increasing tow er densit y in more p opulated areas through the installation of additional to w ers in sites that already had tow ers in them, but also with progressiv ely increasing spatial cov erage through the installation of new to w ers in grid cells that previously did not con tain an y to w ers. The difference betw een these t wo dimensions of the dynamics of the cellular net w ork is eviden t when comparing the mon th to mon th increase in the num b er of sites with the increase in the num b er of to wers: increased tow er density at the same sites is not captured in the n um b er of sites during eac h mon th, but it is captured in the increase in the num ber of activ e to w ers. Although not obvious in this figure, there is alwa ys the p ossibilit y that a cellular net w ork loses tow ers which leads to lo w er to wer densit y at some sites or to sites no longer con taining active tow ers. Increased spatial cov erage is eviden t from the b ottom panel of Figure S4: there were 49 sites in June 2005, 54 sites in December 2005, 60 sites in December 2006, 76 sites in December 2007 and 143 sites in December 2008. The expansion of the spatial co v erage of this cellular netw ork is sho wn in Figure S5, whic h sho ws where the installation of new tow ers led to cov erage in grid cells that previously did not ha v e cellular s ervice from this provider. The large expansion in spatial cov erage recorded in Decem b er 2008 compared to Decem b er 2007 is esp ecially imp ortan t as it v astly improv ed the accessibilit y of mobile technology in towns and rural areas throughout Rwanda. Figure S3. Number of callers during each month b etw een June 2005 and Jan uary 2009. SI3: Measures of Mobilit y. Here w e giv e formal mathematical definitions of the measures of mobilit y described in the main text. Consider the sequence of CDRs associated with a mobile 15 Figure S4. Number of active cellular to w ers ( blue ) and sites ( green ) during eac h month b et w een June 2005 and Jan uary 2009. Figure S5. Lo cation of sites during four months: Decem b er 2005, 2006, 2007 and 2008. In eac h of the four panels, red denotes grid cells that w ere not sites the y ear b efore. All the other sites are shown in blue . This plot reveals that a large n um b er of cellular tow ers were installed b etw een December 2007 and December 2008 whic h significantly increased the spatial co v erage of the wireless services pro vider that provided the Rwandan CDRs. 16 phone in a reference p erio d of time T (e.g., a day , a w eek, a month or a y ear): M = { m 1 , m 2 , . . . , m n } . (1) W e assume that the wireless-service provider that generated these CDRs has K activ e to w ers in the reference time p eriod T , and that the spatial locations l C T i , i ∈ K = { 1 , 2 , . . . , K } of these active tow ers are kno wn. In (1), m i ∈ K , 1 ≤ i ≤ n , is the identifier of the cellular tow er that handled the communication represen ted by the i -th CDR in the sequence (1). If i < j the comm unication represen ted by m i w as recorded b efore the communication represented by m j . W e refer to M as the spatiotemporal tra jectory of the cellular phone that generated the sequence of CDRs. W e remark that more than one tow er migh t hav e handled the same communication (e.g., a call), but in that case several CDRs – one for each cellular tow er – would hav e b een generated. F or an y pair of spatial lo cations l and l 0 iden tified b y their latitude and longitude co ordinates, w e define the distance function d S L ( l, l 0 ) which represen ts the straight line or “as the crow flies” distance b et w een l and l 0 . W e take d S L ( l, l ) = 0. SI3.1: Existing Me asur es of Mobility. F or the spatiotemp oral tra jectory M from (1), the mea- sure of mobilit y called “n um b er of tow ers used” (NTU) is the n um b er of unique to w ers that app ears in this sequence, i.e. # { i : i ∈ K suc h that there exists m j , 1 ≤ j ≤ n with m j = i } . Here # A denotes the n um ber of elements in the set A . The measure of mobility called “distance tra v eled” (DT-SL) is the sum of straigh t line or “as the cro w flies” distances betw een consecutive to w ers from which communication o ccurred: n X j =2 d S L l C T m j − 1 , l C T m j . The measure of mobility called “maxim um distance trav eled” (MDT) is the maxim um straight line distance b et w een tw o tow ers in the sequence M : max 1 ≤ i
Original Paper
Loading high-quality paper...
Comments & Academic Discussion
Loading comments...
Leave a Comment