Package equivalence in complex software network
The public package registry npm is one of the biggest software registry. With its 216 911 software packages, it forms a big network of software dependencies. In this paper we evaluate various methods for finding similar packages in the npm network, u…
Authors: Tomislav Slijepv{c}evic
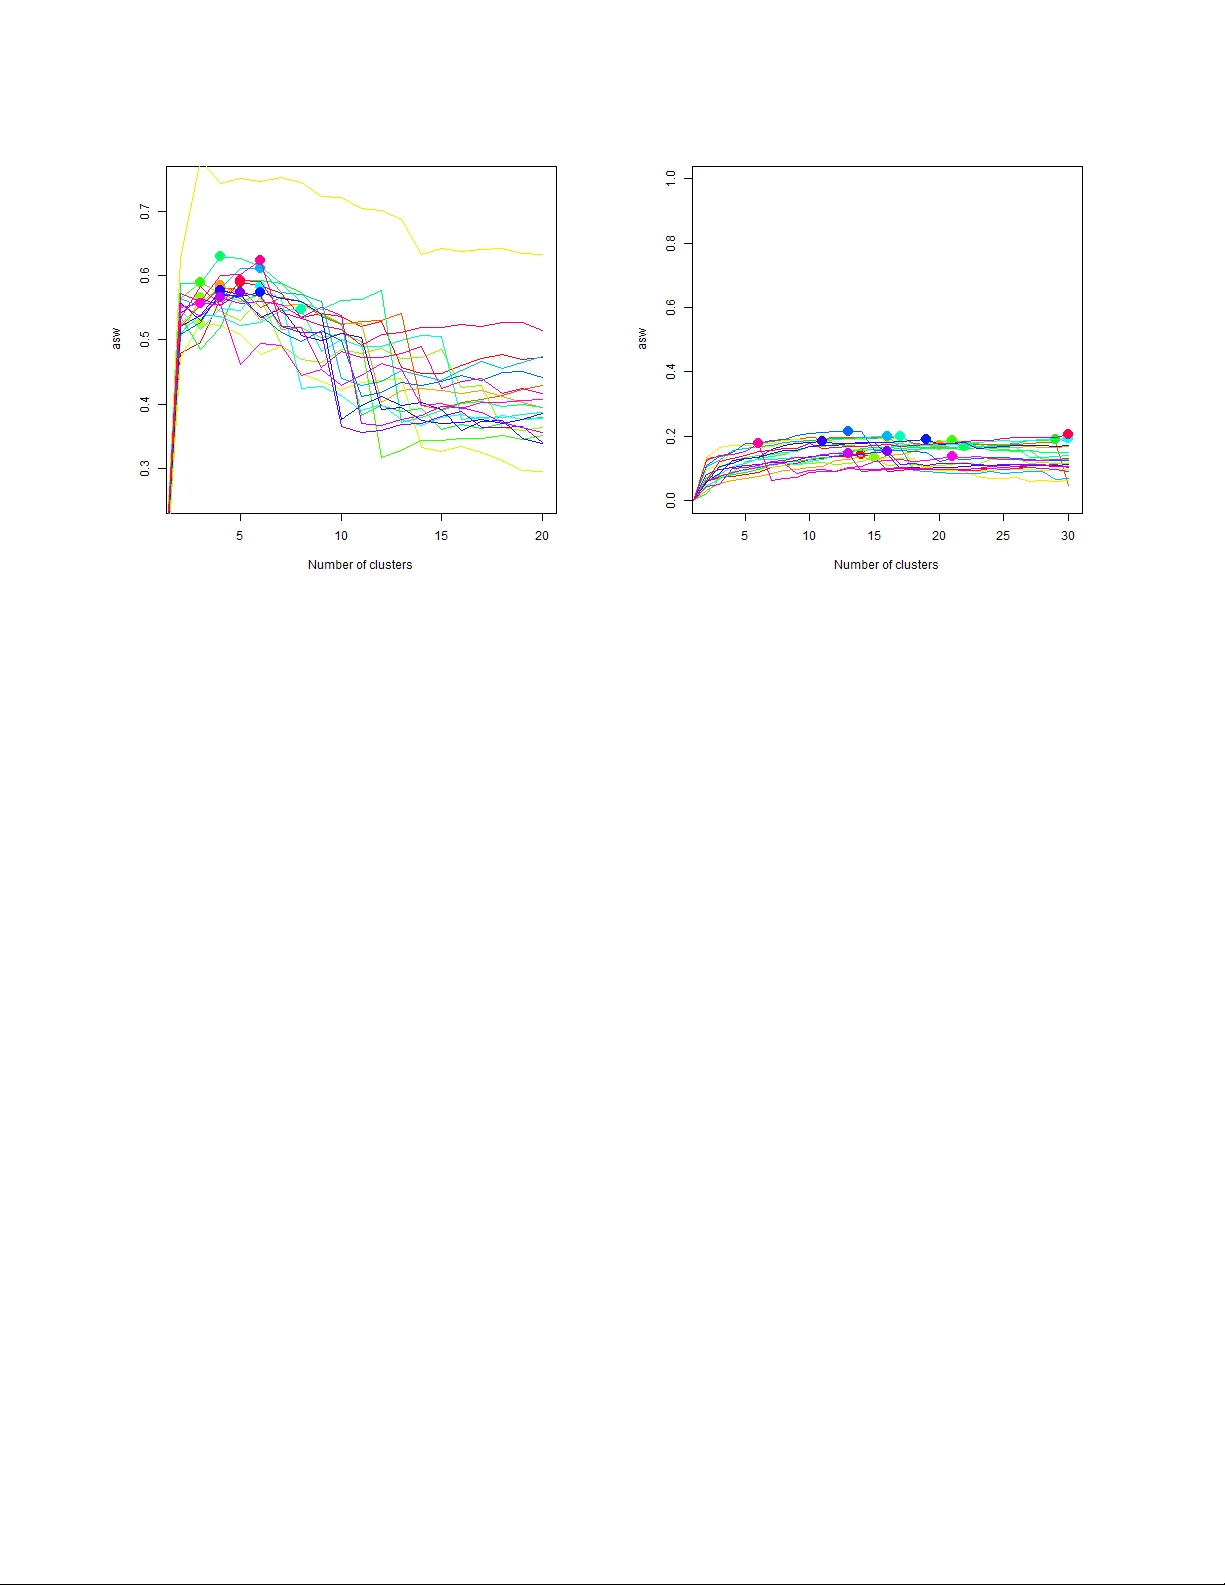
P ac kage equiv alence in comple x software netw ork T omislav Slijep ˇ ce vi ´ c University of Ljub ljana F aculty of Computer and Inf ormation Science V e ˇ cna pot 113, SI-1000 Ljubljana, Slo venia ts2287@student.uni-lj.si ABSTRA CT The public pac k age registry npm is one of the biggest soft- w are registry . With its 216 911 soft ware pac k ages, it forms a big net work of soft ware dependencies. In this paper we ev al- uate v arious methods for finding similar pac k ages in the npm net w ork, u sing o nly th e struct ure of the graph. Namely , w e w an t to find a w a y of categorizing similar pack ages, which w ould be useful for recommendation systems. This size en- ables us to compute meaningful results, as it softened the particularities of the graph. Npm is also quite famous as it is the default pac k age rep ository of No de.js . W e b elieve that it will mak e our results in teresting for more p eople than a less used pack age repository . This makes it a go o d sub ject of analysis of soft w are netw orks. Categories and Subject Descriptors D.2.8 [ Softw are Engineering ]: Metrics— c omplexity me a- sur es, p erformanc e me asur es, softwar e scienc e General T erms Theory , algorithms, exp erimentation. K eywords Soft w are systems, Soft ware engineering, Softw are net w orks, Net w ork analysis. 1. INTR ODUCTION The ma jor in terest of the net work science is the analysis of the structural and statistical prop erties of complex net- w orks. By lo oking at the patterns of connectivit y in a net- w ork, a ” role” can b e assigned to e ac h no de [1, 2] . Researches ha v e discov ered tha t there is a close relation b et w een the structure of a netw ork and the roles, while they an alyzed v arious net w orks that regards the life science, ecology , in- formation, so cial sciences and economics [3, 4, 5, 6]. That is why it is important to understand the structure, i.e., the topology , of a netw ork to find the roles and to understand the dynamics of a netw ork in that matter [7]. The no de gets a role based on how it in teracts wit h oth- ers. F or the role assignment there hav e b een developed tw o basic concepts: structural [8] and regular equiv alence [9]. When tw o no des are either structurally or regularly equiv- alen t, then they hav e the same role in a net w ork. F or t wo nodes to b e structurally equiv alent, they hav e to share the same neighbors. The regular equiv alence is a lo oser crite- rion than the structural equiv alence; it do es not compare the neighborho o ds of the tw o no des, but whether the tw o nodes are connected in the same wa y to the others. It holds that if t wo nodes are structurally equiv alent, then they are also regularly equiv alen t, but not vice versa. The grouping of nodes that are related b y either of equiv alence relations forms equiv alence classes, which represen t the roles of nodes in a netw ork. In this paper w e examine the complex softw are netw ork to see if no des can b e naturally grouped in to equiv alence classes just as in other netw orks. The analyzed netw ork consists of nodes that represen t soft ware pac k ages and edges that indicate dep endencies among pac k ages. The data w as tak en from the biggest public soft ware registry npm [10] ( https://npmjs.com ). W e b eliev e that applying the rela- tion o f structu ral equiv alency on the soft ware netw ork wo uld group the soft w are pack ages into equiv alence classes that represen t different types of s oft w are, e.g. a class of pack- ages that is related to web, grap hics or other. Reasoning behind this is that pack ages that are related by type share man y neigh b ors and would therefore be assigned to the same equiv alence class. By applying the other equiv alence rela- tion, which is the regular equiv alence, w e assume that the pac k ages will be grouped into the following t hree equiv a- lence classes: a class of core libraries, a class of the p opular framew orks, and a class of pac k ages that are supplemen tary to the p opular frameworks, i.e. pack ages that serve as an add-on to one of the p opular framework. P ac k ages within listed classes connects to others in the same wa y and that is wh y we predict the formation of these classes. F or a class of the core libraries it is understandable that they do not ha v e dependencies, as there is not any pack age to dep end upon at start, but they do hav e a lot of dep enden ts. F or the pac k ages within the second class, the popular frame- w orks, it reasonable that they hav e a lot of dependencies and a lot of dep endents. The pac k ages in the last class, whic h supplement the p opular frameworks, should ha v e a few dep endencies and probably none dep enden ts. Th us it should be possible to find similar pack ages using only the structure of the netw ork. This could lead to amelioration of pack age recommendations based on equiv alence relations and also to automat ic lab eling/categorizing of a new pac k age based just on the listed dep endencies. This system could help to homogenize k eyw ords in soft ware registry and th us impro v e the referencing of the pac k ages and simplify the searc h for pack ages. The rest of the article is structured as follows. In Section 2 w e presen t related work and in Section 3 we give a formal in troduction to node equiv alence. Empirical ev aluation with discussion is done in Section 4 and conclusions in Section 5. 2. RELA TED WORK The modern science of netw ork is particularly in terested in decomposing nodes of large netw orks into indep enden t groups called ” communities” [11]. As a comm unity , you think of a group of no des that is in ternally densely con- nected but sparsely connected externally [7, 2, 11, 3]. The nodes within communit y are similar to each other and dis- similar to the rest of the no des in a netw ork. Researchers sho w ed there is actually communit y structures in real-w orld net w orks [12, 11, 13]. How ever, the definition of comm unity is not univ ersally accepted and for that matter w e ha ve m ul- tiple definitions. Communit y structure emphasizes cohesive groups of nodes and the absence of dep endencies b et ween the groups, but this do es not say an ything ab out the roles in a net work. The concept of roles in net works is m uch wider that the concept of communit y . Prerequisite for the anal- ysis of roles in a netw ork is a commun it y structure. After that, you examine how disco vered communities are inter- dependent, which translates to different roles in a net work. One of predominant technique for deriving structure of a net w ork is blo c kmo deling [8]. It is considered as mapping nodes and edges onto their images in a reduced graph. A node (” blo c k” ) in reduced graph represen ts the no des from original graph that were mapp ed to the same image. This t ype of mapping is called semigroup homomorphism [9]. Ho- momorphisms are mappings that preserve the structure of a graph in a wa y that no des of a graph are mapped in to nodes in an image of the graph, and each edge in an image of the graph is connected to the same no des as in the original graph. The semigroup is an algebraic structure consisting of a set with an asso ciativ e binary op eration. W e can lo ok at the nodes from original graph as a semigroup. Conse- quen tly , the nodes in reduced graph represent the result of applying the semigroup operation to the ordered pair ( x, y ), whic h in our case are the edges in the original graph. If w e tak e equiv alence relation as the op eration within semigroup, then we get equiv alence classes as the no des in the reduced graph. The plot of adjacency matrix of the new graph re- v eals blocks in diagonal, which are equiv alence classes, and dependencies betw een them. There exists a framework for blo c kmo deling classes within complex net w orks [7]. Authors derive a measure to find the best fitting image graph (reduced graph) and present a cri- terion to a void ov erfitting. Image graph is termed as the role model. They did not demand exact mapping of every single no de to the role mo del, but that the net work as a whole fit as w ell as possible to the role mo del. The perfect fit would corresp ond to regular and structural equiv alence. When tac kling a new net work, they assumed a giv en im- age graph and assignment of roles to no des. They derived a qualit y function as an ob jectiv e measure of fit betw een the image and the net work under this assignment of roles. The assignmen t of roles which maximizes their qualit y func- tion is considered as the best one to describ e the connection structure of the original netw ork. The concepts of mo dular- it y [14] and structural equiv alence are found as sp ecial cases of this approac h. The mo dularity measure is commonly used in communit y detection algorithms. It measures the qual- it y of a netw ork division in to communiti es. The prop osed method is applicable to both t wo-mode and one-mo de data, directed and undirected, as w ell as weigh ted netw orks. It is non-parametric and computationally efficient. In the same paper authors applied metho d to the world trade netw ork and analyzed the roles individual coun tries play in the global econom y . Another research dealt with analysis of patterns of role-to- role connections, but with their own definition of roles [15]. Principle was the same; to group the no des into roles, ac- cording to their pat tern of intra- and intergroup connec- tions. They analyzed four different types of real-world net- w orks; metabolic netw orks, protein interactions, global and regional air transp ortation netw orks, and the In ternet at the lev el of autonomous systems. T o determine and quan- tify the mo dular structure of these netw orks, they use simu- lated annealing. The optimal partitions of the netw ork in to groups was found with the use of the modularity measure. By comparing mo dular structure of eac h netw ork with the randomization of the same net wo rk, they found out that all observ ed net works ha v e a significan t mo dular structure. That is reasonable as groups in b iological net w orks corre- sponds to functional units and in air transportation groups corresponds to geo-political uni ts. The role of eac h node w as determined according to t wo properties: the relative within-group degree z , which measures the no de’s degree of connectedness with the no des within the same group, and the participation co efficient P , whic h measures node’s de- gree of connectedness with other groups. When classifying nodes in to roles, they initially measured within-group de- gree of all no des, and divided them into hubs and non-h ubs based on high and low within-mo dule degree, resp ectively . Then they looked at the participation co efficien t to further subdivide h ubs in to d ifferen t types of h ubs. F urther sub- division was also done to non-hubs. Reasoning b ehind this particular definition of the roles is giv en in [13]. 3. METHODS A graph is an ordered pair G = h P , R i , where P is a finite set of p oin ts and R is a relation on P , i.e., a subset of the ordered pairs of p oints in P × P . An equiv alence ≡ on P is a relation suc h that for all a, b, c ∈ P , it has a prop erty of reflexivity ( a ≡ a ), symmetry ( a ≡ b = ⇒ b ≡ a ) and transitivit y ( a ≡ b ∧ b ≡ c = ⇒ a ≡ c ) [9]. Grouping of p oin ts based on ≡ forms equiv alence classes. Similarity in netw ork analysis o ccurs when tw o no des fall in the same equiv alence class. There are tw o fundamental approaches for constructing measures of netw ork similarity: structural equiv alence [8] and regular equiv alence [16]. There exists a hierarc h y of these tw o equiv alence concepts. An y structural equiv alence is also regular equiv alence, but not all regular equiv alences are necessarily structural [17]. Structurally equiv alent no des of a netw ork must share the same neighbors. F ormally is defined as follows [9]: if G = ( P , R ) and ≡ is an equiv alence relation on P , then ≡ is structural equiv alence if and only if for all a, b, c ∈ P suc h that a 6 = c 6 = b , a ≡ b implies: (i) aRb ↔ bRa , (ii) aRc ↔ bRc ; and (iii) cRa ↔ cRb . The undirected graph in Figure 1 visually represen ts the concept, where no des colored in red a b c d e f Figure 1: Structurally equiv alen t nodes are marked red. a b c d e f Figure 2: Regularly equiv alent no des are those sharing the same color. a b c Figure 3: Problem of basic similar- it y measure for structural equiv alence whic h just counts the num b er of com- mon neighbors. are the ones that are structurally equiv alent. Nodes that are regularly equiv alent do not necessarily share neigh bors, but ha ve neighbors who are themselves similar. F ormally is defined as follows [9]: if G = ( P , R ) and ≡ is an equiv alence relation on P then ≡ is a regular equiv alence if and only if for all a, b, c ∈ P , a ≡ b implies: (i) aRc = ⇒ ∃ d ∈ P , bRd ∧ d ≡ c ; and (ii) cRa = ⇒ ∃ d ∈ P , dRb ∧ d ≡ c . This concept is visually depicted on the same un directed graph in Figure 2, where regularly equiv alent nodes are col- ored with the same color. Measuring structural equivalence of nodes T o find structurally equiv alent no des, one m ust compare eac h no de with the rest and chec k whic h pairs of nodes hav e matc hing neigh b orhoo ds. This tak es O ( n 2 ) steps, as one is doing a pairwise comparison of n nodes in the netw ork. Most of the comparisons are needless as not ev ery no de is connected to every one else. W e should only compare neigh- borho o ds of connected nodes, and that is achiev ed if w e tra v erse through the edges of a netw ork, whic h takes O ( m ) steps, where m is the num b er of edges in the netw ork. W e consider edges ( x, y ) one at a time and compare neighbor- hoo ds of no des x and y . W e do not fol lo w actual definition of structural equiv alence, whic h gives binary answ er (if neigh- borho o ds match or not), but instead we measure to what exten t they do matc h. The basic similarity measure just c hec ks the size of the inters ection of the tw o neighborho o ds, i.e., the n umber of the common neigh b ors of t w o nodes [8]. The problem with this measure is that it is adv antageously for no des with bigger neighborho o ds, which would therefore also ha v e more common neigh b ors with the others. The ex- ample in Figure 3 shows the problem. By applying measure to pairs ( b, a ) and ( c, a ), the measure would return tw o and one common neighbor, respectively , and would mean that node b is more structurally equiv alent to node a than no de c to no de a . This is not true, as no de b has additional neigh- bor, uncommon to no de a . Problem can b e solved b y using the Salton co sine [18] similarit y , whic h normalizes results with square ro ot of degrees of connected no des. If A is adja- cency matrix, where A ij indicates the num b er of neighbors betw een no de i and j , and Γ i is a set of neighbors of no de i , and k i is the degree of no de i , then cosine similarity σ ij is defined as: σ ij = cos θ ij = P k A ik A kj q P k A 2 ik q P k A 2 j k = | Γ i Γ j | p k i k j Before measuring structural equiv alence of no des in the net- w ork npm , we added additional edges. In a net w ork of pac k- age dep endencies suc h as npm , a pac k age dep ends not only on those pack ages that it p oin ts t o but also on those pack ages that its dep endencies p oint to. When you install a pac k- age from the npm , the installer first installs dependencies of chosen pac k age and then the pac k age itself. But b efore dependencies are installed, it has to install their dep enden- cies, and so on. So when you install a pack age, you get all its descendan ts. In that sense, a pac k age dep ends on all descendan ts, therefore we added additional directed edges betw een a pack age and all its descendants. After-that we proceeded with measuring structural equiv alence of no des. F or t wo no des to ev en b e considered structurally equiv alent they hav e to share at least one common neighbor. In our case tw o pack ages m ust depend t o at least one same p ac k age. This is ac hieved if w e pick eac h node and measure structural equiv alence betw een pairs of its predecessors. This wa y a pair of predecessors will hav e at least pick ed no de in com- mon. When measuring structural equiv alence of tw o no des w e first chec k if their neighbors o verlap. If they do, then we mark those no des as identical, otherwise we measure their cosine similarity . Afterwards w e remov e an y edges that con- nects examined pairs, b ecause they no longer need to be compared. W e keep picking nodes and measuring similarity of its predecessors un til we visited all nodes and all edges are remo v ed. F rom a ll measured pairs w e build a new undirected w eigh ted netw ork, where a pair of connected no des is one of a measured pair, and eac h edge has a weigh t that is equal to a cosine similarity of connected nodes. Subsequently we con tract no des that we found to be iden tical, i.e., hav e iden- tical neigh bors. F rom the new netw ork we extract similarit y matrix, which we then giv e to a clustering metho d to find clusters of structurally equiv alent no des. Measuring structural equivalence of nodes F or finding regularly equiv alent no des, we used the imple- men tation of CA TREGE [19] algorithm in R programming language [20]. It takes a graph and it assess ho w m uch are nodes regularly equiv alent. F or start, all nodes hav e the same role, therefore all are regularly equiv alen t. Then those no des within the same role but differen t combination of neighbor types are re-allo cated to different roles. Initially neigh bor t yp e is the pattern of in- and out-connections. This procedure is then iterated un til all no des within each role ha v e same com bination of neighbor t ypes. The distance b e- t w een no des in this case is the inv erse of the n umber of iterativ e refinemen ts of the initial role required to allo cate the no des to regularly equiv alent roles. The distance of 0 indicates no des which b elong to the same role. The algo- rithm gives results in a form of similarit y/dissimilarity ma- trix, whic h can then b e used with a clustering method. The algorithm has a cubic complexity , therefore it is applicable only on a smaller graphs that consist of no more than thou- sand no des. Clustering with a distance matrix W e used k-medoids clustering algorithm [21], which is simi- lar to k-means algorithm. Both algorithms are partitioning tec hnique of clustering that clusters th e data set of n ob jects in to k clusters known a priori. They can tak e matrix of dis- tances b et ween points and partition p oin ts into clusters by minimizing the distance b etw een a p oin t in a cluster and a point designated as the cen ter of that cluster (medoid). In con trast to the k-means algorithm, k-medoids w orks with an arbitrary distance b et ween p oints instead of just euclidean distance. The most common realiza tion of k-medoid cluster- ing is the Partiti oning Around Medoids (P AM). F or start, P AM randomly selects k points as medoid s. Then it as- sociates each point to closest medoid and starts swapping medoids with non-medoids until cost of configuration stops decreasing. W e used implementation of P AM in R program- ming language [22]. W e applied P AM clustering on the similarity matrix of struc- tural equiv alence and dissimilarit y matrix of regular equiv a- lence. Beforehand , we transformed the similarity matrix of structural equiv alence to diss imilarit y matrix by subtracting 1 with cosine similarities. In this wa y , we got a cosine dis- similarit y matrix. The matrices of b oth equiv alence con tain pairwise dissimilarit y of all nodes in the net work, therefore they take O ( n 2 ) space, where n is the n umber of nodes. Con- sequen tly , we cannot work with the whole npm net work due to its big size. Therefore, w e were obliged to sample the net- w ork and work with samples. W e used simple random w alk algorithm [23] for sampling. W e do not know how man y groups of structurally equiv alent no des are there, therefore w e need to run P AM algorithm m ultiple times and set differ- en t k each time. Because of this time constrain, we sampled 1000 nodes. F or finding groups of regularly equiv alen t nodes w e sampled only 500 nodes due to cubic time complexity of CA TREGE algorithm. F or determining k we used the silhouette method [24]. F or eac h no de i , let a ( i ) b e the av erage dissimilarit y of i with all other no des within the same cluster, and let b ( i ) b e the lo w est av erage dissimilarity of i to an y other cluster, of whi c h i is not a member. The smaller the v alue a ( i ), the b etter is a no de assigned to the cluster. The cluster with this low est a v erage dissimilarity b ( i ) is the next b est cluster for the p oin t i . Silhouette is defined as follows: s ( i ) = b ( i ) − a ( i ) max { a ( i ) , b ( i ) } = 1 − a ( i ) b ( i ) , if a ( i ) < b ( i ) 0 , if a ( i ) = b ( i ) b ( i ) a ( i ) − 1 , if a ( i ) > b ( i ) W e are in terested when a ( i ) is small, whic h means no de i is w ell matc hed to its cluster, and when b ( i ) is bigger, which means no de i is badly fit to neighboring cluster. Thus s ( i ) will b e close to one. If it equals to zero, then node fits to t w o clusters equally wel l, and if it is negative, then a no de is more fit to neighboring cluster. The av erage s ( i ) ov er all nodes of a c luster is a measure of ho w tigh tly grouped all the nodes in the cluster are. Thus it is appropriately measure of ho w the nodes has been clustered and can used to det ermine the num b er of clusters within a netw ork. 4. RESUL TS Regular equivalence classes F or regular equiv alence we sampled the npm netw ork 20 times by randomly visiting 500 no des. Within samples the mean num b er of edges is 1350 (std. dev. is 158). Each sam- ple was clustered with P AM and k ∈ [2 , 20]. The a v erage silhouette v alue for each sample and each k is shown in Fig- ure 4. The optimal nu m b er of clusters is ≈ 4, whic h cor- responds to the n umber of regular equiv alence classes. The a v erage silhouette v alue ov er all nodes is ≈ 0 . 6, therefore nodes fit quite well to assigned clusters and regular classes. The silhouette plots of the first 3 samples is shown in Fig- ure 6, where we can see that av erage silhouette v alue of nodes within the same cluster is more than 0.5, whic h is the another sign of the go od clustering. Another kind of plots, called cluster plots, of the first 3 samples is sho wn in Figure 7. These plots show clustered nodes in the first 2 principal components, which capture ≈ 80% of v ariance of dissimilarity matrix. W e c an see that no des can actu- ally b e clustered in 3 clusters, and thus 2 or more clusters can be regarded as the same regular equiv alence class. This is also nicely shown in level plots (block mo deling) in Fig- ure 8, where there are 3 prominent blo cks which represent 3 regular equiv alence classes. After examining the no des in clusters, we found out that a cluster hav e either no des that ha v e only in-connections, or out-connection, or b oth in- and out-connections. There is a single cluster of nodes with only in-connections and a single cluster of no des with only out- connections p er sample. The rest clusters ha ve no des with both connections. The reason the no des are not clustered in a single cluster is b ecause they can b e then further nicely divided by the scale of in- and/or out-connections. Our hy- pothesis states that there are following roles in the softw are net w orks: a group of core pack age with only in-connections, a group of p opular pack ages with b oth connections, and a group of pac k ages with only out-connections that supple- men t popular pack ages. A cluster of nodes with only in- connections represents a group of core pack ages, a cluster of nodes with both connections where there are more out- than in-connections represen ts a group of p opular pac k ages, and the rest clusters represen t supplemen tary pack ages. Structural equivalence classes F or structural equiv alence w e sampled the npm netw ork 20 times b y randomly visiting 1000 no des. Within samples the Figure 4 : Determining the num b er of regular equi v alence classes (clusters) in the npm netw ork with av erage silhouette v alue. mean num ber of edges is 8185 (std. dev. is 1711), the mean n um ber of structurally equiv alent no de is 761 (std. dev. is 40), the mean n umber of edges b etw een structurally equiv- alen t no des is 30772 (std. dev. is 13983), and the mean n um ber of identical no des is 270 (std. dev. is 40). Each sample was clustered with P AM and k ∈ [1 , 30]. The av er- age silhouette v alue for eac h sample and each k is shown in Figure 5. The optimal num b er of clusters cannot be determined b ecause it differs from sample to sample, and therefore we cannot asses how man y structural equiv alence classes are there in the npm netw ork. Although the av erage silhouette v alue of the best clustering per sample is small, w e can see nice grouping of no des into blo cks in the level plots in Figure 9. These groups wit hin the npm netw ork could theoretically corresp ond to differen t sub-ecosystems, i.e., different t yp es of softw are. 5. CONCLUSIONS Nodes of the npm netw ork w ere group ed by tw o equiv a- lence relation: structural and regular equiv alence. This w as achiev ed by first measuring to what extent are pairs of nodes structurally/regularly similar/dissimilar. F rom pair- wise similarities/dissimilarities we constructed dissimilarity matrix, whic h w as then given to P AM clustering algorithm - the implementation of k-medoids. Because we had to w ork with mat rix that takes quadratic space dep ending on a n um- ber of no de in a netw ork, we were obliged to work with a subgraphs. Due to this and other additional constrains, we could process at most thousand nodes per sample. Nonethe- less, w e successfully show ed that regular equiv alence relation when applied to the netw ork indeed groups no des int o roles that w e w ere seeking for. By appl ying structural equiv alence to the net wo rk we found many different groups that could theoretically corresp ond to different t ypes of softw are. Figure 5: Determining the num b er of structural equiv alence classes (clusters) in the npm netw ork with av erage silhouette v alue. 6. REFERENCES [1] S. P . Borgatti and M. G. Everett, “Notions of p osition in so cial netw ork analysis,” So ciolo gical metho dolo gy , v ol. 22, no. 1, pp. 1–35, 1992. [2] S. W asserman and K. F aust, So cial network analysis: Metho ds and applic ations , vo l. 8. Cambridge universit y press, 1994. [3] M. E. Newman, “The structure and function of complex netw orks,” SIAM r eview , vol. 45, no. 2, pp. 167–256, 2003. [4] A.-L. Barabasi and Z. N. Oltv ai, “Netw ork biology: understanding the cell’s functional organization,” Natur e r eviews genetics , vol. 5, no. 2, pp. 101–113, 2004. [5] H. Jeong, B. T ombor, R. Albert, Z. N. Oltv ai, and A.-L. Barab´ asi, “The large-scale organization of metabolic net w orks,” Natur e , vol. 407, no. 6804, pp. 651–654, 2000. [6] H. Jeong, S. P . Mason, A.-L. Barab´ asi, and Z. N. Oltv ai, “Lethalit y and centralit y in protein netw orks,” Natur e , vol. 411, no. 6833, pp. 41–42, 2001. [7] J. Reichardt and D. R. White, “Role mo dels for complex netw orks,” The Eur op e an Physic al Journal B , v ol. 60, no. 2, pp. 217–224, 2007. [8] F. Lorrain and H. C. White, “Structural equiv alence of individuals in so cial netw orks,” The Journal of Mathematic al So ciolo gy , v ol. 1, pp. 49–80, 1971. [9] “Graph and semigroup homomorphisms on netw orks of relations,” v ol. 5, no. 2. [10] http://www.modulecounts.com/ . [11] M. Girv an and M. E. Newman, “Communit y structure in so cial and biological net works,” Pr o c e e dings of the national ac ademy of scienc es , vol. 99, no. 12, pp. 7821–7826, 2002. Silhouette width s i 0.0 0.2 0.4 0.6 0.8 1.0 Silhouette plot of sample 1 Aver age silhouette width : 0.59 n = 500 5 clusters C j j : n j | ave i ∈ Cj s i 1 : 148 | 0.56 2 : 85 | 0.53 3 : 116 | 0.56 4 : 32 | 1.00 5 : 119 | 0.58 Silhouette width s i 0.0 0.2 0.4 0.6 0.8 1.0 Silhouette plot of sample 2 Aver age silhouette width : 0.58 n = 500 4 clusters C j j : n j | ave i ∈ Cj s i 1 : 83 | 0.59 2 : 129 | 0.53 3 : 184 | 0.64 4 : 104 | 0.53 Silhouette width s i 0.0 0.2 0.4 0.6 0.8 1.0 Silhouette plot of sample 3 Aver age silhouette width : 0.58 n = 500 4 clusters C j j : n j | ave i ∈ Cj s i 1 : 85 | 0.57 2 : 189 | 0.63 3 : 115 | 0.56 4 : 111 | 0.54 Figure 6: Silhouette plots of the first 3 samples for determining the num ber of regular equiv alence classes in npm netw ork. Figure 7: Clusters plots of the first 3 samples for determining the n umber of regular equiv alence classes in npm net wo rk. Figure 8: Level plots (block mo deling) of the first 3 samples for determining the num b er of regular equiv alence classes in npm net w ork. Figure 9: Lev el plots (blo c k modeling) of the first 3 samples for determining the num b er of structural equiv alence classes in npm netw ork. [12] G. W. Flak e, S. Lawrence, and C. L. Giles, “Efficient iden tification of web commu nities,” in Pr o c e e dings of the sixth AC M SIGKDD international c onfer enc e on Know le dge disc overy and data mining , pp. 150–160, A CM, 2000. [13] R. Guimera and L. A. N. Amaral, “F unctional cartograph y of complex metab olic netw orks,” Natur e , v ol. 433, no. 7028, pp. 895–900, 2005. [14] M. E. Newman and M. Girv an, “Finding and ev aluating communit y structure in netw orks,” Physic al r eview E , vol. 69, no. 2, p. 026113, 2004. [15] R. Guimer ˜ A˘ a, M. Sales-Pardo, and L. A. N. Amaral, “Classes of complex net works defined by role-to-role connectivit y profiles,” Natur e physics , vol. 3, 2007. [16] M. Newman, Networks: an intr o duction . Oxford Univ ersit y Press, 2010. [17] R. A. Hanneman and M. Riddle, “Introduction to social net w ork metho ds,” 2005. [18] G. Salton and M. J. McGill, “Introduction to modern information retriev al,” McGr aw-Hil l , 1983. [19] S. P . Borgatti and M. G. Everett, “Two agorithms for regular equiv alence,” So cial networks , vol. 15, pp. 361–376, 1993. [20] C. T. Butts, sna: T o ols for So cial Network Ana lysis , 2014. R pack age v ersion 2.3-2. [21] L. Kaufman and P . Rousseeuw, Clustering by me ans of me doids . North-Holland, 1987. [22] M. Maechler, P . Rousseeuw, A. Struyf, M. Hubert, and K. Hornik, cluster: Cluster Analysis Basics and Extensions , 2015. R pac k age versio n 2.0.3 — F or new features, see the ’Changelog’ file (in the pack age source). [23] J. Lesko vec and C. F aloutsos, “Sampling from large graphs,” in Pr o c e e dings of the 12th ACM SIGKDD international c onfer enc e on Know le dge disc overy and data mining , pp. 631–636, A CM, 2006. [24] P . J. Rousseeu w, “Silhouettes: a graphical aid to the in terpretation and v alidation of cluster analysis,” Journal of c omputational and applie d mathematics , v ol. 20, pp. 53–65, 1987.
Original Paper
Loading high-quality paper...
Comments & Academic Discussion
Loading comments...
Leave a Comment