Sensory evaluation of commercial coffee brands in Colombia
Colombian coffee farmers have traditionally focused their efforts on activities including seeding, planting and drying. Strategic issues to successfully compete in the industry, such as branding, marketing and consumer research, have been neglected. …
Authors: Edis Mauricio Sanmiguel JaimesRelated, Igor Barahona Torres, Hector Hugo Perez-Villarreal
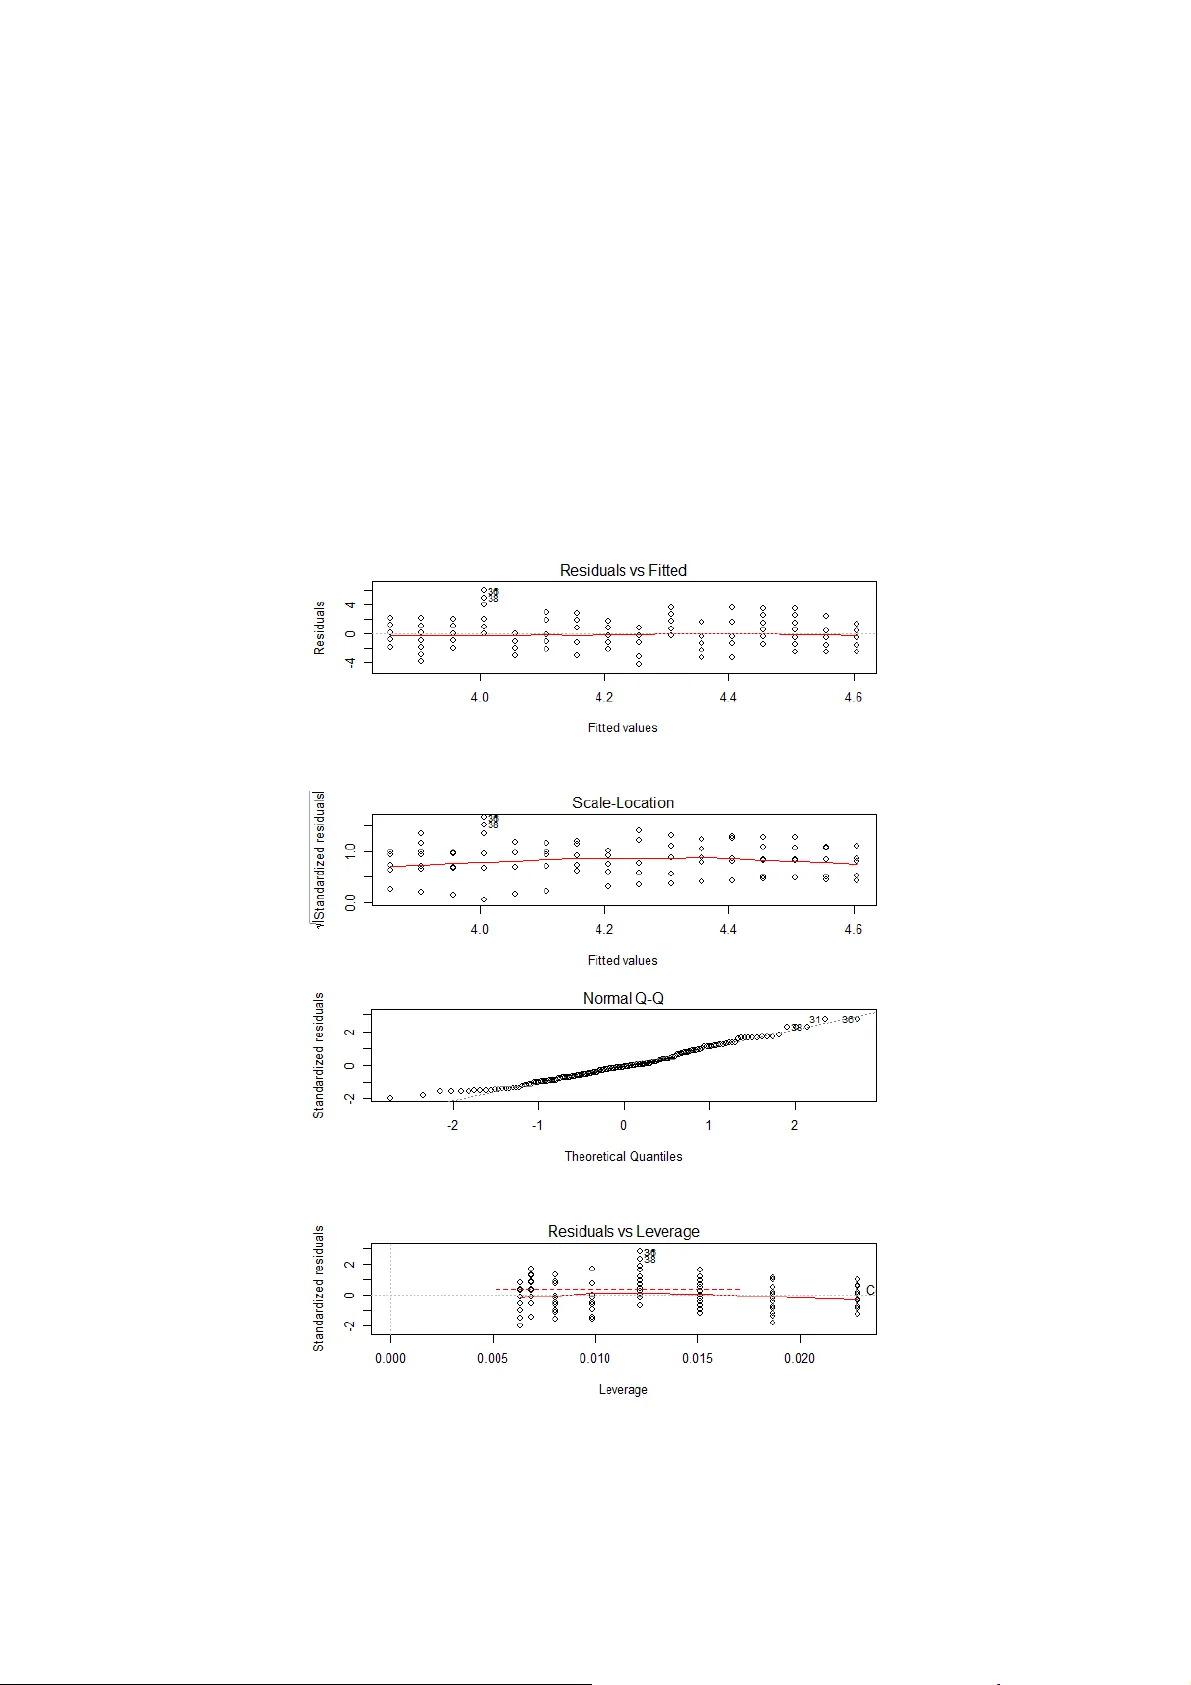
195 Sensory evaluation of commercial coffee brands in Colombia Edis Mauricio Sanmiguel Jaimes Departam ento de Administraci ón de empresas, Universidad Libre – Colomb ia – seccional Socorro, Calle 21 No. 7-75 San Gil, Santander, Colombia Email: ingedis@gmail.com Igor Barahona Torres* Departm ent of Stati stics, Math ematics and Com puter Science, Cátedras CONACYT, Autonomous University of Chapingo, 56230 Km. 37.5 high way México-Tex coco, Mexico Email: igor0674@g mail.com *Correspon ding aut hor Héctor Hugo Pérez-Villarreal Departm ent of Managem ent and M arketing, Popular Aut onomous U niversit y of Puebla State, 17 Sur 901, Barrio d e Santiago, Puebla, Mexico Email: hectorhugo.p erez@upaep.mx Abstract: Colombian coffee far mers have trad itionally focused their efforts on activities including s eeding, planting and drying. Strategic is sues to successfully compete in the industry, such as branding, marketing and consumer research, have been neglected. In this research , we apply a type of sensory analysis, based on several statistic al techniques us ed to investigate the key features of ten different brands of Colombian coffee. A pan el composed of 32 judges investigated nine different attr ibutes related to flavour, fragrance, sweetness and acidity, among others. The last section presents the conclusions reached regardin g customer preference and brands profil es. Keywords: sensory evaluation; characterisati on of beverages; descriptors of quality coffee; product se gmentation; Colombia. Reference to this paper should be made as fo llows: Jaimes, E.M.S ., Torres, I.B. and Pérez-Villarreal, H.H. (2015) ‘Sen sory evaluation of commercial coffee brands in Colombia’, Int. J. Business and Systems Research , Vol. 9, No. 3, pp.195–213. 196 E.M.S . Jaimes et al. This paper is a revised and exp anded ve rsion of a paper enti tled ‘Evaluación sensorial de marcas comerciales de café en Colomb ia’ presented at the S exto Coloquio Interdisciplinario de Doctor ado – Universidad Popular Autónoma del Estado de Puebla, Puebla City, México, 25 June 2014. 1 Introduction It is extremely difficult to p rovide a formal definition of the co ncept of quality, as it is “a complex and m ultidimensional concept that inco rporates an infinity of attribu tes that configure an d condition it, being particular fo r each of the product categ ory or service.” According to Calvo Fernández (1 997), some features that are found within the concep t of quality can distinguish a target quality (located on the si de of supply), and a perceived quality (located on the side of th e application). The first attempts to measure the target and verify the characte ristics of the product in terms of the aspects that configure them , while the second refers to the consu mers’ ap preciation of these characteristics, expresse d by the difference between what i s exp ected and what is actually obtained (Calvo Fernánd ez, 1997). Literatur e shows various appr oaches to the concept of product quality; four approach es to the same concept can be considered: 1 the metaphysical philo sophical approach 2 the product ion ma nagement appr oach 3 the economic approach 4 the focus on perceived quality or marketing performance and consu mer behaviour (Garvin, 1 984, cite d by Steemkam p, 1989). The food markets distinguished h ere offer products obtain ed through the use of technology and inpu ts following authorised processes and ru les implemented to assure ‘quality’. The growing demand for high quality pr oducts is due to the attributes th at they possess to satisfy consum er perceptions on health, safety and othe r relevant features in their purchasing decisions (Lacaze et al., 2007) ; the nat ural environm ent, through factors such as soil, geogra phy, topogra phy, weather and cro ps; as well as historical and cultural Sensory evalua tion of com mercial coffee brands in C olombia 197 specificities through th e production and processing methods used to con figure the characteristics and the quality of many agro -food products (Couillero t, 2000, cited by Granados and Alvarez, 2002) . Based on this g eneral perspective of th e concept of quality, this article will focus on the quality of Colo mbian coffees. The main ob jective of this research is to provide empirical evidence that will assist produ cers to identify the strengths and weakn esses on their products, as it simultaneously gen erates valuable information related to the most important co ffee brands in C olombia, in or der to assist custom ers to ma ke better informed purchase decisions. To achieve this objective, we asked three basic questions: 1 Are the te n most im portant C olombian c offee brands perceived as e qual or di fferent ? 2 How can a speci fic brand of Col ombian coffee be characterised among a group? 3 Is there a co nsensus of a group of judges re garding with a g iven attribut e? The rest of this article is composed as follows: the next section offers a discussion of sensory evalua tion m ethods applied to c offee; Secti on 3 provides t he formal defi nitions of the descrip tors used to e valuate the coff ees in this research; Section 4 presents a description of the quantitative model; market segmentation and features related to th e evaluating pan el are discussed i n Section 5; with t he results are presente d on Section 6. The last section is reserved for the conclusions. 2 The sensory evaluation of coffee The US Institute of Food Techno logists (IFT) defines sensory evaluation as “the scientific discipline us ed to evoke, measure, analyse an d interpret the reaction s to those characteristics of foods and other s ubstances that a re perceived by the senses of si ght, smell, t aste, touch and hearing.” On the other ha nd, sensory analysis i s a scientific discipline that is useful in the measurement, analysis an d interpretation of the complex feelings experienced by peop le with regard to certain char acteristics of foods (Calí, 2002 , cited by Césari et al., 2013). Sens ory evaluat ion uses one or m ore of the five sense s to evaluate foods. The tast ing panels, form ed of a group of people , evaluate specifi c food samples under controlled c onditions to evaluate them in different ways, depending on the specific sensory test realised. This is a unique ty pe of test that can m easure consum er acceptance and preference . To know the pub lic opinion about a pr oduct, there is no substitute for the evaluation by individual consumers (Vaclavik, 1998). Sensory evaluation allows the characterisa t ion of a batc h of coffee. The c up test assesses the characteristics of a certain c offee by tasters as they seek to recognise i ts strengths and weaknesses (Z apata Gómez an d Sarache Castro, 2014). Coffee co nsumers prefer products of the highest q uality, not only good flavour and taste, but also that its consumption does not affect con sumer’s health. The quality of a coffee beverage depends on many factors: genetic origin, latitu de, a ltitude, local weather, farming , healthcare, agronomic practices, coffee cultu re, crop quality, type an d control during the beneficiation, harvesting, sto rage, roasting and bevera ge preparation p rocesses (Puerta Quintero, 19 88). Tasting i s the met hod used to det ermine the c haracteristi cs of aroma, taste and coffee health. This test, also refe rred to as the sensory quality evalu ation of coffee and cup test, is used to identify any defects present in the coffee be verage, to 198 E.M.S . Jaimes et al. measure the intensity of a sensory characte r istic like acidity and sweetness, and likewise to describe the flavou r, aroma and global quality o f the product (Pue rta Quintero, 2009). The sensory evaluation of food quality is similarly used as a form of evaluating and describing the product categories, as well as implementing sets of quan titative scales. For this reason it is also called th e quantitative descriptive meth od. The scale proposed by Puerta Quintero (19 97), entitled ‘Scale for the assessment of the qua lity of the green arabica coffee beverage’ represen ts an example of a quantitative scale ap plied on assessing beverages. One of the advantages of sensory analysis is its reproducibility, and its capacity to describe and characterise food an d beverages. This is a m ethod that allows an individual as well as integral evaluation of the sens ory character istics of the coffee and the relationshi ps between t hem, in or der to obtain t he greatest am ount of inform ation possible fr om a single sam ple (ICON TEC, 2011) . 3 Descriptors used in the sensory evaluation of coffee A descriptor is a term that refers to a p roduct characteristic to be evalu ated. The properties of the descript or must be such that they can be eval uated on an intensity scale (ICONTEC, 2011). The sensory qualities of co ffee: aroma, acid ity, bitterness, body, flavour, health and grain quality, are the most important aspects in t he acceptance and definition of coffee quality (Puerta Quintero, 1997). According to INFOCAFES (2009), the descriptor s that sho uld be conside red in a sens ory evaluation of coffee, are briefly described belo w: • Fragrance : the intensity produced by the vola tile components of coffee tha t are perceived by smell without t he addition of water (ICONTEC, 2011). This is the first indicator of the sample quality, however, it shou ld not be qualified as a separate item regardless of the aroma. From this beginn ing, positive or neg ative attributes of the coffee analysed can be m anifested to the tester (USAID, 2005). • Aroma : corresponds to th e olfactory perception of intensity and quality, due to th e volatile compounds of coffee entrained by water steam at the time of making the beverage (FEDECAFE, 2006). A good co ffee drinker, lik e a wine taster, will smell/test the aroma before wetting h is lips with the coffee. What we taste is determined by what we smell (INF USIONIS TS, 2014). As for USAI D (2005), the smell, this is the smell of coffee and give s us a general idea of the already ground sample once water is added. • Acidity : sensation caused by the acidic substances of coffee that pass to the drink and are detected in the oral cavit y. Dependin g on variety , profit s ystem, gro wing regi on, degree of roast and raw m aterials, the high er the degree of roasting, t he less the acidity (ICONTEC, 2011). Acidic intens ity is a desi rable featur e, appreciated in coffee, as there is a positive relation ship between the intensity o f the acid impression and coffee quality (INFOCAFES, 2009). • Bitterness : feeling produced by bitter coffee substances when they are extracted with hot water and passed to the beverage. Bittern ess is perceived mostly at the back of the tongue. An unp leasant bitterness can be due to an excess coffee extraction. The higher the degree of roasting the more bitter taste (ICONTEC, 2011) Sensory evalua tion of com mercial coffee brands in C olombia 199 • Body : strength, character and heaviness of the be verage associated with the characteristics of the raw material and the water-coffe e ratio em ployed in pre paring the beverage (ICONTEC , 2011). B ody is t he thickne ss of the flav our, cons istency or thickness of the liquid (USAID, 2005). • Sweetness : primary olfacto ry and gustatory sensati on perceived pri marily in the fungiform papillae of the tip of the tong ue, and associated w ith the presence of sweeteners. Soft, clean sensation, pleasant, in the co ffee bev erage . • Aftertaste : Post-tasting flavours that remain in the mouth after tasting the drink . These may be pleasant or unpleasant depending on th e initial features of the raw materials, processing and product storage con ditions (ICONTEC, 2011). Residual taste/post taste flavour is the perm anence of flavour on the palate after having expulsed the co ffee from the mouth. This can be agreeable, leaving a swee t and refreshing taste; or disgusting, leaving a bitter or harsh taste (USAID, 2005) • Roastin g-Agtron : The degree of th e coffee roast is determined qualitatively by colour. Coffee origin and properties may influen ce the shades obtained during the roasting process. In ge neral terms, the clear e r the colour the lowe r the roast, and the softer, more acidic and less bitter the flav our. The darker the coffee t he higher t he roast, with a stronger, less acidic and mo re bitter flavour (FEDEC AFE, 2006). Some colour range s have bee n defined f or coffee roast and ground coffee to express the degree of roasting. For instance, the Specialt y Coffee Association of America (SCAA) has developed a point system t o grade the col our level f or differe nt types of roast (SCAA, 2009). The system consists of eight numbered di sks that represent a certain colour. Ground coffee is pr essed into a Petri dish and the colour compared against the disks. A number is then assi gne d to the degree of r oast accordi ng to the Agtron Gourmet Scale which ranges f rom no . 95 (the lightest roast), and then lower at intervals of from 10 to 25 as th e roast dark ens (The Coffe e Guide, 2014). • Global impress ion : Note made by the judge at the time of judging the beverage. Summary and group judgement regarding the quality of the coffee sample analysed (ICONTEC, 2011) 4 Model description The generalise d linear m odel (GLM) approach, i ntroduced by Nelder a nd Wedderbur n (1972) is applied here to analyse our co llected data. According to Calcagno and Mazancourt (2010), GLMs prov ide a flexible framework to descri be how a dependent variable is ex plained in te rms of a set of explanat ory varia bles (somet imes called predictors). GLMs also offer an add itional a dvantage as dependent variables can be either continuous or discrete. On t he other hand, t he explanatory variables can be either quantitative or categorical. A ccording to Calcagno and M azancourt (2010), categorical variables are referred to as ‘covariates’, while categorical descriptors a re referred to as ‘factors’. According t o Nelder and Wedderburn (1972), GL Ms receive the nam e linear as they are assumed t o have a linear e ffect on the trans formati on of the depende nt variabl e defined by t he link functi on and rand om effect on t he error part o f the model. That is to say, the term ‘linear m odel’ encompasses both syst ematic and ran dom components. It is 200 E.M.S . Jaimes et al. composed of x i independent vari ables whose values are su pposedly kno wn, an equal number of coefficients or pa rameters (for exam ple α i , β i , γ i , etc.) and the model error (usually represented as ε i ). The coefficients are likewis e sup posedly fi xed and un known, and therefore m ust be estim ated. Breslow (19 96) identi fies four basic ass umptions behi nd GLM’s. First, all observations must be statistically indep endent; residuals must be randomly distributed; the variance structure co rrectly specified and a linear relationship between the i ndependent va riable and factor. Figure 1 shows ho w the assum ptions were validated for t he factor ‘jud ge’ in our m odel. Vali dations for al l other fact ors of the m odel are omitted here due to space limitations, however all were similarly calculated. Figure 1 Validating assumptions of the model for the f actor judge (s ee online version for colours) Sensory evalua tion of com mercial coffee brands in C olombia 201 With regard to the structure of the mode l, three factors are analysed for the 320 observations that co mprise a dataset. Namely, if 32 panellists participated in our study and each pane llist evaluated ten differen t br ands of coffee u sing nine different criteria, then our dataset is on the order of 320 × 9. Formulation (1) presents the lin ear model wit h the three factors of c offee, judge and sessi on. As previo usly me ntioned, the factor ‘coffee’ represents ten differe nt bran ds of Colombian coffee, ‘judge’ refers to either graduat e or undergra duate stu dents and, the ‘se ssion’ i s the num ber of replic as carried out in the study. The model also considers t hree types of interactions between the main effects, which are coffee-ju dge , coffee-session and judge-session. =+ + + + + + + ijk i j k ij ik jk ijk Y μ γγ ε α βα β α β (1) () ( ) (0 , ) c ov , 0 ′′ ′ == ijk ijk i j k L ε N σε ε μ mean effect α i coffee effect β j judge effect γ k session effect αβ ij product-judge interaction α γ ij product-secion interaction β γ jk judge-secion interaction ε ijk model error. With regard to the type of effect from each factor, c offee is defined as a fi xed effect considering th at there is a fixed num ber of bra nds participat ing on the st udy. The judg e factor is considered as a random effect as the participating students were selected randomly. Final ly, the session e ffect is a fixe d effect given t hat only one replica was conducted. It is important to reiterate that based on the lack of replicas it was not possible to estimate the effect of the coffee-judge interaction. 5 Market segmentation and panel features In the Colombian coffee industry like in the global industry, there are different manufacturi ng processes tha t can be classifi ed into two ma jor groups: roasted coffe e (whole or ground) a nd solu ble (insta nt) coff ees. Natural r oasted cof fee is roaste d withou t any additives by subjecting it to a stream of hot air. Th is causes the bean to grow considerably and to lose about 18% of its weight (Fo od Industry, 2014). Solub le coffee (lyophilised or solubilised) is ob tained by dehydration or by dryi ng the coffee. Ground and roasted coffees are used as refe rence here, as t hey correspond to the highest consumption segment in th e country – abou t 86% of all coffee cons umed in the entire country (pyme.com, 2013). Decaffeinated and fl avoured c offees were disc arded from our study due to their low consumption. Another aspect taken into account is the qu ality characteristics presented on the product labe l by t he producer a nd for th e end consum er. A segmentation is propo sed in this respect considering th e quality aspects of the raw 202 E.M.S . Jaimes et al. material used to make the coffee. Ma rket price also becomes an i ndicator of product quality, while another aspect corresp onds to th e geographical denominatio n of the coffee, i.e., the region of the country fro m where it comes. A total of six segments were identified: traditional, flavo ured and decaffeinated, premium or specialty, with designation of ori gin, with so cial content and gou rmet. This segm entation was devel oped after revie wing the shops, supermarkets and convenience stores located i n the municipalities of Socorro and San Gil in the Department of Santander, Colombia. The judges evaluat ed physical descri ptors such a s degree of roast ing using t he Agtron ® colour scale (SCAA, 200 9; Davids, 2010) in conjunction with the sensory descriptors dis cussed in the pre vious section. The techni ques pro posed by the nati onal coffee research centre and ot her authors’ leader s in the field (Puerta Quintero, 1998) were adapted in ord er to obtain valid and accurate results in the sensory analysis. Best practices docu mented by th e SCAA (200 9), the Colom bian technical standard NTC 4883 Sensory Analy sis and ICONT EC (2011) were al so incorporated during the data co llection process. Table 1 provides a summ ary of the va riables incorp orated in the study. The panels were structured applying criteria that classified the participating students according to their studies and cla ssifying t hem into two subgroups: 1 undergrad uate 2 graduate students. First a group com posed of 16 unde rgraduat e students evaluate d the ten coffee bra nds using the descri ptors presente d in Table 1. A second evalua tion was made by the graduate students, maintaining the same conditio ns an d variables. On both cases, a ten-lev el quantitative scale was applied, on which 1 repr esented ‘worst’ and ten ‘best’. Data were collected on sheets of paper and later captur ed in an Excel spreadsheet. The electronic spreadsheet was then exported to t he open-a ccess software SensoMi ner ® (2015), in ord er to run the calculations and t he analysis (more details about the software can be found at http://sensominer.free.fr/). Table 1 Input variables in the study fo r the characterisation of products Coffee descriptors Number of panellists Number of evaluated brands Number of segments Fragrance 32 10 6 Aroma Acidity Bitterness Body Sweetness Aftertaste Roasting-Agtron Global impression Considering t hat roasted c offee, both wh ole and groun d represents 8 6% of the count ry’s trade (Portfolio, 2012), this was used as th e baseline for the research project. The project was then conduct ed by class ifying the si x market segm ents with roasted a nd ground coffee, considering produ ct qua lity, expressed as the raw material and the market price. The category of decaffeinated and flavoure d coffee was discarded because the process Sensory evalua tion of com mercial coffee brands in C olombia 203 requires altering the natural conditions of the roasted and ground coffee manuf acturing process. As a result, we received the following propose d segmentation, which is als o used as reference in this research. (Note that all the following prices are i n Colombian pesos). • Traditiona l coffee : this is a product made from a mixture of low-qu ality raw materials corresponding to the product segmen t, and that are the most popular in the market. The prices for these products range fr om $6,000 to $9,000 per pound. • Premium or specialty : commercial produ cts that use raw materials such as specialty or premium coffee. Prices range from $9,100 to $12,000 per pound. • Gourmet : coffee with ra w materials that m eet special conditions such as aromatic fruity notes r herbal and that co rresponds to high quality raw materials. Prices range from $12 ,100 to $16,000 per po und. • Designatio n of origin : corresponds to products with an appellation of origin fo r a specific geographical area. In most cases , this is gi ven by e nvironm ental or geographical conditio ns. Prices for this segment can range from $16,100 to $20 ,000 per pound. • Sustainable and organic (or s ocial conte nt coffees) : corresponds to products that have been certified, such as for instance, ‘bird-friendly’, ‘rainforest alliance’, ‘USDA organic’ a nd ‘fair trade ’, among others (m ore inform ation rel ated with co ffee certifications can be reached on http://www .ico.org/sustaininit.as p). The price range for this product is f rom 16,000 to 21,000 per pound). • Flavoured and decaffei nated coffees : Flavoured coffees have added ingredients that complement the coffee taste. In decaffeinate d coffees, the ca ffeine is removed before roasting the c offee. By l aw decaffeinate d coffee cann ot contai n more than 0.1% of caffeine (Echeverr i et al., 2005). These are coffees that h ave had a resin incorporated either during or after the roasting process, including vanilla, chocolate, strawberry, walnut and amarett o, among others (Far fán Valencia, 2 008). The panel stru cture and market segmentat ion previously discussed for m the theoretical foundation of t he study. They are also used as a guideline to allow a systematic data collection and finally for a con sistent anal ysis, which lead us to accurate resu lts. 6 Results A total of ten different brands of coffee with a high presence in the Colom bian market were classified in five market segments. Although the complete market segmentation proposed act ually com prises six segm ents, th e category of flavoure d and decaffei nated coffees was discarded as this category deal s with coffees whose nat ural characteristics have been mo dified (ICONTEC, 2011 ). Two commercial sa mples were randomly selected from the coffee of e ach segment st udied, an d were then evaluated fo r the ni ne descriptors presented i n Table 1. All the co mmercial brands were evalua ted according to a scale with values from 1 to 10, where 1 re presented the ‘worst quality’ and 10 denoted the ‘best quality’. The quality assessment was performed by 32 panellists div ided into two groups of under graduate and gra duate student s. The experim ent consisted of onl y one replica, meaning th e panellists evaluated each product just on ce. An evaluation form 204 E.M.S . Jaimes et al. was developed for the proje ct, using as refere nce the exis ting technical st andards for sensory evaluation of coffee (ICONTEC, 2011), the proposed methodo logy by CENICAFE ( Puerta Qui ntero, 199 7) and the m ethodology propose d by the SCA A (2009). The figures are box-plots that show the descriptive statistics for each descriptor. While each commercial brand is represented on the horizontal axis, the grade obtaine d is given on the vert ical axis. Figures 2 to 10 allow a general comparison of each commercial brand with respect to each descriptor. A t otal number of nine box-plots are given, relating to the total of nine descriptors defined. The tiny blue squa re insi de each box represe nts the obtained average. The box-plot analysis is basically an atte mpt to identify the best an d worst evaluated brand, as seen in fo llowing lines. Note that for purposes of this analysis, th e nine descriptors of the model are assum ed having equal weight . • Acidity : the highest variati on for this descriptor was found in c offee num ber 65, and the lowest variation was found in coff ee number 72. Number 44 is the most acidic coffee, followed by coffee 35; while number 21 is the least acidic coffee. Note that this descript or is very i mporta nt because acidity is closely related with quality. The higher the acidity, the higher the quality (see Figure 2). • Bitterness : Brand number 35 is the most bitter co ffee, while the coffee with the highest variation in bitterness is nu mber 87. Coffee 73 on the other hand has the lowest variation. According to th e panel, coffee number 72 is the coffee with the least bitterness of the group of ev alu ated brands (see Figure 3). • Aroma : According to this descript or coffee number 6 5 has the strongest arom a, while number 87 is the coffee with the w eakest aroma. The coffee with the highest variation in aroma is identified as coffee number 65, while number 77 is the coffee with the lowest variation (see Figure 4). Figure 2 Box-plots for acidity (see online version for colours) Sensory evalua tion of com mercial coffee brands in C olombia 205 Figure 3 Box-plots for bitterness (see online version for colours) Figure 4 Box-plots for aroma (see online version for colours) • Fragrance : with regard to this descri ptor, coffee num ber 77 was perceived t o have the strongest fragrance, wh ile coffee number 87 was the least fragrant. While the coffee with the highest variati on was number 72, that with the lowest variation was on coffee 11. This attri bute is rele vant in te rms of cons umer prefere nce and perceived quality. In terms of perception, the stronger the fragrance, th e higher the quality (see Figure 5). • Sweetness : in general term s this descripto r has a very low ra ting in coffe es num bers 35, 65 and 72, with coffee nu mber 35 the least sweet of this group. Coffee number 49 on the ot her ha nd was labe lled as the sweetest . In term s of variat ion, num ber 49 was also the coffee with t he highest va ria tion, while number 11 obtained the lowest 206 E.M.S . Jaimes et al. variation. It is important to mention that in Colombia coffee is normally consumed after adding sugar. I n the case at ha nd, the c offees were e valuated wit h no sugar added to the sample s, thus explai ning the low m arks obtai ned by all brands (see Figure 6). • Body : coffee number 7 7 was perceived as having the most body , while nu mber 72 was the coffee with the least body. In term s of variatio n, number 11 obtained the highest variation and coffee 49 the lowest. It is important to reiterate that this attribute is relevant to the overall quality of the product, g iven that the thickness of the flavour, consisten cy and thickness of the liquid are important in the preferences of Colombia n consum ers (see Figure 7 ). Figure 5 Box-plots for fragrance (see online version for colours) Figure 6 Box-plots for sweetness (see online version for colours) Sensory evalua tion of com mercial coffee brands in C olombia 207 Figure 7 Box-plots for body (see online version for colours) Figure 8 Box-plots for actron (see online version for colours) • Actron : The lowest variations were identified f or coffees 72, 73 and 77, with coffee number 77 the lowest of the entire group. Coffee 35 on the other hand o btained the highest evaluat ion for t his attribut e. In term s of variat ion two c offees obtained the lowest marks for this m easure, specifica lly num bers 72 and 73, m eaning that the majority of the judges agree with the resp ect to this attribute. We therefore find this to be a partial consensus of the group with regard to this attribute, and finally an answer the second question of this resea rch (see Figure 8). • Aftertaste : coffee number 49 achieved the highes t average on this descriptor, while coffee number 72 had l owest value. Wit h respect to vari ation, coffee num ber 87 had the greatest value while num ber 72 had t he lowest variation. T his aspect is im portant 208 E.M.S . Jaimes et al. for Colombian custom ers, because t he longer the flavou r rema ins on the mout h, the higher the quality as perceived by consumers. • Global impress ion : This is the last descriptor evaluated by the judges. Th e brand with the best global impression was number 44, sugg esting that it is the most preferred by t he Colom bian custom ers. The bran d with the lowest global impressi on was number 72, suggestin g that bran d 72 is that l east preferred by Colom bian consumer. Figure 9 Box-plots for aftertaste (see online version for colours) Figure 10 Box-plots for global impression (see online version for colours) Sensory evalua tion of com mercial coffee brands in C olombia 209 6.1 Multidimensional analysis A multivariate analysis was perform ed to create a more accurate picture of the Colombian cof fee consumer. Usin g the principal com ponent anal ysis (PCA) techni que, a map was drawn of co nsumer prefere nces from the plot loadings . In order t o gain a deeper understandi ng of the preferences o f Colombi an consum ers, grades provided by the ju dges were analysed by k-means cluster using the Euclidean distance (s ometimes called a hierarchical clust er analysi s method). T his method basically relates rows (cons umer evaluations) that are closer in the factoria l plane with similar cons umption preferences . Furthermore, the PCA characterises comm er cial brands of coffee using a sim ple tabulation and the Pearson’s chi-squared to test sim ilarities among clusters. This is graphically represented on t he factorial plan e using the first two axes, as presented in Figures 12 and 13. The cl oser the brands on t he factorial plane, the more sim ilar they are. Note that brands 21, 65 and 49 are quite close in Figure 12; therefore, these brands are perceived as sim ilar by the judge s. In this form the matri x data obtained from the PC A produces ‘l oadings’ fo r the coffee b rands and ‘sco res’ for cons umer evalu ations. According to Fi gures 11 and 12 , coffees l ocated in the u pper right quadrant are affected by the overall impr ession of the aroma, sweet ness, fragrance, body and aftertaste. More specifically coffee 44 in th e case of the aftertaste. On the othe r hand, coffee 35 is perceived as the sweetest. Coff ees l ocated in the lower right quadrant are affected by bitterness, acidity and agtron , specifically brands 73 and 77. The co ffees closest to the horizontal axis are affected more by aftertas te flavour, body and fragran ce, while the coffees on th e verti cal axis are more affected by agtron and sweetnes s. The coffees labelled with the numbers 35 and 21 are characterised as sweet. Finally, the coffee that obtained t he be st gl obal impressi on was coffee 44 (see Figure 13). Figure 11 Map of attributes on the factorial plan e 210 E.M.S . Jaimes et al. Figure 12 Map of products on the f actorial plane (see online version fo r colours) Figure 13 Map of products on the f actorial plane w ith % of inertia (see on line version for colours) Sensory evalua tion of com mercial coffee brands in C olombia 211 7 Conclusions Consumer pre ferences, like any other human beha viour, are a ffected by i nnumerable interrelated factors. In the particular case of the hot beverages industry, attrib utes that consumers perceive through their senses are of strategic importance. It is evident that companies that expect to create co mpetitive advantages should make a deeper investigation in to sensory attributes, in o rder to align their produ cts with the consumer preferences. This paper di scusses nine se nsory attribut es of hot coffee, attributes that based on our review of literature are relevant to the Colombian consumer. A group of ten brands of coffee that predominate in th e Colom bian market were investigate d under the gi ven attributes. A panel composed of 32 individu als m ade a single eval uation of each coffee. The name of each comm ercial brand is not pub lished here, as that is c onsidered to be sensitive information . However, we are willing to provid e the full results on requ est sent to the main author’s e-mail address. According to our results, there is a ten dency in Colombia to consume coffees th at have a strong fragrance, aro ma, body and aftertaste. Colombian consumers similarly tend to prefer sweeter coffees, rather than bitter. These features, as discusse d earlier, sh ould be ob served by com mercial coffee brands if t hey expect to be successful on Colombian mark et. For insta nce, the product identified as number 44 received the highest overall impression, while product 72 was identified as the worst in terms of the mentioned attributes. As seen in Figure 11, attributes such as aroma, fragrance, body and af tertaste are strongly related with the global impression. At this point, it is important to high light the limitations of these conclusio ns. Since the study included 32 pa nellists, each of whom evaluated a coffee brand only once , results might b e altered by variabl es such as weather co nditions, educati on level and age , among othe rs. Further research should incl ude socio-dem ograp hic variables and replicas during dif ferent m onths of t he year. Sensory evalu ation is a disci pline that is gr owing in i mportance due its practical and convenient res ults for the fo od and bevera ge industries . This project i s a limited, but illustrative example of the suitability of this methodology to alig n features of the beverages to the voice of the c ustomers. References Breslow, N.E. (1996) Generalized Linear Models: Checking Assumptions and Strengthen ing Conclusions , 31 July, Department of Biostatistisc University of Washington [online] http://citeseerx.ist.psu.edu/viewdoc/downl oad?doi=10.1 .1.50.610 5&rep=rep1&type=pdf (accessed 21 January 2013). Calcagno, V. and Mazancourt, C. (2010) glmulti: An R Package for Easy Automated Mod el Selection with ( Generalized) Linear Models , M ay [online] http://www. jstatsoft.org/ (accessed 6 February 2014). Calí, M. (2002) Análisis sensorial de los a limentos. Fruticultura & Diversificación INTA , EEA Alto Valle [online ] http://www.inta.gov.ar/altovalle/info/biblo/r ompecabezas/pdfs/fyd48_entrev.pdf (a ccessed 10 March 2014). Calvo Fernández, S. (1997) Factores determinantes de la ca lidad percibida: Influencia en la decisión de compra [online] http://eprints.u cm.es/3717/.U CM Ed. Madrid (accessed 21 March 2014). 212 E.M.S . Jaimes et al. Césari, M., Césari, R., Gámbaro, A. and Arnau, E. (2013) ‘Análisis de datos provenientes de pruebas sensoriales del vino, utilizando la lógica borrosa’, p aper presented at the Séptimo Encuentro de Investigadores y Docentes de In geniería , Los Reyunos, Mendoza, Argentina [online] http://www.researchgate.net/pro file/Matilde_Ines_Cesari/publication /255880186_ Acesari1/links/0c960520cc5d69451c000000 (accessed 22 Febru ary 2014). Couillerot, C. (2000) The Protected Des ignations of Origin , Institute of Rural econom y of ETH from Zurich [online] http://www.aoc.igp. com/Aopgb/haopgb.h tm (accessed 13 April 2014). Davids, K. (2010) Saying Coffee , November, The Naming Revolution [online] http://www.roastmagazine.com /resources/Articles/Roast_ NovDec10_SayingCoffee.pdf (accessed 21 April 2014). Echeverri, D., Buitrago, L., M ontes, F., Mejía, I. and G on zález, M.d. (2005) ‘Café para cardiólogos’, Revista Colombiana de Cardio logía , Vol. 11, No. 8, pp .357–365. Farfán Valencia, F. (2008) CENICAFE , 22 September [online] http: //www.cenicafe.org /es/ documents/LibroSistemasProduccionCap itulo10.pdf ( accessed 7 May 2014). FEDECAFE (2006) ASPECTOS DE CALIDAD DEL CAFÉ PARA LA INDUSTRIA TORREFACTORA NACIONAL , 24 August [online] http:// www.iue.edu.co/portal/images/ negocios_internacionales/ cafe/LACALIDADENLAINDUSTRIAD ELCAFE.pdf (accessed 6 March 2013). Food Industry (2014) proceso de elaboracion del café , 15 April, de cafe tostado [online] http://ben.upc.es /documents/eso/aliments/html/ estimulantes-4.html (accessed 22 February 2014). Garvin, D.A. (1984) ‘What does ‘product quality’ really means?’, Sloan Management Review , Vol. 26, No. 1, pp.25–43 [online]http://www. oq rm.org/English/What _does_product_quality_ really_means.pdf (accessed 21 March 2013). Granados, L. and Alvarez, C. (2002) ‘Variabilid ad d e establecer el sistem a de denominacion de origen de los productos agroalimentarios en Costa Rica’, Aostarricense , Vol. 26, No. 1, pp.63–72 [online] http://www.redalyc.org/ pdf/436/43626106.pdf (accessed 21 Ap ril 2014). ICONTEC (2011) ‘Norma Técnica Colombiana NTC 4883’, Analisis Sensorial. Café. Metodología para analisis sensor ial cuantitativo descriptivo del café , ICONTEC, Bogotá, Colombia. INFOCAFES (2009) Caracteristicas sensor iales , October [online] http://www.infocafes.com/des cargas/biblioteca/24.pdf ( accessed 22 February 2014). INFUSIONISTS (2014) Cata de café [online] http://infusionistas.com/cat a-de-cafe/ (acc essed 6 March 2013). Lacaze, V., Rodriguez, E.M. and Lupín, B. (2007) ‘Alimentos diferenciados’, FACES , V ol. 13, No. 28, pp.7–34. Nelder, J.A. and Wedderburn, R.M. (1972) ‘G eneralized linear models’, Journal of the Roya l Statistical Society. Series A (General) , Vol. 135 , No. 3, p.370–384. Portfolio (2012) Crece el consumo de café en Colombia , 13 March [online] http://www.portafolio.co/economi a/crece-el-consumo -cafe-colombia (accessed 21 April 2014). Puerta Quintero, G.I. (1988) Calidad en la taza de las variedad es de Coffea arabica L. cultivadas en Colombia , 1 December, CEN ICAFE [online] http://biblioteca.cenicafe.org/hand le/10778/64 (accessed 10 March 2014). Puerta Quintero, G.I. (1997) Escala para la Evaluacion de la ca lidad de la bebida de café verde Coffea arabica, procesado por via húmeda , 1 January, CENICAFE [online] http://biblioteca.cenicafe.org/hand le/10778/62 (accessed 6 March 2013). Puerta Quintero, G.I. (1998) Calidad En Ta za De Las Variedades De Coffea arabica L , CENICAFE, pp.265–278, Obtenido de cultivadas en colombia. Puerta Quintero, G.I. (2009) ‘Los catador es de café’, Avan ces técnicos 381 Cenica fé , pp.1–12. Revista pyme.com (2013) En #MiDíaDelCafé, un análisis de l consumo de café en Colombia , 27 June [online] http://www.re vistapym.com.co/destacados/v erdad-acerca-caf e-colombia- ofertademanda-publicidad-consu mo (accessed 21 April 2014). Sensory evalua tion of com mercial coffee brands in C olombia 213 Specialty Coffee Association of America (SCAA) (2009) green-coffe e-color , 21 November [online] http://www.scaa.org /PDF/resources/gr ee n-coffee-color.pdf (ac cessed 15 March 2014). SensoMiner (2015) SENSOMINER , 20 January [online] http://sensominer .free.fr/ (accesse d 2 January 2015). Steenkamp, J-B.E. (1989) Product Quality: An In vestigation into the Concept and How It Is Perceived by Consumers: Wageningen , Van Gor cum Assen Press, Netherlands. The Coffee Guide (2014) Medicion del color del café tostado , Centro de Comercio Internacion al [online] http://www.laguiadelca fe.org/guia-del-cafe/ calidad-del-cafe/Medicion-del-color-del- cafetostado/?menuID=3377 (accessed 5 May 2014). USAID (2005) Normas y estandares de catación , 29 August, Para la region de centroamérica [online] http://pdf.usaid.gov /pdf_docs/pnadg946.pdf (accessed 15 April 2014). Vaclavik, V.A. (1998) Fundamentos de ciencias de los alimentos , Editorial Acribia S:A, Zaragoza. Zapata Gómez, A. and Sa rache Castro, W.A. (2014) Mejoramiento de la calida d del café soluble utilizando el método Taguchi , Obtenido de Ingeniare. Revista chilen a de ingeniería, January, http://www.scielo.cl/scielo. php?script=sci_arttex t&pid=S0718- 33052014000100011&lng=es&nrm=iso (accessed 16 March 2014).
Original Paper
Loading high-quality paper...
Comments & Academic Discussion
Loading comments...
Leave a Comment