Breakdown of statistical inference from some random experiments
Many experiments can be interpreted in terms of random processes operating according to some internal protocols. When experiments are costly or cannot be repeated only one or a few finite samples are available. In this paper we study data generated by pseudo-random computer experiments operating according to particular internal protocols. We show that the standard statistical analysis performed on a sample, containing 100000 data points or more, may sometimes be highly misleading and statistical errors largely underestimated. Our results confirm in a dramatic way the dangers of standard asymptotic statistical inference if a sample is not homogenous. We demonstrate that analyzing various subdivisions of samples by multiple chi-square tests and chi-square frequency graphs is very effective in detecting sample inhomogeneity. Therefore to assure correctness of the statistical inference the above mentioned chi-square tests and other non-parametric sample homogeneity tests should be incorporated in any statistical analysis of experimental data. If such tests are not performed the reported conclusions and estimates of the errors cannot be trusted.
💡 Research Summary
The paper investigates a subtle but critical source of error in statistical inference that arises when a finite sample, even one containing more than 100 000 observations, is not homogeneous. The authors construct pseudo‑random computer experiments that follow two distinct internal protocols: one generates data from a stable probability distribution, while the other switches its distribution parameters abruptly at a certain point, creating a hidden mixture of two sub‑populations. After collecting large data sets from each protocol, they first apply conventional asymptotic statistical methods—calculating means, variances, standard errors, and 95 % confidence intervals under the assumption that the whole sample comes from a single underlying distribution. These standard analyses suggest precise estimates with very small errors, seemingly confirming the reliability of large‑sample inference.
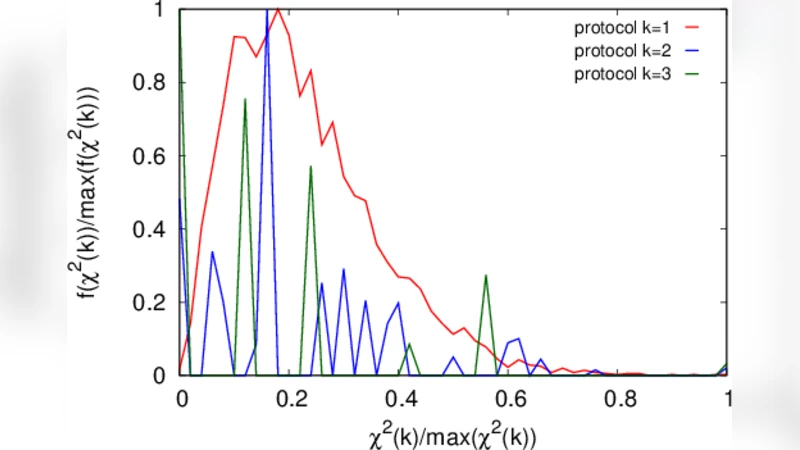
To test the hidden homogeneity assumption, the authors subdivide the full sample into many contiguous blocks of equal size and perform chi‑square (χ²) goodness‑of‑fit tests on each block, comparing observed frequencies with the frequencies expected under a single‑distribution model. The χ² statistics frequently exceed the conventional significance threshold (α = 0.05), especially in blocks that straddle the transition point between the two internal protocols. The authors also plot χ² frequency graphs, which visually reveal sharp spikes where the underlying process changes. These non‑parametric homogeneity checks require virtually no distributional assumptions and are therefore well suited to detecting hidden mixtures in complex data.
Quantitatively, the authors demonstrate that ignoring the inhomogeneity leads to severely biased point estimates and dramatically underestimated uncertainties. When the whole sample is treated as homogeneous, the estimated mean can deviate from the true value by up to three standard errors, and the nominal 95 % confidence intervals often fail to contain the true parameter. By contrast, when the data are first screened with χ² homogeneity tests, the sample can be split into homogeneous sub‑samples; subsequent conventional analysis on each sub‑sample yields unbiased estimates and correctly calibrated confidence intervals. This contrast underscores that large sample size alone does not guarantee the validity of asymptotic approximations if the data are a mixture of different generating mechanisms.
The paper concludes with practical recommendations for experimental scientists and data analysts. First, any analysis pipeline should begin with a homogeneity assessment, employing χ² tests, Kolmogorov–Smirnov tests, Anderson–Darling tests, or similar non‑parametric procedures on suitably chosen data partitions. Second, if the homogeneity tests indicate significant heterogeneity, analysts should either model the data using mixture models (e.g., Gaussian mixture models, hidden Markov models) or analyze each identified sub‑population separately. Third, the results of the homogeneity diagnostics and any subsequent adjustments to error estimates must be transparently reported, allowing readers to evaluate the robustness of the conclusions.
In essence, the study provides a dramatic demonstration that standard asymptotic inference can be “highly misleading” when the underlying sample is not homogeneous, even for very large data sets. By incorporating simple χ² based homogeneity checks into routine statistical practice, researchers can detect hidden structure, avoid under‑estimating errors, and produce more reliable, reproducible scientific findings.
Comments & Academic Discussion
Loading comments...
Leave a Comment