Scalable Modeling of Conversational-role based Self-presentation Characteristics in Large Online Forums
Online discussion forums are complex webs of overlapping subcommunities (macrolevel structure, across threads) in which users enact different roles depending on which subcommunity they are participating in within a particular time point (microlevel s…
Authors: Abhimanu Kumar, Shriphani Palakodety, Chong Wang
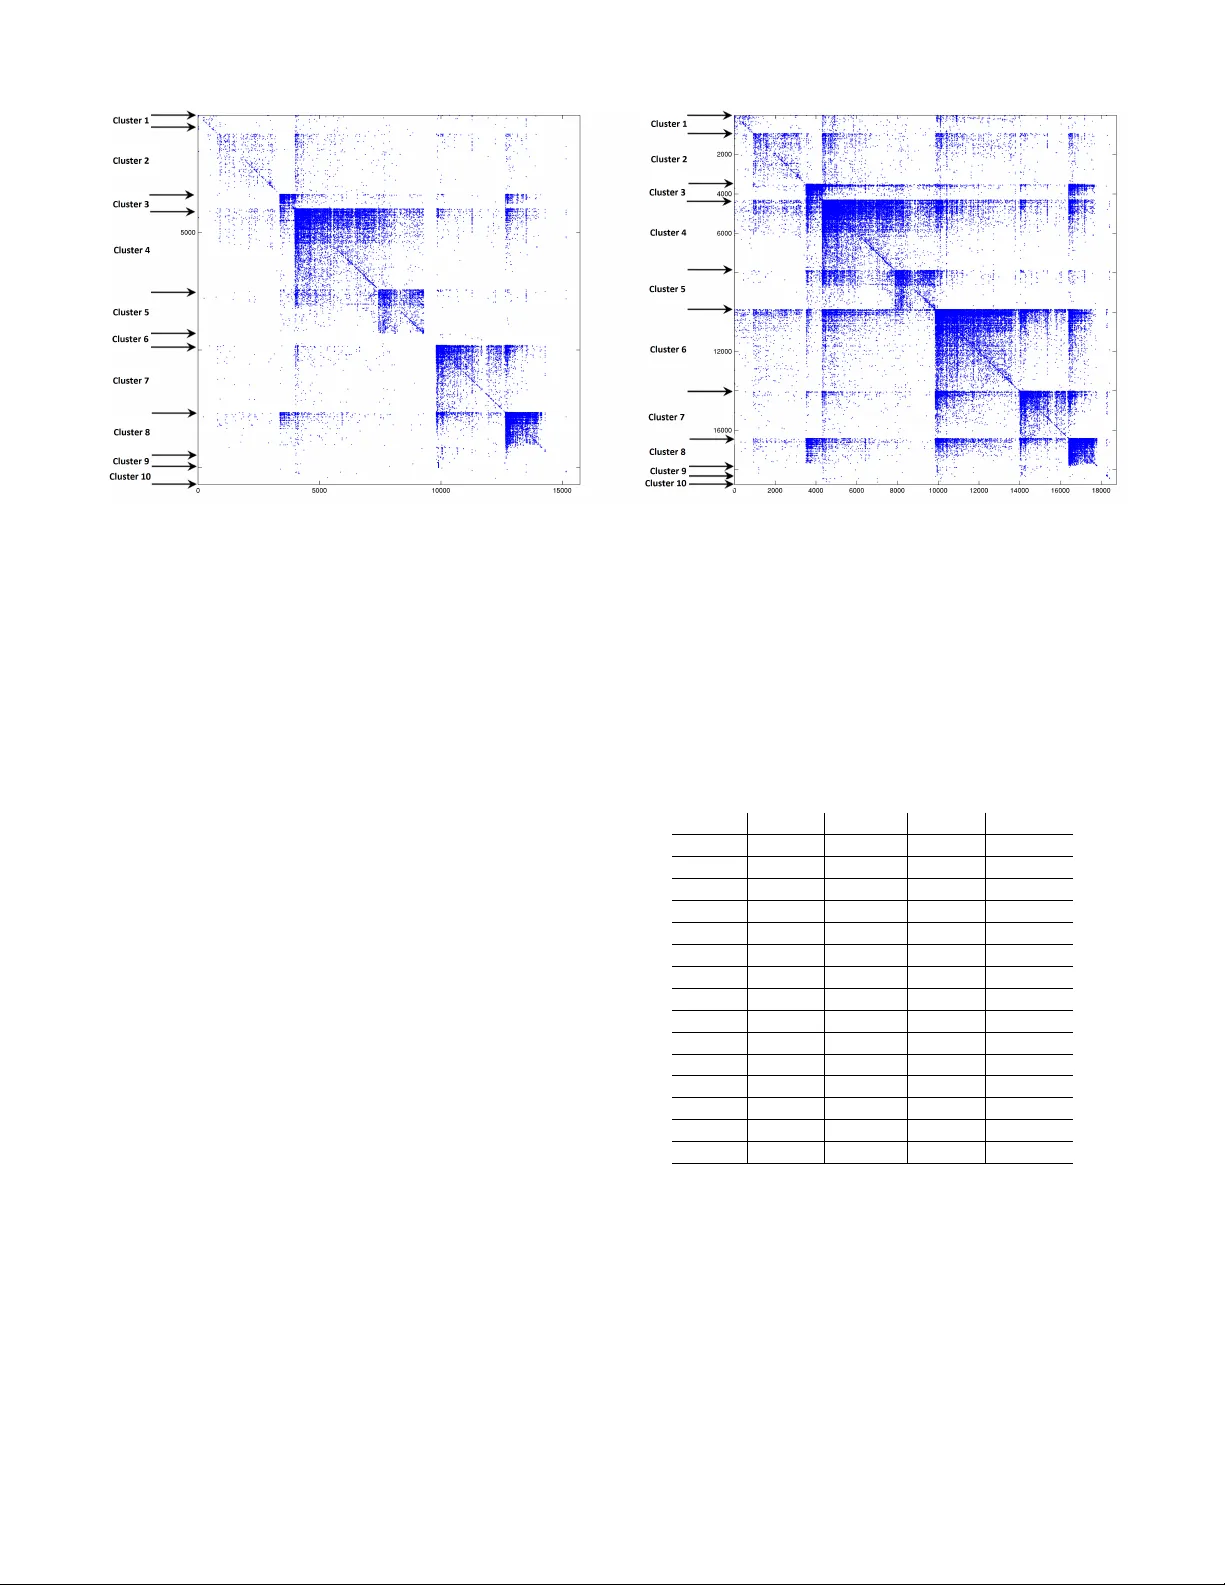
Scalable Modeling of Con ver sational-r ole based Self-presentation Characteristics in Large Online Forums Abhimanu K umar School of Computer Science Carnegie Mellon University abhimank@cs.cm u.edu Shriphani P alakodety School of Computer Science Carnegie Mellon University shriphanip@gmail.com Chong W ang School of Computer Science Carnegie Mellon University chongw@cs.cm u.edu Carolyn P . Rose School of Computer Science Carnegie Mellon University cprose@cs.cm u.edu Eric P . Xing School of Computer Science Carnegie Mellon University epxing@cs.cm u.edu Miaomiao Wen School of Computer Science Carnegie Mellon University mwen@cs .cmu.edu ABSTRA CT Online discussion forums are complex webs of o verlapping sub- communities (macrole vel structure, across threads) in which users enact different roles depending on which subcommunity they are participating in within a particular time point (microlevel struc- ture, within threads). This sub-network structure is implicit in massiv e collections of threads. T o uncov er this structure, we de- velop a scalable algorithm based on stochastic variational inference and le verage topic models (LD A) along with mixed membership stochastic block (MMSB) models. W e ev aluate our model on three large-scale datasets, Cancer-ThreadStarter (22K users and 14.4K threads), Cancer-NameMention(15.1K users and 12.4K threads) and StackOverFlo w (1.19 million users and 4.55 million threads). Qualitativ ely , we demonstrate that our model can pro vide useful explanations of microle vel and macrole vel user presentation charac- teristics in dif ferent communities using the topics discov ered from posts. Quantitativ ely , we show that our model does better than MMSB and LD A in predicting user reply structure within threads. In addition, we demonstrate via synthetic data experiments that the proposed acti ve sub-netw ork discov ery model is stable and re- cov ers the original parameters of the e xperimental setup with high probability . 1. INTR ODUCTION Online forums are a microcosm of communities where users’ presentation characteristics v ary across dif ferent re gions of the fo- rum. Users participate in a discussion or group acti vity by posting on a related thread. During his stay on a forum, a user partici- pates in many different discussions and posts on multiple threads. The thread le vel presentation characteristics of a user are dif ferent than the global presentation characteristics. A participating user gears his responses to suit specific discussions on dif ferent threads. These thread based interactions gi ve rise to activ e sub-networks, within the global netw ork of users, that characterize the dynamics of Permission to make digital or hard copies of all or part of this work for personal or classroom use is granted without fee provided that copies are not made or distributed for profit or commercial advantage and that copies bear this notice and the full citation on the first page. T o copy otherwise, to republish, to post on servers or to redistribute to lists, requires prior specific permission and/or a fee. Copyright 20XX A CM X-XXXXX-XX-X/XX/XX ...$15.00. interaction. Overlaying dif ferential changes in user interaction char- acteristics across these sub-networks provides insights into users’ macroscopic (forum-wide) as well as microscopic (thread specific) participation behavior . Analysing online social networks and user forums have been approached using various perspecti ves such as network [15, 14] , probabilistic graphical models [1], combined network & text [7, 12]. Howe v er none of these have taken into account the dynamics of sub-networks and the related thread-based framew ork within which forum discussions take place. Whereas activ e sub-network mod- elling has been very useful to the research in computational biology in recent years where it’ s been used to model sub-networks of gene interactions [3, 11], very fe w approaches using acti v e sub-network hav e been proposed to model online user interactions. T aking into account sub-network interaction dynamics is important to correctly model the user participant beha vior . For example, users post their responses on discussion threads after reading through responses of other users in the threads. The users possibly post multiple times on the thread as a form of reply to other posts in the thread. For analysing such interactions it becomes imperativ e that the structure of the con versation must also be taken into account besides the user interaction network and the text posted. This enables us to gain deeper insights into user behavior in the online community that was not possible earlier . One of the main challenges of this work has been the ability to model acti ve sub-netw orks in a lar ge forum with millions of users and threads. A social network spanning around millions of users and threads would be an ideal case to demonstrate the effecti veness of sub-network modelling. T o efficiently scale our model, we deriv e a scalable inference based on stochastic variational inference (SVI) with sub-sampling [9] that has the capacity to deal with such massi ve scale data and parameter space. The scalability of the SVI with sub- sampling is further boosted by employing Poisson distribution to model edge weights of the network. A Poisson based scheme need not model zero edges ([10]), where as MMSB style approaches [1] must explicitly model them. A further set of parallelization in inner optimization loops of local variational parameters pushes the learning speed even more. This work is to date the lar gest modelling of any social graph that also takes user contents into account. Contributions. • This work provides no vel insights into ho w users’ self- repre- sentational characteristics v ary depending on the discussion they are in. This is achiev ed via active sub-network modelling. • Our model outperforms LD A and MMSB in link prediction across three datasets demonstrating the lev erage it gains by combining the two along with discussion structures in mod- elling sub-networks. • It is highly scalable and is able to achieve con ver gence in mat- ter of hours for users and threads that are an order of a million despite the time complexity of O (users × users × threads). • Stability is another aspect of the proposed new approach and is demonstrated by the model recov ering back its parameters in synthetic experiments. 2. USER R OLE MODELLING Online forums hav e a specific discussion structure that provides a lot of conte xt to all the interactions occurring among the users. Here we describe a typical forum discussion scenario. 2.1 Discussion structure in online f orums When two users interact in a thread or through a post they play certain con versational roles and project their specific identity . It is valuable to know what conv ersational roles each plays (which topic or community they each belong to) in that interaction. When a user u is representing community c out of all the communities that he is part of and participates in a discussion, he tailors his post content accordingly to suit the e xplicit or implicit community and discussion norms. Kno wing the style of community specific text content pro vides a lot of information about that community in general. It also provides information about what role user u plays when he is in community c and engaged in a specific discussion thread t . In online forums multi-user interactions occur a lot i.e. in a thread a user can post by addressing another specific user but he is also addressing other users in the thread explicitly or implicitly (via either gearing his replies to address other users’ concerns into consideration or addressing them directly in the post). Modeling this phenomenon would bring the model closer to realities of online discussions. This can be modelled by aggregating users posts across a thread, though not across the whole of the forum. W e will elaborate on this more in the generativ e story of our model. 2.2 Graphical model & generative story Based on the description abov e our graphical model is designed as shown in Figure 1. In this model we aggregate the posts of a giv en user in a given thread t into one document which has token set N t,p . This helps us incorporate the kno wledge that a user’ s post is influenced by the posts of other users present on the thread, assuming that he reads at least some of them. The generativ e process for the model is as follo ws: • For each user p , – Draw a K dimensional mix ed membership vector → π p ∼ Dirichlet( α ). • for each topic pair g and h , – Draw B ( g , h ) ∼ Gamma ( κ, η ) ; where κ, η are param- eters of the gamma distribution. • For each pair of users ( p, q ) and each thread t , – Draw membership indicator for the initiator , → z ( p → q,t ) ∼ Multinomial( π p ). – Draw membership indicator for the receiv er , → z ( p ← q,t ) ∼ Multinomial( π q ). Z p ! q Z q ! p Y p ! q Z 0 W N T P U T U ˇ B ˘ q ˘ p ˛ ✓ ⌘ k ⇥ k k Figure 1: The proposed approach models acti ve sub-network of users in the forum. U si the total number of user in all of the forum, T si the number of threads. N T p is the total number of tokens user p posted in thread t . – Sample the value of their interaction, Y ( p, q , t ) ∼ Pois- son( → z > ( p → q,t ) B → z ( p ← q,t ) ). • For each user p ∈ t , – Form the set δ t,p that contains all the users that p inter - acts to on thread t , ∗ For each word w ∈ N t,p , ∗ Draw z 0 t,p,w from D irichlet ( P ∀ q ∈ δ t,p z ( t,p → q ) ) . ∗ Draw w ∼ φ ( w | β , z 0 t,p,w ) . The use of Poisson distribution for Y ( p, q , t ) ∼ Poisson( → z > ( p → q,t ) B → z ( p ← q,t ) ) (the network edge between the user’ s p and q ) besides modelling non-binary edge strength enables the model to ignore non-edges between users ( Y t,p,q ) and thus achiev e faster con v ergence [10]. In MMSB style community block models, non-edges are to be modelled explicitly . log L = log P ( Y , W, Z ← , Z → , Π , B , β | α, η , θ , α ) . (1) The log-likelihood of the model described in 2.2 is giv en abov e and deriv ed in detail in the appendix 14. q = Y p q (Π q | γ p ) Y t Y p,q q ( Z t,p → q , Z t,p ← q | φ t,p,q ) · Y p ∈ t N T p Y i =1 q ( Z 0 t,p,i | χ t,p,i ) · Y g,h q ( B g,h | ν g,h λ g,h ) Y k q ( β k | τ k ) . (2) W e use variational approximation to maximize log-lik elihood. Equa- tion 2 abov e is the approximation of the log-likelihood and we use structured mean field [18] to maximize parameters of q . The local variational parameters, φ (MMSB parameters) and χ (LD A) param- eters, are maximized using equations 3 and 4 where ∆ φ 0 t,p,g,h and ∆ χ 0 t,p,g,h are defined by equations 19 and 20 respectively . φ t,p,g,h ∝ e ∆ φ 0 t,p,g,h . (3) χ t,p,i,k ∝ e ∆ χ 0 t,p,g,h . (4) 0 20 40 60 0 0.5 1 1.5 2 2.5 3 3.5 4 x 10 5 Time in minutes Negative Log Likelihood PSSV SSV SV V 0 20 40 60 4.5 5 5.5 6 6.5 7 7.5 8 x 10 4 Time in minutes Negative Log Likelihood PSSV SSV SV V Figure 2: The log-likelihood vs incremental speed optimization routine. The right hand plot is a zoomed in version of the left. PSSV (Parallel Sub-sampled Stochastic V ariational), SSV(Sub- sampled Stochastic V ariational), SV(Stochastic V ariational) and V(V ariational). Each addition of optimization increases the speed by sev eral orders of magnitude. The final PSSV is 4 times faster than (V)ariational and achiev es better log-likelihood too. The traditional v ariational updates for global parameters γ , ν , λ (MMSB) and τ (LD A) are defined using equations 22, 23, 24 and 25 respectiv ely (details are in the appendix). T erminology. There is a difference to be made between community-topic, word topic and user roles. Community topic is the π vector that we get from the model (figure 1) that decides the membership proportion of a user in different latent communities. W ord topic is the β vector of word topic proportions from the LD A component of the model, figure 1. There is a one to one correspondence between β and π vectors as seen in figure 1. β helps us in identifying what contents users are generally interested in in a giv en latent community . A user role is a specific configuration of π . It can be just the case that a role ’ r ’ might be the π vector where r -th coordinate is 1 and all else are 0 out of the total K coordinates, i.e. it predominantly relates to that r -th latent community . 3. SCALABLE ESTIMA TION The global update equations in previous sections are computa- tionally very expensiv e and slow as we need to sum o ver all the updated local variables. U users with T threads and vocab ulary size V leads to O ( U 2 T + U V T ) local variables. T raditional sampling or variational estimation techniques would be quite slow for such a model. In order to obtain faster con v ergence we make use of stochastic variational approximation along with sub-sampling and parallelization. The updates in case of SVI with sub-sampling follo w a two step procedure. Step one computes a local update for the global variables based on the sub-sampled updated local variables. The local updates ( γ 0 , ν 0 , λ 0 and τ 0 ) for the global variables ( γ , ν , λ and τ ) are γ 0 p,k = α k + N T 2 | S p | X q ∈ S p X h φ t,p,q,k ,h + N T 2 | S p | X q ∈ S p X g φ t,q,p,g ,k . (5) Input : Y , W, P , α, θ , κ, η Initialize : γ ← γ 0 , τ ← τ 0 , ν ← ν 0 , λ ← λ 0 while not con ver ged do for c pr ocessors in parallel do pick a set of threads T for eac h t ∈ T do pick a node p , ∀ q ∈ neig hbor hood δ t,p while φ & χ not con ver ged do get new φ t,p → q , φ t,p ← q , φ t,q → p , φ t,q ← p and χ t,p,i ∀ i ∈ N t,p iterate between φ and χ using equations 3 and 4 end end end aggregate φ and χ obtained from different processors. get local update γ 0 , τ 0 , ν 0 , λ 0 via stochastic approximation of equations 22,25,23,24. get global updates of γ , τ , ν , λ ; e.g. γ t +1 = (1 − step ) γ t + ( step ) γ 0 Similarly globally update τ , ν, λ as above using equation 9. end Algorithm 1: PSSV : Parallel Sub-sampling based Stochastic V ari- ational inference for the proposed model ν 0 g,h = ν t g,h + ρ ν N T 2 | S p | X q ∈ S p dL ∂ ν g,h . (6) λ 0 g,h = P t P p,q φ t,p,q,g ,h y t,p,q + κ g,h P t P p,q φ t,p,q,g ,h + 1 θ g,h ν g,h . (7) τ 0 p,v = ν v + N T 2 | S p | N t,p X w t,p,i = v χ t,p,i,k . (8) where S p is a set of neighborhood edges of user p , and N and T are total number of edges and threads respectiv ely in the network. The set S p is chosen amongst the neighbors of p by sampling equal no. zero and non-zero edges. In step two of the sub-sampled SVI the final update of global variable is computed by the weighted av erage of the local updates of the global variable and the variables v alue in the pre vious iteration: µ t +1 = (1 − ξ t ) µ t + ξ t µ 0 . (9) where µ represents any global v ariable from λ, ν, γ , τ . ξ t is chosen appropriately using SGD literature and is decreasing. ξ t is standard stochastic gradient descent rate at iteration t , also expressed as ξ t = 1 ( t + ζ ) ρ [6]. ζ and ρ are set as 1024 and 0.5 respectively for all our experiments in the paper , and t is the iteration number . W e achie ve further speed by parallelizing the text ( χ ) and network ( φ ) local v ariational updates. This is achiev able as the dependency between phi and χ parameters (defined in equations 20 and 19) allows us to parallelize their v ariational updates. Algorithm ?? de- scribes the parallelized SVI with sub-sampling updates for the local parameters. Figure 2 sho ws a plot of ho w the final (p)arallel (s)ub- sampling based (s)tochastic (v)ariational (PSSV) inference is faster than each of its individual components. SO dataset described in sec- tion 4 is used as the data for this experiment. The number of parallel cores used in the PSSV scheme is four whereas its one for the rest of the three. The amount of sub-sampled forum threads is 400 and the total number of threads is 14,416. All the schemes in the graph start users threads posts edges TS 22,095 14,416 1,109,125 287,808 UM 15,111 12,440 381,199 177,336 SO 1,135,996 4,552,367 9,230,127 9,185,650 T able 1: Dataset statistics. SO mostly has edges with weight one. 1 2 3 4 5 6 7 8 9 10 11 0 1 2 3 4 5 6 7 8 9 10 x 10 6 Edge weights Number of edges UM TS SO 1 2 3 4 5 6 7 8 9 10 11 0 0.5 1 1.5 2 x 10 5 Edge weights Number of edges UM TS SO Figure 3: Distribution of dif ferent edge weights o ver the 3 datasets. SO predominantly consists of edges with weight one. Right hand plot is a scaled version of the left. The label ’11’ contains edge weights of 11 and abov e. with the same initialization v alues of the hyper-parameters. PSSV is atleast twice as fast as the nearest scheme besides obtaining the best log-likelihood of all the four at the point of conv ergence. The SV (stochastic v ariational) samples one thread at a time and therefore takes some time in the be ginning to start minimizing the objecti v e value (ne gati ve log likelihood). The objective v alue increases in the first few iterations for SV . The number of iterations to be done by SV is very large but each iterations takes the smallest time of all four . The V (variational) scheme takes the least number of iterations to con ver ge though its iterations are the most time consuming as it has to go through all the 14,416 threads in ev ery iteration. System details. The machine used in all the experiments in this paper is “Intel(R) Xeon(R) CPU E5-2450 0 @ 2.10GHz” 16 corewith 8GBs of RAM per core. The operating system is Linux 2.6.32 x86_64. 4. D A T ASETS W e analyse three real world datasets corresponding to two dif- ferent forums: 1) Cancer-ThreadStarter , 2) Cancer-UserName, and 3) Stack Overflo w . T o test the stability of the model we use a synthetically generated dataset. The Cancer forum 1 is a self-help community where users who either have cancer , are concerned they may hav e cancer , or care for others who ha ve cancer , come to dis- cuss their concerns and get advice and support. StackOverflo w is an online forum for question answering primarily related to computer science. W e use the latest dump of Stack Overflo w 2 . In each of 1 http://community.breastcancer.org 2 http://www.clearbits.net/torrents/ 2141- jun- 2013 0 50 100 150 200 250 300 0 2 4 6 8 10 12 14 16 18 x 10 5 Time in minutes Negative Log Likelihood SO TS UM Figure 4: The log-likelihood over heldout set for the fully tuned model on the 3 datsets these datasets a user posts multiple times in a thread and all these posts are aggregated into one bigger posts per thread as defined in section 2.2. Number of times a user u replies to user v in thread T is the edge weight of edge u → v in thread T . T able ?? giv es the distributions of edges, posts, users and threads in the three datasets used. 4.1 Cancer -Thr eadStarter (TS) In the Cancer forum, the con versations happen in a structured way where users post their responses on a thread by thread basis. Every thread has a thread starter that posts the first message and starts the con versation. W e construct a graph from each thread by drawing a link from each participant on the thread to the participant who started the thread This graph has 22,095 users and 14,416 Threads. 4.2 Cancer -User name Mention (UM) Users call each other by their usernames (or handle assigned to them in the forum) while posting in many cases. W e create a graph where in an edge between user u and user v in thread t means that user u calls user v by username in thread t . This graph has 15,111 users and 12,440 threads. 4.3 Stack Overflow (SO) In Stack Overflo w users ask questions and then other users reply with their answers. W e obtain the ThreadStarter graph from this structure. This dataset has hav e 1,135,996 users and 4,552,367 threads. 4.4 Synthetic data W e generate a synthetic dataset using the generativ e process defined in section 2.2. W e hav e 1000 users and 100 threads. The number of posts and edges v ary depending on the choice of priors α and η 5. EXPERIMENT AL SETUP AND EV ALU- A TION W e di vide each dataset into three subsets: 1) the training set, 2) the heldout set, and 3) the test set. W e learn our model on training set and tune our priors ( α, η , κ, θ etc.) on heldout set. The split is done over the edges where 80% of the edges are in training and rest 20% are divided amongst heldout and test equally . For the α ω θ κ η K TS 0.05 1e-4 2.5 ∼ 1.5 2.5 ∼ 1.5 0.05 10 UM 0.05 1e-3 2.0 ∼ 1.0 2.0 ∼ 1.0 0.05 10 SO 0.05 1e-2 1.0 ∼ 0.5 1.0 ∼ 0.5 0.05 20 T able 2: Tuned values for the parameters. θ and κ are matrices and a ∼ b assigned to them means diagonal values are a and non- diagonals are b . K is the number of topics two cancer datasets we only predict non-zero edge weights whereas for the Stack Overflo w we predict zero as well as non-zero edge weights. Graph 3 sho ws the distribution of edge weights in cancer and Stack Overflow dataset. W e chose Stack Overflow to predict zero weights since it has large number of edges with very low weights, predominantly weight one. Predicting zero as well as non- zero edge weights demonstrates that the model is versatile and can predict a wide range of edge-weights. In addition to 20% of the total non-zero edges we randomly sample equal number of zero edges from the graph for the SO held and test set. The optimization objectiv e for learning is defined in equation 18. A link prediction task is incorporated to demonstrate the model’ s effecti v eness. It is a standard task in the area of graph clustering and social networks in particular . Researchers have used it in the past to demonstrate their model’ s learning ability [12]. The link prediction task works as an important validation of our model. If the proposed model performs better than its individual parts then it can be safely concluded that it extracts important patterns from each of its building blocks. Moreov er it adds validity to the qualitative analysis of the results. Link-pr ediction. W e predict the edge-weight of the edges present in the test set. The predicted edge, ˆ Y t,u,v , between users u and v in thread t is defined as ˆ Y t,u,v = π T u B π v . (10) B = ν . ∗ λ (11) and the prediction error is the r mse , defined as gi v en predicted edge ˆ Y t,u,v and the actual edge Y t,u,v , r mse = q X ( ˆ Y t,u,v − Y t,u,v ) 2 . (12) The summation is over the edges in the test (or heldout) set. The block matrix B described in equation 11 is well defined for both MMSB and the proposed model. Hence the prediction is obtained for the active network modelling without LD A (just MMSB com- ponent) and with LDA. W e created an artificial weighted Identity matrix for LD A ˆ B = m ∗ I . It is a diagonal matrix with all element values m . For e very user u and ev ery thread t the topics discovered ov er the posts of u in t is used as the vector π u in equation 10 for prediction. A diagonal B is desirable in block models as it provides clean separation among the clusters obtained [1]. The value of m is tuned over heldout set. W e define a basic baseline that always predicts the av erage weight ( ¯ Y ) all the edges, zero (Stack Overflo w) or non-zero (Cancer), in the heldout or test set. r mse baseline = q X ( ¯ Y − Y t,u,v ) 2 . (13) 10 20 3040 50 60 70 8090 0 0.5 1 1.5 2 2.5 x 10 7 Number of local topic variations Percentage amount of variation UM TS SO 10 20 3040 50 60 70 80 90 0 0.5 1 1.5 2 2.5 3 3.5 4 x 10 6 Number of local topic variations Percentage amount of variation UM TS SO Figure 5: Number of local variations in topic proportion on a per user per thread le vel. The axis is percentage variation (from 10 to 90 percent). The right hand plot is a scaled in version of the left. UM held UM test TS held TS test SO held SO test Our Model 1.303 1.292 2.782 2.748 0.348 0.361 MMSB 1.450 1.502 2.984 2.881 0.421 0.434 LD A 1.793 1.731 3.725 3.762 0.466 0.479 Baseline 1.886 1.983 4.504 4.417 0.502 0.509 T able 3: Link prediction results ov er the 3 datsets P arameter tuning. W e tune our parameters η , κ, θ , α , and K (number of community- topics) over the held set. ω , the parameter to balance the contribution of the te xt side to the network side is tuned o v er the heldout set. It is used in the local variational update of φ (equation 19). Equation 19 contains a summation term ov er all the tokens P N T p i =1 χ i in the per user per thread document and if not balanced by ω will dominate the rest of the terms. The constant used in equation 19 and 20 is a smoothing constant and is fix ed at a lo w v alue. The six quantities, α, ω , θ , k appa, η and K are tuned in that sequence. α is tuned first keeping rest constant then ω and so on where each next to be tuned parameter uses values of already tuned parameters. T able ?? shows the final values of all the parameters. Figure 4 shows plot of tuned log-likelihood ov er the 3 datasets against time. UM being the smallest of the two takes the least amount of time. 6. RESUL TS Link pr ediction. T able 3 sho ws the link prediction results on heldout and test set for the for the four prediction model. The proposed approach to model thread le vel conv ersational roles outperforms all of the other models. LD A performs poorer than MMSB since LD A does not explicitly model netw ork information. Cancer dataset. Figure 5 shows the number of times the global role of a user is Figure 6: Adjacency matrix of users sorted by clusters. Left side is clustered by MMSB and right side is clustered by our model using user’ s dominant role as cluster index over TS dataset. Our model is able to correctly cluster 3K additional users that MMSB doesnt assign any dominant cluster (or role) and discov ers a new role (Cluster -6). different from the thread le v el role that he plays. It is interesting to see that the variation between global and thread level role assignment is high among all the datasets. A model that ignores this local vs global dynamics tends to lose a lot of information. Figure 6 shows the plot of the user by user adjacenc y matrix for TS dataset. The users are sorted based on the community-topic cluster (roles) assigned by the respecti ve models (our model and MMSB model). The number of community-topics are 10 and ev ery user is assigned the dominant community-topic, π , (role) that the y hav e more than 50% of chance of lying in. A user is discarded if he doesn’t have the said dominant role. Our model is unable to assign a clear role to 3.3K users and the MMSB approximately to 6.3K users out of 22K. Based on the topics assigned, users are sorted and their adjacency matrix sho ws clean clustering along the block diagonals. As seen in the figure, the combined model is able to ef fecti vely find the primary roles (dominant topic) for the e xtra 3K users that the MMSB model was unable to provide for . Besides a new role (Role 6) that is not accounted for by MMSB is discovered by the proposed model (figure 6). Users that predominantly have role 6 on a global scale tend to vary their roles often on a thread lev el, i.e. their topic probabilities change quite often. The average change in topic probabilities per role per user -thread pair across the 10 roles discov ered in TS is 30.6%; for role 6 it is 41.5% (highest of all the roles). This means that this role is very dynamic and an acti ve sub-network modelling helps here as it captures the dynamism of this entity . From figure 6 cluster of roles 4, 5, 6, 7 and 8 are the largest. T able 4 corresponds to top 15 words corresponding to these roles. Role 4, role 7 and role 8 are related to discussion regarding cancer where as role 5 is related to con versations re garding spiritual and family matters. But role 6 does not seem to be related to any specific type of con v ersation. It is free flowing and has lots of non specific words which tells us that there is a cornucopia of discussions happening in this role with no specific matter at hand. This fact is also verified by looking at the ra w Cancer forum data. Users who are predominantly in this role tend to post across man y discussion threads and v ariety of con versation topics. This role is detected by our model due to the fact that it takes into account the dynamics of such a role. T opic 4 T opic 5 T opic 6 T opic 7 T opic 8 side same their sur geon radiat test life live ev eri anoth took tell happi found doctor away mani mayb down problem left famili sorri alw ay pleas support prayer best while person doesn though check home kind seem ladi ne ws bodi soon mov e until question these each almost wish dure bone hard scan someon deal mean might idea under case came medic studi felt mind posit herceptin guess where seem drug share diseas nurs haven send free T able 4: top 15 words for topics corresponding to top 5 biggest role in TS. Figure 7: The 20 roles assigned to users in the stack ov erflo w dataset. The numbers at the verte x are the role numbers. Due to the large number of roles we visualize them 5 at a time with first 5 first then second 5 and so on. W e can see that the roles are separated cleanly and clustered around the pentagon corners. 0 0.05 0.1 0.15 0.2 0.25 0.3 0.35 0.4 0.45 0.5 0.2 0.3 0.4 0.5 0.6 0.7 0.8 0.9 1 RMSE− α RMSE− η Figure 8: RMSE vs α and η for the synthetic dataset. The X-axis is α or η values and the Y -axis is the RMSE of the recovered π . Stack Overflow. The optimal topic number for SO dataset is 20 community-topics as noted in table ?? and the number of users are 1.13 million. It is difficult to visualize the user-user adjacenc y matrix of this size. The 20 topic set is divided into four sets with size 5 each. T opics 1 to 5 form set one, topics 6 to 10 form set two and so on. Every user’ s role is visualized by projecting user’ s π ov er a pentagon as shown in figure 7. The projection uses both position and color to show v alues of community-topic π for each user . Every user u is displayed as a circle (v ertex) v u in the figure where the size of the circle is the node degree of v u and position of v u is equal to a conv ex combination of the fiv e pentagon corner coordinates ( x, y ) that are weighted by the elements of π u . Hence circles v u at the pentagon’ s corners represent π ’ s that have a dominating community in the 5 community-topics chosen, while circles on the lines connecting the corners represent π ’ s with mixed-membership in at least 2 communities (as only a partial π vector is used in each sub-graph). All other circles represent π ’ s with mixed-membership in ≥ 3 communities. Each circle v u ’ s color is also a π -weighted conv ex combination of the RGB values of 5 colors: blue, green, red, cyan and purple. This color coding helps distinguish between v ertices with 2 v ersus 3 or more communities. W e observ e a big black circle at the back ground of e very plot. This circle represents the user with id 22656 3 that has 3 http://stackoverflow.com/users/22656/ jon- skeet T opic 1 T opic 2 T opic 3 T opic 4 T opic 5 T opic 6 public code function that name array valu should also view method more chang your then thread time what when user object into document system ev ent properti creat control line about would blockquot follow current element sure list just form link dif fer post databas field implement oper would each there class valu question defin imag issu overrid server length file class path main veri creat result paramet display result string each where applic like size start result more just order import jav a blog kno w local sav e project android featur bro wser specif T able 5: top 15 words for w ord topics corresponding to first 6 role clusters in SO. the highest node-degree of 25,220 in the SO dataset. This user has the highest all time reputation on stack ov erflow and tends to take part in myriads of question answering threads. Hence he is rightly picked up by the model to be in the middle of all the roles. Figure 7 has a clean clustering where the nodes are clustered around the pentagon vertices. This indicates that the model is able to find primary roles for most of the users in the forum. Though table 5 shows that there is significant amount of variation with respect to the global role of a user at a thread le vel. Modeling this variation helps our model in getting better clusters as compared to simple MMSB; this fact is apparent from the link prediction task too, table 3. W e get an rmse of 0.348 on heldout and 0.361 on test set which is better than all the other 3 approaches. T able 5 sho ws the top 15 words corresponding to first 6 roles discov ered in SO. While roles 1, 2, 3 are pertinent to discussions regarding database con versations, general coding, android and J2EE, role 4 relates to online blogs and bro wsing apis. Role 5 and role 6 are related to server/client side browser based coding and general coding respectiv ely . Do demonstrate the effecti v eness of our model on this dataset, we take the example of user 20860. User id 20860 is globally assigned role 1 as the dominant role b ut he also takes part in coding related discussions. For e xample, • Because the join() method is in the string class, instead of the list class? I agr ee it looks funny . • The simplest solution is to use shell_exec() to run the mysql client with the SQL script as input. This might run a little slower because it has to fork, but you can write the code in a couple of minutes and then get back to working on something useful. Writing a PHP script to run any SQL script could tak e you weeks. . . . But in most of the cases he visits general software or coding questions that are specifically related to databases and this fact is picked up by our model and it assigns him predominantly (>0.8) a database role ev en though he is active contributor to general software and coding discussions. MMSB on the other hand assins him 30% database (role 1) 30% general coding (role 2) and rest is distributed among the remaining 18 roles. The model picks up other similar cases for which it is able to successfully distinguish (compared to MMSB) between user’ s global and local roles ev en though they are dynamic in nature. Synthetic dataset. Figure 8 gives the rmse of the model for the recovery of com- munity topic π ov er the synthetic dataset. From the graph, higher values of the parameters make it harder to reco ver the pi values. For this experiment we fix topic number at 5 and vary α or η by fixing the other at 0.01. The other priors such as κ, θ , ω etc. are fixed at the values used to generate the dataset. It is apparent that the rmse is more sensitive to wards α values and reco vers them well compared to η . The results are averaged ov er 20 random runs of the experiment for the gi v en v alues of α and η . The rmse achie ved for lower values of priors α and η is very promising as it means that the confidence interval of the estimate is very high for sparse priors for this model giv en suf ficient data. 7. RELA TED WORK White et al.[17] proposed a mixed-membership model that ob- tained membership probabilities for discussion-forum users for each statistic (in- and out-degrees, initiation rate and reciprocity) in vari - ous profiles and clustered the users into “extreme profiles” for user role-identification and clustering based on roles in online commu- nities,. Ho et al. [7] presented T opicBlock that combines text and network data for b uilding a taxonomy for a corpus. The LDA model and MMSB models were combined by Nallapati et al. [12] using the Pairwise-Link-LD A and Link-PLSA-LD A models where doc- uments are assigned membership probabilities into bins obtained by topic-models. Sachan et al. [13] provide a model for community discov ery that combines network edges with hashtags and other heterogeneous data and use it to discover communities in twitter and Enron email dataset. For simultaneously modeling topics in bilingual-corpora, Smet et al. [16] proposed the Bi-LD A model that generates topics from the target languages for paired documents in these very languages. The end-goal of their approach is to classify any document into one of the obtained set of topics. F or modeling the behavioral aspects of entities and discov ering communities in social networks, se veral game-theoretic approaches have been proposed (Chen et al. [2], Y adati and Narayanam [19]). Zhu et al. [20] combine MMSB and text for link prediction and scale it to 44K links. Ho et al. [8] provide unique triangulated sampling schemes for scaling mixed membership stochastic block models [1] to the order of hundreds of thousands of users. Prem et al. [6] use stochastic variational inference coupled with sub-sampling techniques to scale MMSB like models to hundreds of thousands of users. None of the works abov e address the sub-network dynamics of thread based discussion in online forums. Our work is unique in this context and tries to bring user role modelling in online social networks closer to the ground realities of online forum interactions. Activ e sub-network modelling has been used recently to model gene interaction networks [11]. They combine gene expression data with network topology to provide bio-molecular sub-networks, though their approach is not scalable as the y use simple EM for their inference. W e lev erage the scalable aspects of SVI [9] to combine MMSB (network topology) with LD A (post contents) in a specific graphical structure (thread structure in the forum) to obtain a highly scalable activ e sub-network disco very model. Matrix factorization and spectral lea rning based approaches are some of the other popular schemes for modelling user networks and content. In recent past both approaches hav e been made scalable to a million order node size graph [5, 4]. But these methods are unable to incorporate the rich structure that a probabilistic modelling based method can take into account. For example modelling activ e sub- networks besides incorporating content as well as network graph will be very hard to achiev e in matrix factorization or spectral clustering paradigm. 8. DISCUSSION AND FUTURE WORK The proposed model relies on the fact that forum users hav e dynamic role assignments in online discussions and lev eraging this fact helps to increase prediction performance as well as understand the forum acti vity . The model performs very well in its prediction tasks. It outperforms all the other methods over all the datsets by a huge margin. The model is scalable and is able to run on social network dataset of unprecedented content size. There is no past research work that scales forum contents to more than one million user and around 10 million posts. The idea that active subnetwork is useful in modelling online forums is demonstrated qualitativ ely and quantitativ ely . Quantita- tiv ely it provides better prediction performance and qualitati vely it captures the dynamics of user roles in forums. This dynamism can help us find new cluster roles that may hav e been missed by state of the art clustering approaches, as we observed for TS dataset. From the synthetic experiments it is observ ed that the model reco vers its parameters with high likelihood with sparse priors. This works to its advantage for scalable learning as big data sets tend to be sparse. The scalability aspects of the inference scheme proposed here are worth noting. Besides the multi-core and stochastic sub-sampling components of the proposed inference, the use of Poisson to model the edge weights has enabled us to ignore zero-edges if need be. This reduces the amount of work needed for learning the network parameters. The learned network is at par with the state of the art inference schemes as demonstrated in the prediction tasks. One aspect to explore in future is to combine multiple types of links in network. For example in man y online forums users explic- itly friend other users, follow other users or are members of same forum related sub-groups as other users. All these relations can be modelled as a graph. It is worth finding out how important is mod- elling activ e sub-network in such a case. It is possible that various types of links might reinforce each other in learning the parameters and thus will obviate the need to model a computationally costly sub-network aspect. As we saw in figure 8 that sparsity helps, but how sparser can we get before we start getting poor results needs some exploration. As we have seen, figure 8, that the model recovers the community- topic parameters with very high lik elihood for lo wer values of model priors α and τ . If this is a general attribute of active sub-network models then it can be lev eraged for sparse learning. Moreover , al- though in case of large online forums modelling acti ve sub-networks is computationally challenging and costly , the sparsity aspects of activ e sub-networks might help reduce the computation costs. 9. REFERENCES [1] Edoardo M. Airoldi, David M. Blei, Stephen E. Fienberg, and Eric P . Xing. Mixed membership stochastic blockmodels. J . Mach. Learn. Res. , 9:1981–2014, June 2008. [2] W ei Chen, Zhenming Liu, Xiaorui Sun, and Y ajun W ang. A game-theoretic frame work to identify ov erlapping communities in social networks. Data Min. Knowl. Discov . , 21(2):224–240, September 2010. [3] Raamesh Deshpande, Shikha Sharma, Catherine M. V erfaillie, W ei-Shou Hu, and Chad L. Myers. A scalable approach for discov ering conserved acti ve subnetw orks across species. PLoS Computational Biology , 6(12), 2010. [4] Inderjit Dhillon, Y uqiang Guan, and Brian Kulis. A fast kernel-based multile vel algorithm for graph clustering. In Pr oceedings of the ele venth A CM SIGKDD international confer ence on Knowledge discovery in data mining , KDD ’05, pages 629–634, New Y ork, NY , USA, 2005. ACM. [5] Rainer Gemulla, Erik Nijkamp, Peter J. Haas, and Y annis Sismanis. Large-scale matrix f actorization with distributed stochastic gradient descent. In Pr oceedings of the 17th A CM SIGKDD international confer ence on Knowledge discovery and data mining , KDD ’11, pages 69–77, New Y ork, NY , USA, 2011. A CM. [6] Prem Gopalan, David M. Mimno, Sean Gerrish, Michael J. Freedman, and David M. Blei. Scalable inference of ov erlapping communities. In Peter L. Bartlett, Fernando C. N. Pereira, Christopher J. C. Burges, Léon Bottou, and Kilian Q. W einberger , editors, NIPS , pages 2258–2266, 2012. [7] Qirong Ho, Jacob Eisenstein, and Eric P . Xing. Document hierarchies from text and links. In Pr oceedings of the 21st international confer ence on W orld W ide W eb , WWW ’12, pages 739–748, New Y ork, NY , USA, 2012. ACM. [8] Qirong Ho, Junming Y in, and Eric P . Xing. On triangular versus edge representations — to wards scalable modeling of networks. In Peter L. Bartlett, Fernando C. N. Pereira, Christopher J. C. Burges, Léon Bottou, and Kilian Q. W einberger , editors, NIPS , pages 2141–2149, 2012. [9] Matthew D. Hof fman, Da vid M. Blei, Chong W ang, and John Paisle y . Stochastic variational inference. J . Mach. Learn. Res. , 14(1):1303–1347, May 2013. [10] Brian Karrer and M. E. J. Newman. Stochastic blockmodels and community structure in networks. CoRR , abs/1008.3926, 2010. [11] Ilana Lichtenstein, Michael Charleston, Tiberio Caetano, Jennifer Gamble, and Mathew V adas. Activ e Subnetwork Recov ery with a Mechanism-Dependent Scoring Function; with application to Angiogenesis and Organogenesis studies. BMC Bioinformatics , 14(1):59+, 2013. [12] Ramesh M. Nallapati, Amr Ahmed, Eric P . Xing, and W illiam W . Cohen. Joint latent topic models for text and citations. In Pr oceedings of the 14th A CM SIGKDD international confer ence on Knowledge discovery and data mining , KDD ’08, pages 542–550, New Y ork, NY , USA, 2008. A CM. [13] Mrinmaya Sachan, Danish Contractor, T anv eer A. Faruquie, and L. V enkata Subramaniam. Using content and interactions for discov ering communities in social networks. In Pr oceedings of the 21st international confer ence on W orld W ide W eb , WWW ’12, pages 331–340, New Y ork, NY , USA, 2012. A CM. [14] Jianbo Shi. Learning segmentation by random walks. In In Advances in Neural Information Pr ocessing , pages 470–477. MIT Press, 2000. [15] Jianbo Shi and Jitendra Malik. Normalized cuts and image segmentation. IEEE T rans. P attern Anal. Mach. Intell. , 22(8):888–905, August 2000. [16] Wim De Smet, Jie T ang, and Marie-Francine Moens. Knowledge transfer across multilingual corpora via latent topics. In Pr oceedings of the 15th P acific-Asia conference on Advances in knowledge discovery and data mining - V olume P art I , P AKDD’11, pages 549–560, Berlin, Heidelberg, 2011. Springer-V erlag. [17] Arthur White, Jeffrey Chan, Conor Hayes, and Brendan Murphy . Mixed membership models for exploring user roles in online fora, 2012. [18] Eric P . Xing, Michael I. Jordan, and Stuart J. Russell. A generalized mean field algorithm for variational inference in exponential families. CoRR , abs/1212.2512, 2012. [19] Narahari Y adati and Ramasuri Narayanam. Game theoretic models for social network analysis. In Pr oceedings of the 20th international confer ence companion on W orld wide web , WWW ’11, pages 291–292, New Y ork, NY , USA, 2011. A CM. [20] Y . Zhu, X. Y an, L. Getoor, and C. Moore. Scalable T ext and Link Analysis with Mixed-T opic Link Models. ArXiv e-prints , March 2013. APPENDIX The log-likelihood of the model: log L = log P ( Y , W, Z ← , Z → , Π , B , β | α, η , θ , α ) = X t X p,q log P ( Y t,p,q | Z t,p → q , Z t,p ← q , B ) + X p,q log P ( Z t,p → q | Π q ) + X p,q log P ( Z t,p ← q | Π q ) + X p log P (Π p | α ) + T X t =1 X p ∈ t N T p X i =1 log P ( w t,p,i | Z 0 t,p,i , β ) + T X t =1 X p ∈ t X i =1 N T p log P ( Z 0 t,p,i | ¯ Z t,p → q ) + X k log P ( β k | η ) + X g,h log P ( B g,h | κ, θ ) . (14) The data likelihood for the model in figure 1 P ( Y , R p | α, β , κ, η ) = Z Φ Z Π X z P ( Y , R p ,z p → q , z p ← q , Φ , Π | α, β , κ, η ) = Z Φ Z Π X z Y p,q Y t P ( Y t pq | z t p → q , z t p ← q , B ) · P ( z t p → q | Π p ) · P ( z t p ← q | Π q ) · Y p P (Π p | α ) Y t Y p P ( R t p | z t p → q , Φ) · Y k P (Φ k | β ) · Y g,h P ( B gh | η , κ ) . (15) The complete log likelihood of the model is: log P ( Y , W, z → , z ← , Φ , Π , B | κ, η , β , α ) = X t X p,q log P ( Y t pq | z t p → q , z t p ← q , B ) + X t X p,q (log P ( z t p → q | Π p ) + log P ( z t p ← q | Π p )) + X p log P (Π p | α ) + X t X p X w ∈ R t p log P ( w | z p → , Φ) + X k log P (Φ k | β ) + X gh log P ( B gh | η , κ ) . (16) The mean field variational approximation for the posterior is q ( z , Φ , Π , B | ∆ z → , ∆ Φ , ∆ B , ∆ z ← , ∆ B κ ) = Y t Y p,q q 1 ( z t p → q | ∆ z p → q ) + q 1 ( z t p ← q | ∆ z p ← q ) · Y p q 4 (Π p | ∆ Π p ) Y k q 3 (Φ k | ∆ Φ k ) Y g,h q ( B g,h | ∆ B η , ∆ B κ ) . (17) The lo wer bound for the data log-likelihood from jensen’ s in- equality is: L ∆ = E q log P ( Y , W, z → , z ← , Φ , Π , B | κ, η , β , α ) − log q = E q " X t X p,q log B Y t p,q g,h e − B gh Y t pq ! + X t X pq log Y k ( π z p → q = k p,k ) ! + X t X p,q log Y k ( π q,k ) z p ← q = k ! + X t X p X w ∈ R t p log Y u ∈ V ( ¯ z T φ u ) w = u ! + X p log Y k (Π p,k ) α k − 1 · Γ( P α k ) Q k Γ( α k ) ! + X k log Y u ∈ V ( φ k,u ) β k − 1 · Γ( P β k ) Q k Γ( β k ) ! + X g,h log B κ − 1 g,h /η κ Γ( κ ) · exp( − B g,h /η ) # − E q " X t X p,q log Y k (∆ z p → q ,k ) z p → q = k + X t X p,q log Y k (∆ z p ← q ,k ) z p ← q = k ! + X log Y k (Π p,k ) ∆ π pk − 1 Γ(∆ Π p ) Q k =1 Γ(∆ Π p,k ) ! + X k log Y u ∈ v (Φ k,u ) ∆ Φ ku − 1) Γ(∆ Φ k ) Q u ∈ v Γ(∆ Φ k,u ) ! + X g,h log B ∆ κ =1 g,h ∆ ∆ κ η Γ(∆ κ ) exp( − B g,h / ∆ η ) ! # . (18) ∆ φ used in the update of φ in equation 3. The parameter ω is used here to balance out the contribution from the text side to the network. ∆ φ 0 t,p,g,h = y t,p,q (log λ g,h + Ψ( ν g,h )) − ν g,h λ g,h − log ( y t,p,q !) + Ψ( γ p,g ) − Ψ( X g γ p,g ) + Ψ( γ q,h ) − Ψ( X h γ q,h ) + ω N T P X i =1 χ t,p,i,g ln δ p,t − 1 δ t,p + ln 1 + δ p,t · 1 δ t,p . (19) ∆ χ used in equation 4 for χ update ∆ χ 0 t,p,g,h = Ψ( τ k,w t,p,i ) − Ψ( X w t,p,i τ k,w t,p,i ) + ln ( δ p, t ) 1 − P q,h φ t,p,q,k ,j δ t,p + P q,h φ t,p,q,k ,h δ t,p ln (1 + δ t,p ) . (20) Partial deri v ati ve of ν dL ∂ ν g,h = X t X p,q φ t,p,q,g ,h ( y t,p,q Ψ 0 ( ν g,h ) − λ g,h ) + ( κ g,h − ν g,h )Ψ 0 ( ν g,h ) + 1 − λ g,h θ g,h . (21) The traditional variational updates for the global parameters γ p,k = α k + X t X q X h φ t,p,q,k ,h + X t X q X g φ t,q,p,g ,k . (22) ν t +1 g,h = ν t g,h + ρ ν dL ∂ ν g,h . (23) λ g,h = P t P p,q φ t,p,q,g ,h y t,p,q + κ g,h P t P p,q φ t,p,q,g ,h + 1 θ g,h ν g,h . (24) τ p,v = ν v + X t X p ∈ t N t,p X w t,p,i = v χ t,p,i,k . (25) where ρ ν is ν ’ s gradient ascent update step-size using its partial deriv ati v e dL ∂ ν g,h define in equation 21.
Original Paper
Loading high-quality paper...
Comments & Academic Discussion
Loading comments...
Leave a Comment