Stochastic modelling, Bayesian inference, and new in vivo measurements elucidate the debated mtDNA bottleneck mechanism
Dangerous damage to mitochondrial DNA (mtDNA) can be ameliorated during mammalian development through a highly debated mechanism called the mtDNA bottleneck. Uncertainty surrounding this process limits our ability to address inherited mtDNA diseases.…
Authors: Iain G. Johnston, Joerg P. Burgstaller, Vitezslav Havlicek
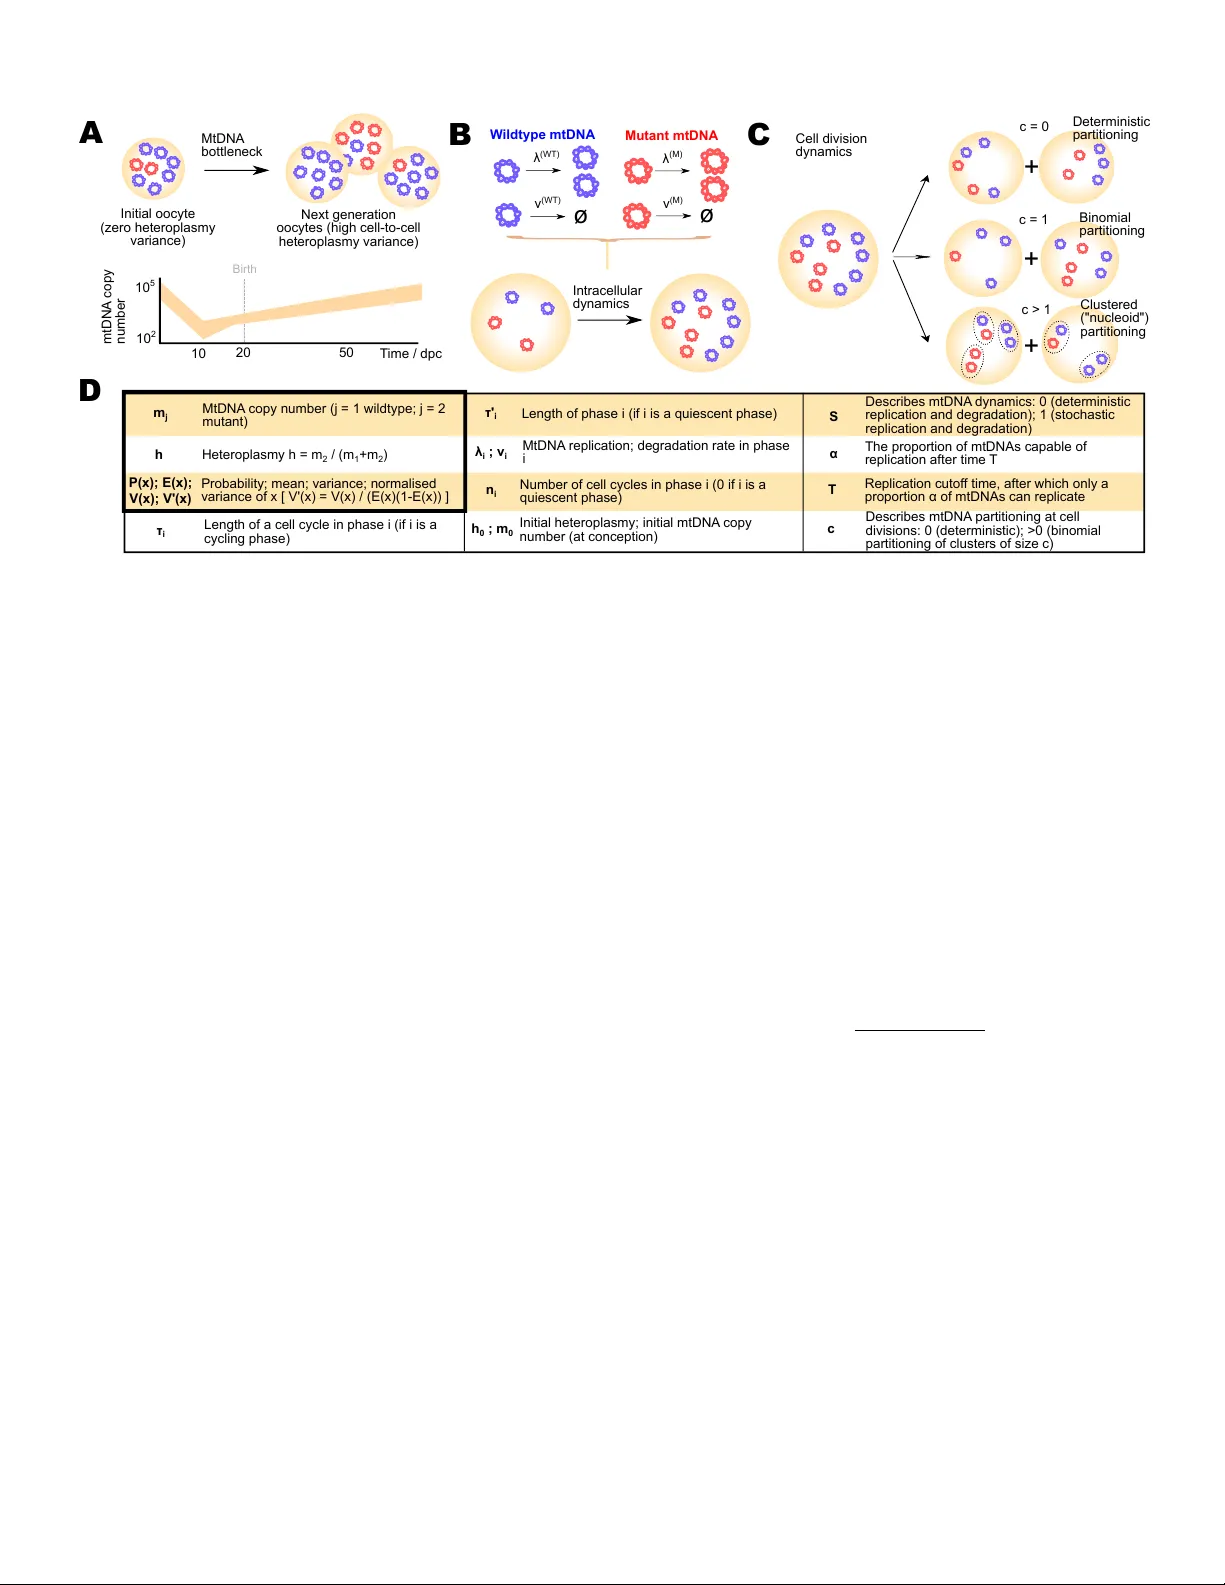
Sto c hastic mo delling, Ba y esian inference, and new in viv o measuremen ts elucidate the debated m tDNA b ottlenec k mec hanism Iain G. Johnston 1 , Jo erg P . Burgstaller 2,3 , Vitezsla v Havlicek 4 , Thomas Kolb e 5,6 , Thomas R ¨ ulic ke 7 , Gottfried Brem 2,3 , Jo P oulton 8 , and Nic k S. Jones 1 1 Department of Mathematics, Imperial College London, UK 2 Biotechnology in Animal Production, Departmen t for Agrobiotechnology , IF A T ulln, 3430 T ulln, Austria 3 Institute of Animal Breeding and Genetics, Universit y of V eterinary Medicine Vienna, V eterin¨ arplatz 1, 1210 Vienna, Austria 4 Reproduction Cen tre Wieselburg, Department for Biomedical Sciences, Universit y of V eterinary Medicine, Vienna, Austria 5 Biomodels Austria, Universit y of V eterinary Medicine Vienna, V eterinaerplatz 1, 1210 Vienna, Austria 6 IF A-T ulln, Univ ersity of Natural Resources and Life Sciences, Konrad Lorenz Strasse 20, 3430 T ulln, Austria 7 Institute of Lab oratory Animal Science, Univ ersity of V eterinary Medicine Vienna, V eterin¨ arplatz 1, 1210 Vienna, Austria 8 Nuffield Department of Obstetrics and Gynaecology , Univ ersity of Oxford, UK Abstract Dangerous damage to mito c hondrial DNA (m tDNA) can b e ameliorated during mammalian dev elopment through a highly debated mec hanism called the mtDNA bottleneck. Uncer- tain ty surrounding this pro cess limits our ability to address inherited mtDNA diseases. W e pro duce a new, physically motiv ated, generalisable theoretical mo del for mtDNA p opu- lations during developmen t, allowing the first statistical com- parison of prop osed b ottlenec k mechanisms. Using approx- imate Bay esian computation and mouse data, we find most statistical supp ort for a combination of binomial partitioning of mtDNAs at cell divisions and random mtDNA turnov er, meaning that the debated exact magnitude of mtDNA cop y n umber depletion is flexible. New exp erimen tal measure- men ts from a wild-deriv ed mtDNA pairing in mice confirm the theoretical predictions of this mo del. W e analytically solv e a mathematical description of this mec hanism, comput- ing probabilities of m tDNA disease onset, efficacy of clinical sampling strategies, and effects of p otential dynamic in ter- v entions, thus developing a quantitativ e and exp erimen tally- supp orted sto c hastic theory of the b ottleneck. Mito c hondria are vital energy-pro ducing organelles within euk aryotic cells, p ossessing genomes (mitochondrial DNA or m tDNA) that replicate, degrade and develop m utations [1, 2]. MtDNA m utations ha ve b een implicated in n umerous pathologies including fatal inherited diseases and ageing [3, 4, 5, 1]. Combatting the buildup of mtDNA m utations is of paramoun t imp ortance in ensuring an organism’s surviv al. Substan tial recen t medical, experimental and media attention fo cused on metho ds to remo ve [6] or preven t the inheritance of [7, 8, 5, 9, 10] mutated mtDNA in h umans. One means by whic h organisms may ameliorate the mtDNA damage that builds up through a lifetime is through a devel- opmen tal pro cess known as b ottlene cking . Immediately after fertilisation, a single oo cyte (whic h may contain > 10 5 indi- vidual m tDNAs) may hav e a nonzero m tDNA mutan t load or heter oplasmy (the prop ortion of mutan t mtDNA in the cell). As the num b er of cells in the dev eloping organism in- creases, the in tercellular population will then acquire an asso- ciated heter oplasmy varianc e , that is, the v ariance in mutan t load across the p opulation of cells (Fig. 1A), allo wing re- mo v al of cells with high heteroplasmy and reten tion of cells with low heteroplasmy . In tense and sustained debate exists as to the mechanism by which this increase of heteroplasm y v ariance o ccurs. Several exp erimental results in mice sug- gest that, during developmen t, the copy n umber of mtDNA p er cell in the germ cell line drops dramatically to ∼ 10 2 , re- ducing the effectiv e p opulation size of mitochondrial genomes [11, 12]. One postulated bottlenecking mec hanism is that this lo w population size accelerates genetic drift and so increases the cell-to-cell heteroplasmy v ariance [11, 13, 14, 15], which w as first observed to generally increase from primordial germ cells through primary o o cytes to mature o o cytes [16]. How- ev er, indep endent exp erimen tal evidence [12] suggests that heteroplasm y v ariance increases negligibly during this copy n umber reduction, though this interpretation has b een de- bated [17]. Ref. [12] shows heteroplasm y v ariance rising dur- ing folliculogenesis, after the mtDNA copy num b er minimum has b een passed. In yet another picture, supp orted by con- flicting exp erimental results [18, 19], heteroplasm y v ariance increases with a less pronounced decrease in m tDNA copy n umber (a m inim um copy num b er > 10 3 in mice), solely through random effects asso ciated with partitioning at cell divisions. Clearly a consensus on this imp ortan t mechanism is yet to b e reac hed. Imp ortan t existing theoretical work on modelling the b ot- tlenec k has assumed a particular underlying mec hanism [13, 20] or derived statistics of m tDNA populations [21, 14, 22, 23] without explicitly considering changing mtDNA p opulation size, or the discrete nature of the mtDNA p opulation: effects whic h may p o w erfully affect m tDNA statistics. T o capture these effects it is necessary to employ a ‘b ottom-up’ physical description of mtDNA as p opulations of individual, discrete elemen ts sub ject to replication and degradation, as in, for ex- ample, Refs. [21] and [24]. Exploring the b ottlenec k also re- quires explicitly mo delling partitioning dynamics throughout 1 a series of cell divisions, o ver whic h p opulation size can change dramatically . While previous simulation work [11, 25] has tak en suc h a philosophy with sp ecific mo del assumptions, we are not aw are of such a study allowing for the wide v ariety of replication and partitioning dynamics prop osed in the litera- ture; we further not th at replication-degradation-partitioning m tDNA mo dels are yet to be fully described analytically . Nor is there a general quantitativ e framework under whic h dif- feren t prop osed bottleneck mechanisms can b e statistically compared given extant data (although statistical analyses fo- cusing on particular mec hanisms and individual sets of exper- imen tal results hav e b een used throughout the literature, for example, using a Ba yesian approach under a particular b ot- tlenec k mo del to infer mo del b ottlenec k size [26]). Combined dev elopments in theory and inference are therefore required to make progress on this imp ortan t question. W e remedy this situation b y constructing a general mo del (features and parameters describ ed in Fig. 1) for the p opu- lation dynamics of the b ottlenec k, able to describ e the range of prop osed mechanisms existing in the literature. Using ex- p erimen tal data on mtDNA statistics through developmen t [16, 11, 12, 18], w e use approximate Ba yesian computation [27, 28, 29, 30] to rigorously explore the statistical support for eac h mechanism, sho wing that random m tDNA turno ver cou- pled with binomial partitioning of mtDNAs at cell divisions is highly lik ely , and that the debated magnitude of mtDNA cop y n umber reduction is somewhat flexible. Subsequently , w e confirm the predictions of this mo del b y p erforming new exp erimen tal measurements of heteroplasmy statistics in mice with an mtDNA admixture, including a wild-derived haplo- t yp e, that is genetically distinct from previous studies. W e then analytically solve the equations describing mtDNA p op- ulation dynamics under this mechanism and show that these results allow us to inv estigate p oten tial interv entions to mo d- ulate the bottleneck (suggesting that upregulation of m tDNA degradation may increase the pow er of the b ottlenec k to a void inherited disease; we discuss p otential strategies for such an in terven tion) and yield quan titative results for clinical ques- tions including the timescales and probabilities of disease on- set, and the efficacy of strategies to sample heteroplasmy in clinical planning. Results A general mathematical mo del encompassing prop osed b ottlenec king mechanisms W e will consider three different classes of prop osed generat- ing mechanisms for the mtDNA mec hanisms: namely , those prop osed in Cree et al. [11]; Cao et al. [18] and W ai et al. [12]. W e will refer to these mechanisms by their leading au- thor name. The Cree mechanism inv olves random replication and degradation of mtDNAs throughout developmen t, and binomial partitioning of mtDNAs at cell divisions. The Cao mec hanism in v olves partitioning of clusters of mtDNA at each cell division, th us providing strong stochastic effects associ- ated with eac h division. W e consider a general set of dynamics through which this cluster inheritance may b e manifest, in- cluding the possibility of heteroplasmic ‘n ucleoids’ of constan t in ternal structure [31], sets of molecules or nucleoids within an organelle, homoplasmic clusters, and differen t possible cluster sizes (see Supplemen tary Information). The W ai mechanism in volv es the replication of a subset of mtDNAs during follicu- logenesis. W e note that this latter mec hanism can b e mani- fest in sev eral wa ys: (a) through slow random replication of m tDNAs (so that, in any given time windo w, only a subset of m tDNAs will be actively replicating) or (b) through the restriction of replication to a sp ecific subset of mtDNAs at some p oint during developmen t. W e will refer to these differ- en t manifestations as W ai (a) and W ai (b) resp ectively . The W ai (a) mechanism and the Cree mo del can both b e addressed in the same mechanistic framework (with potentially differ- en t parameterisations): if the rate of random replication in the Cree mo del is sufficien tly low during folliculogenesis, only a subset of mtDNAs will b e activ ely replicating at any given time during this p eriod, thus recapitulating the W ai (a) mec h- anism (see Supplementary Information). W e will henceforth com bine discussion of the W ai (a) and Cree mechanisms into what we term the birth-death-partition (BDP) mechanism. W e seek a physically motiv ated mathematical mo del for the bottleneck that is capable of repro ducing each of these mec hanisms. Our general mo del for the b ottlenec k (detailed description in Methods) inv olves a ‘b ottom-up’ representa- tion of mtDNAs as individual intracellular elemen ts capa- ble of replication and degradation (Fig. 1B) with rates λ and ν resp ectiv ely . A parameter S determines whether these pro cesses are deterministic (sp ecific rates of proliferation) or sto c hastic (replication and degradation of each mtDNA is a random even t). These rates of replication and degrada- tion of mtDNA are lik ely strongly linked to mito chondrial dynamics within cells, through the action of mito chondrial qualit y control [32, 33] mo dulated by mito c hondrial fission and fusion [34, 35, 36], whic h can act to recycle weakly- p erfoming mito chondria [37, 38]. This qualit y control can b e represen ted through the degradation rates assigned to each m tDNA sp ecies, which may differ (for selectiv e quality con- trol) or b e iden tical (for non-selective turnov er). The prop ortion of mtDNAs capable of replication is con- trolled by a parameter α in our mo del, dictating the pro- p ortion of m tDNAs that may replicate after a cutoff time T . Th us, if α = 1, all mtDNAs may replicate; if α < 1, replica- tion of a subset prop ortion α of m tDNAs is enforced at this cutoff time. At cell divisions, m tDNAs ma y b e partitioned either deterministically , binomially , or in clusters according to a parameter c (Fig. 1C). The copy num b er of mtDNA p er cell is observed to v ary dramatically during developmen t, with dynamic phases of cop y num b er depletion and different rates of subsequent re- co very observed. Additionally , cell divisions o ccur in the germline at differen t rates during dev elopment, with cells b ecoming largely quiescent after primary o ocytes develop. T o explicitly mo del these different dynamic regimes, and the behaviour of mtDNA cop y num b er during eac h, we in- clude six different dynamic phases throughout developmen t, 2 MtDNA copy numbe r (j = 1 wild type; j = 2 mutant) Heterop lasmy h = m 2 / (m 1 +m 2 ) Prob ability; mea n; variance ; normal ised varian ce of x [ V'(x) = V(x) / (E(x) (1-E (x)) ] Length of phase i (if i is a quiescen t phase) MtDNA replica tion; degra dation ra te in phase i Length of a cell cycle in phase i (i f i is a cycling pha se) Describ es mtDNA dynamics: 0 (d etermi nistic repli cation and de grada tion); 1 (stocha stic repli cation and de grada tion) Numbe r of cell cycles in ph ase i (0 if i is a quiescen t phase) Describ es mtDNA partitioni ng at cell division s: 0 (determ inistic); >0 (b inomi al partition ing of clusters of size c) Initial heter oplasm y; initial mtDNA copy numbe r (at concep tion) The pro portion of mtDNAs capab le of repli cation after time T m j h P(x) ; E( x); V(x) ; V'( x) τ i n i c h 0 ; m 0 S λ i ; ν i τ ' i α ø ø λ (WT) ν (WT) ν (M) λ (M) Initial oocyte (zero heteropl asmy varian ce) + + + } Intracellu lar dynami cs Cell divi sion dynami cs W ildtype mtDN A Muta nt mtDNA MtDNA bottleneck T im e / dpc mtDNA copy numbe r 10 5 10 2 Next gener ation oocytes (hig h cell-to- cell heterop lasmy var iance) A B C D c = 0 c = 1 c > 1 10 20 50 T Replica tion cutof f time, after which only a propo rtion α of mtDNA s can repli cate Determ inistic partition ing Binom ial partition ing Clustere d ("nucl eoid") partition ing Birth Figure 1: The mitochondrial b ottlenec k, and elements of a general mo del for b ottlenec king mechanisms. (A) The mtDNA bottleneck acts to pro duce a p opulation of o ocytes with v arying heteroplasmies from a single initial o ocyte with a sp ecific heteroplasmy v alue. During developmen t, mtDNA copy num b er p er cell decreases (by a debated amount, which we address; see Main T ext) then recov ers, suggesting a ‘b ottlenec k’ of cellular mtDNA p opulations. (B) Cellular mtDNA p opulations during the bottleneck are mo delled as containing wildtype and mutan t mtDNAs. MtDNAs can replicate and degrade within a cell cycle, with rates λ and ν resp ectiv ely . (C) At cell divisions, the m tDNA population is partitioned b et ween tw o daughter cells either deterministically , binomially , or through the binomial partitioning of mtDNA clusters. (D) Symbols used to represent quantities and mo del parameters used in the main text, and their biological interpretations. eac h with different rates of replication and degradation (la- b elled with subscript i lab elling the dynamic phase: hence λ 1 , ν 1 , ..., λ 6 , ν 6 ), and allo wing for different rates of cell di- vision or quiescence. This protocol enables us to explicitly mo del effects of changing p opulation size throughout dev el- opmen t rather than assuming dep endence on a single, coarse- grained effectiv e p opulation size; and to include the effects of sp ecific and v arying cell doubling times. A summary of sym b ols used in our mo del and throughout this article is pre- sen ted in Fig. 1D. Our mo del, with suitable parameterisation, can th us mirror the dynamics of the Cree and W ai (a) mec hanisms (sto chas- tic dynamics and binomial partitioning, which we refer to as the BDP mec hanism); the Cao mechanism (clustered parti- tioning); and W ai (b) mechanism (deterministic dynamics, restricted subset of replicating mtDNAs). The Cao mech- anism, partitioning of clusters of mtDNA molecules, repre- sen ts the expected case if mtDNA is partitioned in colo calised ‘n ucleoids’ within each organelle (or in other sub-organellar groupings). The size of mtDNA nucleoids is debated in the literature [1, 39, 40] (although recent evidence from high- resolution microscopy suggests that nucleoid size is gener- ally < 2 [41], consonant with recent evidence that individual n ucleoids may b e homoplasmic [42]); our mo del allows for inheritance of homoplasmic or heteroplasmic nucleoids of ar- bitrary characteristic size c , thus allowing for a range of sub- organellar m tDNA structure. W e discuss the impact of mixed or fixed nucleoid conten t in the Supplemen tary Information. A birth-death-partition mo del of m tDNA dy- namics has most statistical supp ort given ex- p erimen tal measurements W e take data on mtDNA cop y num b er in germ line cells in mice from three recent exp erimen tal studies [11, 18, 12]. W e also use data from tw o exp erimen tal studies on heteroplasm y v ariance in the mouse germ line during developmen t [16, 12]. This data, by con ven tion [17], is normalised by heteroplasmy lev el h , giving V 0 ( h ) = V ( h ) E ( h )(1 − E ( h )) , (1) where normalised v ariance V 0 ( h ) is a quan tity that will b e often used subsequen tly . This normalised v ariance controls for the effect of different or c hanging mean heteroplasmy , and th us allows a comparison of heteroplasm y v ariance among samples with different mean heteroplasmies and sub ject to heteroplasm y change with time. W e use a time of 100 dp c to corresp ond to mature o ocytes (see Metho ds). These hetero- plasm y v ariance studies employ intracellular combinations of the same pairing of mtDNA haplotypes (NZB and BALB/c), mo delling tw o differen t m tDNA types within a cellular p op- ulation. W e take data on cell doubling times from a classical study [43] (see Metho ds). A p ossible summary of these data (although they pro vok e ongoing debate; see Discussion) is that, as shown in Fig. 2A, the existing data on normalised heteroplasm y v ariance sho ws initially lo w v ariance until ∼ 7 . 5 dp c (days p ost conception, whic h we use as a unit of time throughout), rising to intermediate v alues betw een 7 . 5 and 21 dp c, gradually rising further subsequen tly to b ecome large 3 A 70 V'(h ) T im e / dpc 100 1000 10000 100000 E(m ) BDP analytic BDP nume ric Cao alon e W ai ( b) alon e Cree da ta Cao data W ai da ta Jenuth data 0 0.02 0.04 0.06 0 10 20 30 40 50 60 50000 100000 500000 * 0 0.05 0.1 0.15 0 0.2 0.4 0.6 0.8 1 Cao alon e W ai ( b) alon e BDP Posteri or pro babili ty P(M | ε ) Mechan ism M ε ₁ ε ₂ ε ₃ ε ₄ B Figure 2: Differen t mechanisms for the mtDNA bottleneck. (A) T ra jectories of mean copy num b er E ( m ) and normalised hetero- plasmy v ariance V ( h ) arising from the models described in the text, optimised with resp ect to data from exp erimen tal studies. BDP denotes the birth-death-partition model, encompassing Cree and W ai (a) mecha- nisms. Left plots show tra jectories during dev elopment; righ t plots sho w behaviour in mature o ocytes in the next generation. * denotes measure- ments in mature o ocytes, modelled as 100 dp c (see Methods). (B) Statis- tical supp ort for different mechanisms from approximate Bay esian com- putation (ABC) mo del selection with thresholds 1 , 2 , 3 , 4 = 75 , 60 , 50 , 45. As the threshold decreases, forcing a stricter agreement with experi- ment (thinner, darker columns), supp ort conv erges on the birth-death- partitioning (BDP) mo del. in the mature oo cytes of the next generation. In Fig. 2A, and throughout this article, experimentally measured data will be depicted as circular p oin ts and inferred theoretical b ehaviour will b e depicted as lines or shaded regions. Fig. 2A shows m tDNA p opulation dynamic tra jectories re- sulting from optimised parameterisations of each of the mec h- anisms we consider (see Metho ds). In Fig 2B we show p oste- rior probabilities on each of these mec hanisms. These p oste- rior probabilities give the inferred statistical supp ort for each mec hanism, derived from mo del selection p erformed with ap- pro ximate Bay esian computation (ABC) [27, 28, 29, 30] us- ing uniform priors. ABC in volv es choosing a threshold v alue dictating how close a fit to exp erimen tal data is required to accept a particular mo del parameterisation as reasonable. In our case, this go odness-of-fit is computed using a com- parison of squared residuals asso ciated with the tra jecto- ries of mean mtDNA copy num b er and normalised hetero- plasm y v ariance (see Methods and Supplementary Informa- tion). Eac h of the exp erimen tal measuremen ts corresp onds to a sample v ariance, derived from a finite n umber of samples of an underlying distribution of heteroplasmies, and there- fore has an asso ciated uncertain ty and sampling error [14]. The reasonably small sample sizes used in these sample v ari- ance measurements are likely to underestimate the underly- ing heteroplasmy v ariance (the target of our inference). Our ABC approac h naturally addresses these uncertainties by us- ing summary statistics deriv ed from sampling a set of sto chas- tic incarnations of a given mo del, where the size of this set is equal to the n umber of measurements con tributing to the exp erimen tally-determined statistic (see Metho ds). Fig. 2B clearly shows that as the ABC threshold is decreased, re- quiring closer agreemen t b etw een the distributions of simu- lated and exp erimen tal data, the p osterior probabilit y of the BDP mo del increases, to dramatically exceed those of the other mo dels. This increase indicates that the BDP model is the most statistically supp orted, and capable of pro vid- ing the b est explanation of exp erimental data (which can b e in utitively seen from the tra jectories in Fig. 2A). W e note that ABC mo del selection automatically takes mo del com- plexit y into account, and conclude that the BDP mechanism is the best supp orted prop osed mec hanism for the bottleneck. Briefly , this result arises b ecause the BDP mo del pro duces in- creasing v ariance b oth due to early cell division sto c hasticity and later random turnov er. By con trast, the Cao mo del alone only increases v ariance in early developmen t when cell divi- sions are o ccurring. Qualitatively , this b eha viour through time holds regardless of cluster (n ucleoid) size and regard- less of whether clusters are heteroplasmic or homoplasmic (allo wing heteroplasmic clusters decreases the magnitude of heteroplasm y v ariance but not its b eha viour through time, see Supplementary Information). The W ai (b) mo del alone similarly only increases v ariance at a single time p oin t (later, during folliculogenesis). In Ref. [12], visualisations of cells after BrU incorp ora- tion show that a subset of mito c hondria retain BrU lab elling, whic h the authors suggest indicates that a subset of mtD- NAs are replicating. In the Supplemen tary Information, we 4 sho w that the BDP mo del also results in the observ ation of only a subset of replicating mtDNAs o ver the timeframe cor- resp onding to thes e exp erimen tal results. These observ ations th us corresp ond to results exp ected from the random turno ver from the BDP mo del. W e also note the mathematical obser- v ation that the W ai (b) mec hanism requires the replication of < 1% of mtDNAs during folliculogenesis to yield reason- able heteroplasmy v ariance increases (Fig. 2A shows the op- timal case with α = 0 . 006; optimal fits to data generally sho w 0 . 005 < α < 0 . 01), and the prop ortions of lo ci visible in Ref. [12] are substantially higher than this required 1% v alue. W e sho w in the Supplementary Information that the het- eroplasm y statistics corresp onding to binomial partitioning also describ e the case where the elemen ts of inheritance are heteroplasmic clusters, where the mtDNA conten t of eac h cluster is randomly sampled from the p opulation of the cell (either once, as an initial step, or repeatedly at each division). This similarity holds broadly , regardless of whether the inter- nal structure of clusters is constan t across cell divisions or allo wed to mix b et ween divisions. The BDP mo del, in ad- dition to describing the partitioning of individual mtDNAs, also thus represents the statistics of mtDNA p opulations in whic h heteroplasmic nucleoids are inherited [31], or individ- ual organelles con taining a mixed set of m tDNAs or nucleoids are inherited, regardless of the size of these n ucleoids (see Dis- cussion). P arameterisation and interpretation of the birth-death-partition mo del Ha ving used ABC mo del selection to identify the BDP mo del as the most statistically supp orted, we can also use ABC to in- fer the v alues of the gov erning parameters of this model given exp erimen tal data. Figs. A and B shows the tra jectories of mean cop y n umber and mean heteroplasm y v ariance resulting from model parameterisations iden tified through this pro cess. Fig. C sho ws the inferred b eha viour of mtDNA degradation rate ν in the mo del, a proxy for m tDNA turnov er (as the cop y n umber is constrained). T urnov er is generally low dur- ing cell divisions, allowing heteroplasm y v ariance to increase due to stochastic partitioning. T urnov er then increases later in germ line developmen t, resulting in a gradual increase of heteroplasm y v ariance after birth un til the mature o ocytes form in the next generation. Fig. D sho ws p osterior distributions on the copy num b er minim um and total turnov er (see Metho ds) resulting from this pro cess; p osteriors on all other parameters are shown in Supplemen tary Information. Substantial flexibility exists in the magnitude of the cop y num b er minimum, illustrating that observed heteroplasmy v ariance can result from a range of b ottlenec k sizes from ∼ 200 to > 10 3 ; going some w ay to wards reconciling the conflict betw een Refs. [18] and [19] and Refs. [11] and [12]. The total amount of mtDNA turno ver (presen ted as σ = P 6 i =3 ν i τ 0 i , the pro duct of turno v er rate and the time for which this rate applies, summed ov er quiescent dynamic phases; for example, a turno ver rate of 0 . 1 hr − 1 for 30 days yields σ = 0 . 1 × 24 × 30 = 72) is constrained more 1000 10000 100000 E(m ) A 0 0.02 0.04 0.06 0 10 20 30 40 50 60 70 V'(h ) B 50000 100000 500000 * 0 0.1 0 0.5 1 0 10 20 30 40 50 60 70 ν / hr ⁻ ¹ T im e / dpc C 0 0.1 0.2 0 1000 2000 P(m in E(m ) min E( m) D 0 0.1 0.2 0 1000 2000 P( σ ) T ur nover σ E Figure 3: Parameterisation of the BDP mo del and inferred details of b ottleneck mechanism. T ra jectories of (A) mean cop y num b er E ( m ) and (B) normalised heteroplasmy v ariance V 0 ( h ) resulting from BDP mo del parameterisations sampled using ABC with a thresh- old = 40. * denotes measurements in mature o o cytes, mo delled as 100 dp c (see Methods). Note: the r ange in (B) do es not c orr esp ond to a cr e dibility interval on individual me asurements, but r ather on an exp e cte d underlying (p opulation) varianc e, from which individual vari- anc e me asur ements ar e sample d. W e thus exp ect to see, for example, several measurements low er than this range due to sampling limita- tions (see text). (C) Posterior distributions on mtDNA turnov er ν with time. (D) Posterior distribution on min E ( m ), the minim um mtDNA copy n umber reached during developmen t. (E) Posterior distribution on σ = P 6 i =3 τ 0 i ν i , a measure of the total amount of mtDNA turno ver. than the specific tra jectory of m tDNA turnov er rates, sho wing that a v ariety of time b eha viours of turnov er are capable of pro ducing the observed heteroplasm y b eha viour. Exp erimen tal v erification of the birth-death- partition mo del The b ottlenec k mechanism identified through our analysis has sev eral characteristic features whic h facilitate exp erimen tal v erification. Key among these are the prediction that hetero- plasm y v ariance acquires an intermediate (nonzero, but not maximal) v alue as a result of the cop y num b er bottleneck, then contin ues to increase due to mtDNA turnov er in later dev elopment. Our theory also pro duces quan titative predic- tions regarding the structure of heteroplasm y distributions at arbitrary times. The existing data that w e used to perform inference and mo del selection display a degree of internal heterogeneity , coming from several different exp erimental groups. F urther- more, these data represent statistics resulting from a single pairing of mtDNA types, and it is th us arguable how conclu- sions dra wn from them ma y represen t the more genetically div erse reality of biology . Ref. [44] recently addressed the issue of this limited num b er of mtDNA pairings by pro duc- ing nov el mouse mo dels inv olving mixtures of standard and sev eral new, unexplored, wild-derived haplotypes whic h cap- ture a range of genetic div ersity . T o test the applicability and 5 generalit y of our predictions, we hav e p erfomed new exp er- imen tal measurements of germline heteroplasmy v ariance in these mo del animals under a consisten t experimental proto col (see Metho ds). W e use the ‘HB’ mouse line from Ref. [44] pairing a wild-derived m tDNA haplotype (lab elled ‘HB’ after its source in Hohenberg, Germany) with C57BL/6N; we refer to this mo del as ‘HB’. Heteroplasm y measuremen ts w ere tak en in o ocytes sam- pled from mice at ages 24-61dp c (see Methods and Supple- men tary Information; raw data in Source data 1). The statis- tics of these measurements yielded E ( h ), V ( h ) and V 0 ( h ) as previously . This age range was chosen to address the regions with most pow er to discriminate b et ween the comp eting mo d- els; the existing V 0 ( h ) data is most heterogeneous around 20- 30dp c and the later datap oin ts allo w us to detect dev elopmen- tal heteroplasmy b eha viour after the copy num b er minimum. Fig. A shows these V 0 ( h ) measurements. The qualitativ e b e- ha viour predicted by the BDP mechanism is clearly visible: v ariance around birth (after the cop y num b er bottleneck) is lo w but non-zero, subsequently increasing with time. The abilit y of the BDP mo del to account for the magnitudes and time b eha viour of heteroplasm y v ariance more satisfactorily than the alternative models is shown b y the mo del fits in Fig. A. W e explored these new data quantitativ ely through the same mo del selection approach used for the existing data. As sho wn in Fig. B, the BDP mechanism again experiences b y far the strongest statistical supp ort in this genetically differ- en t system. Fig. C shows the result of our parameteric inference ap- proac h using these V 0 ( h ) measurements coupled with the E ( m ) measurements used previously (employing our assump- tion that mo dulation of copy n umber by heteroplasmy in this non-pathological haplotype is small). Strikingly , the quan- titativ e b eha viour of V 0 ( h ) with time inferred from the HB mo del (red) matc hes the previous b eha viour inferred from the NZB/BALB/c system (blue) very w ell, suggesting that our theory is applicable across a range of genetically distinct pairings. W e note that the shaded region in Fig. C corre- sp onds to credibilit y interv als around the me an b eha viour of V 0 ( h ), and the fact that individual V 0 ( h ) datap oin ts (sub ject to fluctuations and sampling effects) do not all lie within these in terv als is not a signal of p oor mo del choice. An analogous situation is the observ ation of a scatter of datap oin ts outside the range of the standard error on the mean (s.e.m.), whic h do es not imply a mistake in the s.e.m. estimate. The differ- ence b et ween the trace in Fig. A and the mean curve in Fig. C arises b ecause Fig. A shows the b eha viour of the model under a single, optimised parameterisation, whereas Fig. C sho ws the distribution of mo del b eha viours ov er the p osterior distributions on parameters: the mean V 0 ( h ) trace of this dis- tribution is comparable but not equiv alent to that from the single b est-fit parameterisation. T o confirm more detailed predictions of our mo del, we also examined the sp ecific distributions of heteroplasmy in our new measurements. Given a mean heteroplasmy and an organismal age, the parameterised BDP mo del predicts the structure of the heteroplasmy distribution (see Metho ds and 0 0.02 0.04 0.06 0 10 20 30 40 50 60 70 V'(h ) T im e / dpc BALB /c data HB data BDP Cao alon e W ai ( b) alon e A 0 0.2 0.4 0.6 0.8 1 Cao alon e W ai ( b) alon e BDP Posteri or pro babili ty P(M | ε ) ε ₁ ε ₂ ε ₃ ε ₄ B 0 0.02 0.04 0.06 0.08 0.1 0 50 V'(h ) t / dpc C HB theor y: 95% c.i. HB theor y: s.d. HB theor y: mean HB exper imen ts Prev ( BALB /c) theory: 95% c.i. -1 -0.5 0 0.5 1 0 10 20 30 40 50 60 70 T ra nsforme d heterop lasmy T im e / dpc D T ra ining oo cyte data T ra ined theor y (95% c.i.) Unused oo cyte data (i) (ii) (iii ) 0 0.2 0.4 0 1 P(h) h (i) 0 0.2 0.4 0 1 P(h) h (ii) 0 0.2 0.4 0 1 P(h) h (iii) Predictions and exp erimen tal verification of the BDP mo del. (A) New V 0 ( h ) measurements from the HB mouse system, with optimised fits for the BDP , W ai (b) and Cao mo dels. (B) Posterior probabilities of each mo del given this data under decreasing ABC threshold: = { 50 , 40 , 30 , 25 } . (C) All V 0 ( h ) measuremen ts from the HB mo del (p oints) with inferred V 0 ( h ) b eha viour from ABC applied to the BDP mo del (red curv es). As in Fig. , this r ange do es not c orr esp ond to a cr e dibility interval on individual me asur ements, but r ather on an exp e cte d underlying (p opulation) varianc e, fr om which individual variance me asur ements are sample d. The inferred b eha viour strongly overlaps with the inferred b eha viour for the BALB/c system (blue curves), suggesting that the BDP mo del applies to a genetically diverse range of systems. (D) Heteroplasmy distributions. The trans- formation h 0 = − ln ( h − 1 − 1) E ( h ) / (1 − E ( h )) [44] is used to compare distributions with different mean heteroplasm y . Red jitter points are samples from sets used to parameterise the BDP mo del; red curvessho w the 95 % range on transformed heteroplasmy with time inferred from these samples. Blue jitter points are samples withheld independent from this parameterisation; their distributuions fall within the indep endently inferred range. Insets show, in un transformed space, distributions of the withheld heteroplasm y measurements (blue) compared to parameterised predictions (red); no withheld datasets show significant supp ort against the predicted distribution (Anderson-Darling test, p < 0 . 05). 6 next section). W e parameterised the mo del using V 0 ( h ) v al- ues from a subset of half of the new measurements (chosen b y omitting every other sampled set when ordered by time). Fig. D shows a comparison of measured heteroplasmy dis- tributions with a 95 % b ound from the parameterised BDP mo del. W e then tested the predictions of the parameterised mo del against the other half of new measuremen ts. 8 of the test measuremen ts (2.4%) fell outside the inferred 95% b ound from the training dataset, illustrating a go o d agreement with distributional predictions. The Anderson-Darling test w as used to compare the distribution of heteroplasmy in sampled o ocytes with distributions predicted b y our theory (given age and mean heteroplasmy); no set of samples show ed signifi- can t ( p < 0 . 05) departures from the h yp othesis that the t wo distributions were identical. Some example distributions are presen ted in Fig. D (i), (ii), (iii). The birth-death-partition mo del is analyti- cally tractable Imp ortan tly , the birth-death-partitioning mo del yields ana- lytic solutions for the v alues of all ge netic prop erties of in- terest, using tools from sto c hastic pro cesses (detail in Meth- o ds and Supplementary Information). These results facil- itate straightforw ard further study and fast predictions of timescales and probabilities of in terest. The full theoreti- cal approach is detailed in the Supplementary Information, and equations for the mean and v ariance of m tDNA p opu- lations and heteroplasm y are given in the Metho ds. In Fig. 2A we illustrate that these analytic results exactly match the n umeric results of sto c hastic simulation, a result that holds across all BDP mo del parameterisations. It is also straight- forw ard to calculate the fixation probability P ( m = 0), which allo ws us to c haracterise all heteroplasmy distributions that arise from the b ottlenec king pro cess, even when highly skew ed (see Metho ds and Supplementary Information). W e hav e thus obtained analytic solutions for the time b eha viour of mtDNA cop y num b er and heteroplasmy throughout the b ottlenec k with no assumptions of con tinuous p opulation densities or fixed population size, under a physical mo del with the most statistical supp ort given exp erimen tal data. Mito c hondrial turno ver, degradation, and se- lectiv e pressures exert quan tifiable influence on heteroplasmy v ariance W e can use our theory to explore the dep endence of b ot- tlenec k dynamics on sp ecific biological parameters. W e first explore the effects of modulating m tDNA turno v er b y v arying λ and ν in concert, corresp onding to an increase in mtDNA degradation balanced by a corresp onding increase in m tDNA replication. This increased mtDNA turno ver increases the heteroplasm y v ariance due to b ottlenec king (see Fig. 4A). This result arises due to the increased v ariability in mtDNA cop y n umber from the underlying random pro cesses occur- ring at increased rates. Additionally , we find that increasing m tDNA degradation ν without increasing λ also increases 1000 10000 100000 E(m ) A [All traje ctories overla p] B C 0 0.05 0.1 0.15 0 30 60 * V'(h ) T im e / dpc C T - T+ 0 30 60 * T im e / dpc C M- M+ 0 30 60 * T im e / dpc C S+ S- 1e-06 1e-05 0.0001 0.001 0.01 0.1 1 0 30 60 90 P(h > h*) T im e / dpc h* = 0.4 h* = 0.5 h* = 0.6 D 0.1 1 10 100 1000 0 0.2 0.4 0.6 0.8 1 P(h | h ₘ ) Embr yonic heter oplasm y h t = 0.5 dpc t = 4 dpc t = 21 dpc ** *** E Figure 4: Quan titative influences and clinical results from our b ottlenec king model. (A-C) T ra jectories of copy num b er E ( m ) and normalised heteroplasmy v ariance V 0 ( h ) resulting from p erturbing dif- ferent physical parameters. T ra jectory C labels the ‘control’ tra jectory resulting from a fixed parameterisation; black dots show exp erimen tal data; * denotes measurements from primary o ocytes, mo delled at 100 dpc. (A) Increasing ( T + ) and decreasing ( T − ) mtDNA turnov er (b oth mtDNA replication and degradation) b y 20%. (B) Increasing ( M + ) and decreasing ( M − ) mtDNA degradation throughout developmen t by a constant value (2 × 10 − 4 , in units of day − 1 ), while keeping replica- tion constant. (C) Applying a p ositiv e ( S + ) and negative ( S − ) selective pressure to mutan t mtDNA by 5 × 10 − 6 day − 1 . (D) Probability of crossing different heteroplasmy thresholds h ∗ with time, starting with initial heteroplasmy h 0 = 0 . 3. (E) Probability distributions ov er embry- onic heteroplasmy h 0 given a measurement h m from preimplantation sampling (** h m = 0 . 1; *** h m = 0 . 4) at different times. heteroplasm y v ariance, in addition to decreasing the ov erall m tDNA cop y n umber (Fig. 4B). Applying this unbalanced in- crease in mtDNA degradation without a matching change in replication has a strong effect on mtDNA dynamics as it cor- resp onds to a universal change in the ‘con trol’ applied to the system, analogous, for example, to c hanging target copy n um- b ers in manifestations of relaxed replication [21]. The simple mo del w e use do es not include fee dbac k and controls mtDNA dynamics solely through kinetic parameters. Perturbing the balance of these parameters th us strongly affects the exp ected b eha viour of the system. As w e discuss later, elucidation of the sp ecific mec hanisms by which control is manifest in m tDNA p opulations will require further research, but these n umerical experiments attempt to represent the cases where a p erturbation is naturally comp ensated for (matched changes, Fig. 4A) and where it is not (unbalanced change, Fig. 4B). These results suggest that an artificial in terv ention increas- ing mito c hondrial degradation may generally b e exp ected to increase heteroplasm y v ariance during dev elopment. An in- crease in mtDNA degradation is exp ected to either directly 7 increase heteroplasmy v ariance (Fig. 4B) if mtDNA p opu- lations are w eakly con trolled, or to pro vok e a compensatory , p opulation-main taining increase in m tDNA replication, thus increasing m tDNA turnov er, which also acts to increase v ari- ance (Fig. 4C) if mtDNA populations are sub ject to feedbac k con trol. The increase in v ariance through either of these path- w ays will increase the p o w er of cell-level selection to remov e cells with high heteroplasmy and th us purify the p opulation. F or this reason, we sp eculate that mito c hondrial degradation ma y represent a p oten tial clinical target to address the in- heritance of mtDNA disease (more detail in Supplemen tary Information). Our mo del also allows us to explore the effect of differ- en t m tDNA types experiencing differen t selectiv e pressures, b y setting λ 1 6 = λ 2 (m utant mtDNA exp eriences a prolifera- tiv e adv an tage or disadv antage). Such a selective difference causes changes in b oth mean heteroplasmy and heteroplasmy v ariance, as shown in Fig. 4C (for example, if heteroplasmy decreases tow ards zero, heteroplasm y v ariance will also de- crease, as the wild type is increasingly lik ely to b ecome fixed). W e do not fo cus further on selection in this study , noting that selectiv e pressures are likely to be sp ecific to a given pair or set of mtDNA types and are not generally characterised well enough to p erform satisfactory inference. Ho wev er, we do note that our theory giv es a straigh tforward prediction for the functional form of mean heteroplasm y when nonzero selection is present, a sigmoid with slop e set by the fitness difference (see Methods). Probabilities of exceeding threshold hetero- plasm y v alues A key feature of m tDNA diseases is that pathological symp- toms usually manifest when heteroplasm y in a tissue exceeds a certain threshold v alue, with few or no symptoms manifested b elo w this threshold [45]. The probability and timescale as- so ciated with whic h cellular heteroplasm y may b e exp ected to exceed a given v alue is thus a quantit y of key in terest in clinical planning of mtDNA disease strategies. In our mo del, the probability , as a function of time, of a cell containing m 1 wildt yp e and m 2 m utant mtDNAs can b e straigh tforwardly derived. The resultant analytic expression in volv es a hypergeometric function, also an imp ortan t math- ematical element in expressions describing mtDNA statistics based on classical p opulation genetics [23, 46]. The prob- abilit y of obtaining a given heteroplasmy can therefore b e computed as a sum ov er all copy num b er states that cor- resp ond to that heteroplasmy . How ever, as hypergeometric functions are comparativ ely unintuitiv e and computationally exp ensiv e, we here employ an approximation to the distri- bution of heteroplasm y based up on the ab o ve momen ts that are straigh tforwardly calculable from our mo del. This ap- pro ximation inv olves fixation probabilities for each mtDNA t yp e and a truncated Normal distribution for intermediate heteroplasmies (see Metho ds). In the Supplementary Infor- mation we show that this approximation corresp onds well to the exact distributions calculated using the hypergeometric function. W e underline that exact heteroplasm y distributions are straightfo ward to compute using our approac h: w e use the truncated Normal approximation as it represents the ex- act distribution well, is more intuitiv ely interpretable, and is computationally very inexp ensive. Using this approach, the probabilit y with time of a cell exceeding a threshold heteroplasmy h ∗ can b e straightfor- w ardly computed for any initial heteroplasmy , allowing rigor- ous quantitativ e elucidation of this imp ortan t clinical quan- tit y (see Metho ds). Fig. 4D illustrates this computation b y showing the analytic probability with which thresholds h ∗ = 0 . 4 , 0 . 5 , 0 . 6 are exceeded at a time t , given the example initial heteroplasmy h = 0 . 3. These results serv e as a simple example of the p o wer of our mo delling approac h: an y other sp ecific case can readily be addressed. Our theory thus al- lo ws general quantitativ e calculation of the probabilit y (and timescale) that any given heteroplasmy threshold will b e ex- ceeded, giv en kno wledge of the initial (or early) heteroplasm y . Dev elopmen tal sampling of embry onic het- eroplasm y W e next turn to the question of estimating heteroplasmy lev- els in a developed organism by sampling cells during dev el- opmen t. This principle, clinically termed preimplantation ge- netic diagnosis [5, 47], assists in clinical planning by allowing inference of the sp ecific heteroplasmic nature of the em bryo itself rather than a p opulation a verage of an affected mother’s o ocytes [48]. Ho wev er, the complicated and sto chastic nature of the b ottleneck makes this inference a challenging problem. Giv en a heteroplasmy measurement from sampling h m , ac- curate preimplantation diagnosis is contingen t on knowledge of the distribution P ( h | h m ), that is, the probabilit y that the em bryonic heteroplasm y is h given that a measuremen t h m has b een made. W e can use our mo delling framew ork and Ba yes’ theorem (see Metho ds) to obtain a formula for this conditional probability , allowing a rigorous probabilit y to be assigned to inferences from preimplan tation sampling. Here, as abov e, we emplo y the truncated Normal appro ximation for the heteroplasmy distribution, noting that the exact treat- men t using hypergeometric functions is straightforw ard but more computationally exp ensiv e. Fig. 4E illustrates this pro- cess by showing the probability distributions on em bryonic heteroplasm y when measurements h m = 0 . 1 or 0 . 4 hav e b een tak en at different times during developmen t. The increasing heteroplasm y v ariance through developmen t means that sub- stan tially greater uncertain ty is asso ciated with heteroplasmy v alues inferred using measurements tak en at later times. In conclusion, although care m ust b e taken in applying this rea- soning to cell types in which, for example, mito c hondrial and cell turno ver rates differ from those assumed here, or differen- tiation leads to tissue-sp ecific selective factors acting on the m tDNA p opulation, this formalism provides a general means of rigorously inferring embry onic heteroplasmy through ge- netic diagnosis sampling. 8 Discussion W e ha ve used a general sto c hastic mo del and approximate Ba yesian computation with the a v ailable exp erimen tal data on developmen tal mtDNA dynamics to show that the b ot- tlenec k is most likely manifest through sto c hastic mtDNA dynamics and partitioning, with increased random turno ver later during dev elopment, a mechanism which we can de- scrib e exactly and analytically (Fig. 5). W e emphasise that the bottom-up construction of our mo del from physi- cal first principles b oth increases the flexibility and general- it y of our mo del, allowing different mechanisms to b e com- pared together, and providing information on mtDNA dy- namics throughout developmen t rather than estimating an o verall effect. W e note that even though our model cannot represen t the full microscopic truth underlying the mtDNA b ottlenec k, its ability to recapitulate the wide range of ex- tan t exp erimen tal measurements suggest that its study may yield useful insights into the effects of different treatments and p erturbations on the b ottlenec k. A key debate in the literature has fo cussed on the magni- tude of the b ottlenec k. Some studies [11, 15] hav e observed a depletion of mtDNA copy num b er during the b ottlenec k to minima around several hundred; other studies [18, 19] hav e observ ed that m tDNA copy n umber remains > 10 3 . Our study sho ws that observ ed increases in heteroplasm y v ariance [16, 12] can be ac hieved across this range of p oten tial minimal m tDNA copy n umbers, meaning that the m uch-debated mag- nitude of m tDNA copy num b er reduction is not the sole crit- ical feature of the b ottlenec k, in agreement with arguments from Refs. [18, 19, 12]. W e find that the role of sto chastic m tDNA dynamics can play a k ey role in determining het- eroplasm y v ariance without additional mechanistic details, in k eeping with approaches prop osed by Ref. [11]. The mecha- nism with the most statistical supp ort is thus consistent with asp ects from all existing prop osals in the literature. W e ha ve sho wn that, of the mo dels prop osed in the liter- ature, a birth-death-partitioning mo del, prop osed after Ref. [11] and compatible with an interpretation of Ref. [12], is the individually most lik ely mec hanism, and capable of pro ducing exp erimen tally observ ed heteroplasmy behaviour. W e cannot, giv en current exp erimen tal evidence, discoun t hybrid mech- anisms, where birth-death-partitioning dominates the p opu- lation dynamics but small contributions from other mecha- nisms provide p erturbations to this b ehaviour, and prop ose exp erimen ts to conclusiv ely distinguish b et ween these cases (see Supplemen tary Information). As the exp ected statis- tics of mtDNA p opulations undergoing inheritance of het- eroplasmic mtDNA clusters is very similar to those under- going binomial partitioning of mtDNAs (see Supplementary Information), the inheritance of heteroplasmic nucleoids (as opp osed to individual mtDNAs) is not excluded by our find- ings, though other recen t experimental evidence suggests that this situation ma y b e unlikely [42, 41]. W e contend that the most lik ely situation may inv olve the partitioning of individ- ual organelles, con taining a mixture of homoplasmic nucleoids of characteristic size < 2. Notably , this case (inheritance of [Follicul ogenesi s] } } [Oogenesis] Some variance due to partit ioning at cell divisions Increasing varianc e due to random tu rnover Range of possible copy numbe rs T im e / dpc Log mtDNA copy numbe r & hetero plasmy var iance Log mtDNA copy numbe r Heterop lasmy varian ce Random 'birth and death' mtDNA dynamics Binom ial partition ing at divisions 10 20 50 [Birth] A B Figure 5: Mo del for the mtDNA b ottlenec k. A summary of our findings. (A) There is most statistical supp ort for a b ottlenec king mechanism whereby mtDNA dynamics is stochastic within a cell cycle, inv olving random replication and degradation of mtDNA, and m tDNAs are binomially partitioned at cell divisions. (B) This mechanism results in heteroplasmy variance increasing b oth due to sto c hastic partition- ing at divisions and due to random turnov er. The absolute magnitude of the copy num ber bottleneck is not critical: a range of bottleneck sizes can give rise to observed dynamics. Random turnov er of mtDNA increases heteroplasmy v ariance through folliculogenesis and germline developmen t. 9 heteroplasmic groups, likely with fluid structure due to mix- ing of organellar conten t and mito c hondrial dynamics), gives rise to statistics which our binomial mo del repro duces (see Supplemen tary Information). As mentioned in the mo del description, it is lik ely that mito c hondrial dynamics (fission and fusion of mito c hondria) [35] play a role in determining natural mtDNA turnov er, and particularly mtDNA turnov er in the presence of pathologi- cal m utations [49], through the mechanism of mito c hondrial qualit y control [32, 37]. Mito c hondrial dynamics ma y also in- fluence the elements of partitioning, through c hanges in the connectivit y of the mito c hondrial netw ork. In our current mo del, these influences are coarse-grained in to descriptions of the dynamic rates of mtDNA replication and degradation, and the characteristic elements that are partitioned at divi- sions. These ph ysical parameters, as opp osed to the more microscopic details of mito chondrial dynamics, are exp ected to be the k ey determinants of heteroplasmy statistics through dev elopment. Accoun ting for ho w these parameters, which summarize the relev an t outputs of mito c hondrial dynamics, connect to details of microscopic mo dels of mitochondrial dy- namics is an imp ortan t future research direction to b e ad- dressed when more quantitativ e data is a v ailable. The exp erimen tal data used to parameterise the first part of our study was taken from four studies in mice. Observ ation of similar dynamics in salmon [20] points tow ards the b ottlenec k b eing a conserv ed mechanism in v ertebrates. W e also note that our results in mice are broadly consisten t with findings from recent exp erimen ts in other organisms, suggesting that in primates and humans, heteroplasm y v ariance may increase at early developmen tal stages [50, 51], and that partitioning of mito c hondria is binomial in HeLa cells [52]. As more studies b ecome av ailable on human mtDNA b eha viour during dev el- opmen t we will test our mo del’s applicability and its clinical predictions. W e note that the results of a recent study of h uman preimplantation sampling [48] found that earlier mea- suremen ts provided strong predictive p o wer of mean hetero- plasm y , about whic h substan tial v ariation w as recorded in the offspring – both of which results are consistent with the ap- plication of our mo del to theoretical sampling co nsiderations. In addition, recent observ ations that the m.3243 A > G m u- tation in h umans b oth increases mtDNA cop y num b er during dev elopment [53], and displays a less pronounced increase of heteroplasm y v ariance [51] than other mutations, are consis- ten t with the link b etw een heteroplasm y v ariance and mtDNA cop y num b er in our theory . The combination of modern stochastic and statistical treat- men ts that we hav e emplo yed provides a generalisable and p o w erful wa y to recapitulate exp erimental data and rigor- ously deduce underlying biological mechanisms. W e hav e used this combination to explore p ertinent questions regard- ing the m tDNA b ottlenec k (and others hav e used a similar philosoph y to n umerically explore m tDNA p oin t m utations [25]): we hop e to convince the reader that such metho dol- ogy may b e appropriate to explore other problems inv olving sto c hastic biological systems. W e hav e used new exp erimen- tal measurements to confirm our theoretical findings, illus- trating the b eneficial and p o w erful coupling of mathematical and exp erimen tal approac hes to address comp eting h yp othe- ses in the literature. Our detailed elucidation of the b ot- tlenec k allows us to prop ose further exp erimen tal methodol- ogy to address the current unknowns in our theory , includ- ing the sp ecifics of m tDNA partitioning at cell division and the roles of selective differences b et w een mtDNA t yp es; im- p ortan tly , we also prop ose a strategy to inv estigate our claim that our most supp orted model is compatible with the subset- replication picture of mtDNA dynamics. W e list these exp er- imen ts in full in the Supplementary Information. Finally , w e b elieve that the theoretical foundation for m tDNA dy- namics that w e hav e pro duced allo ws increased quantitativ e rigour in the predictions and strategies in volv ed in mtDNA disease therapies, illustrated by the abov e application of our theory to problems in mtDNA sampling strategies, disease onset timescales, and interv en tions to increase the p o wer of the b ottleneck. Metho ds General mo del for mtDNA dynamics. Our ‘b ottom- up’ mo del represents individual mtDNAs as eleme n ts which replicate and degrade either randomly or deterministically according to the mo del parameterisation. Consonant with exp erimen tal studies sho wing that it is often a single mutan t genot yp e that dominates the non-wildtype mtDNA p opula- tion of a cell [54], w e consider tw o mtDNA types (wildtype and m utant), though our mo del can readily b e extended to more mtDNA types. W e denote the n umber of ‘wild-t yp e’ m tDNAs in a cell as m 1 and the n umber of ‘m utant’ m tD- NAs as m 2 . The heteroplasm y of a cell is then h = m 2 m 1 + m 2 , that is, the p opulation prop ortion of mutan t mtDNA. MtDNA dynamics within a cell cycle. Individual m tDNAs are capable of replication and degradation, with rates denoted λ and ν resp ectively . According to a binary categorical parameter S , these even ts ma y b e deterministic ( S = 0; the m tDNA p opulation replicates and degrades by a fixed amoun t p er unit time) or Poisson pro cesses ( S = 1; each individual m tDNA randomly replicates and degrades with av- erage rates λ and ν ). A parameter α con trols the prop ortion of mtDNAs capable of replication: α = 1 allows all mtDNAs to replicate throughout developmen t, α < 1 enforces a sub- set prop ortion α of replicating m tDNAs a time cutoff T after conception. MtDNA dynamics at cell divisions. A parameter c (cluster size; a non-negative in teger) dictates the partitioning of m tDNAs at cell divisions. When c = 0, partitioning is deterministic, so each daughter cell receiv es exactly half of its parent’s mtDNA. F or c > 0, partitioning is sto chastic. When c = 1, partitioning is binomial: eac h mtDNA has a 50% chance of b eing inherited by either daugh ter cell. When c > 1, the parent cell’s m tDNAs are group ed in clusters of size c b efore division. Each cluster is then partitioned binomially , with a 50% chance of b eing inherited by either daughter cell. Differen t dynamic phases through developmen t. The m tDNA p opulation changes in differen t wa ys as develop- 10 men t progresses, first decreasing, then reco vering, then slowly gro wing. W e include the p ossibilit y of differen t ‘phases’ of m tDNA dynamics in our mo del to capture this b eha viour. Eac h phase j has its o wn associated pairs of λ j , ν j parameters and may either b e quiescent (inv olving no cell divisions) or cycling (encompassing n j cell divisions). Th us, we may hav e an initial cycling phase with low m tDNA replication rates, so that cop y num b er falls for several cell divisions, then a sub- sequen t ‘recov ery’ cycling phase with higher replication rates so that mtDNA lev els are amplified, then quiescent phases as cell lineages are identified. W e allow six differen t phases, with the first tw o fixed as cycling phases with the ab ov e dou- bling times, and the final phase fixed to include no mtDNA replication (representing the stable, final o ccyte state). Initial conditions. The initial conditions of our mo del in- v olve an initial m tDNA copy num b er m 0 (the total n umber of m tDNAs in the fertilised o o cyte) and an initial heteroplasm y h 0 (the fraction of these mtDNAs that are mutated). Data acquisition. W e used three datasets for mtDNA cop y num b er during mouse developmen t: Cree [11]; Cao [18]; and W ai [12]. W e use tw o datasets for heteroplasmy v ariance during developmen t: W ai [12] and Jen uth [16]. By conv en- tion, we use the normalised v ersions of heteroplasmy v ariance (that is, measured v ariance divided by a factor h (1 − h )). Where the measurements were not giv en explicitly in these publications, we manually analysed the appropriate figures to extract the numerical data. F or these v alues, we used data from corresp ondence regarding the W ai study (reply to Ref. [17]), and man ually normalise the Jenuth dataset. The Jenuth dataset contains measurements tak en in ‘mature o ocytes’ with no time given; we assume a time of 100 dp c for these measurements, though this time is generalisable and do es not qualitatively affect our results. All v alues are pre- sen ted in the Supplementary Information. Data on cell dou- bling times in the mouse germ line is tak en from Ref. [43], suggesting that doubling times start with an interv al of every 7h, then after around 8.5 days post conception (dp c) increase to 16h, b efore the onset of a quiescent regime around 13.5 dp c (roughly consistent with the estimate of ∼ 25 divisions b et w een generations in the female mouse germ line [55]). Sim ulation, mo del selection, and parametric infer- ence. W e use Gillespie algorithms, also kno wn as stochastic sim ulation algorithms [56], to explore the b eha viour of our mo del of the b ottlenec king pro cess for a giv en parameter- isation. F or a given mo del parameterisation, the Gillespie algorithm is used to simulate an ensemble of 10 3 p ossible re- alisations of the time ev olution of m tDNA conten t, and the statistics of this ensemble are recorded. The exp erimen tal data we use is derived from sets of measurements of differen t sizes; to compare simulation data with an exp erimen tal data- p oin t i corresp onding to a statistic derived from n i measure- men ts, we sampled a random subset of n i of the 10 3 sim ulated tra jectories (all datap oin ts but one hav e n 10 3 ), and used this subset to derive the simulated statistic for comparison to datap oin t i [29]. T o fit the different mo dels to exp erimen tal data we de- fine a distance measure, a sum-of-squares residual b etw een the E ( m ) (in log space) and V ( h ) dynamics pro duced by our mo del and observ ed in the data, weigh ted to facilitate com- parison of these different quan tities [29]. W e also constrain cop y num b er to b e < 5 × 10 5 at all p oin ts throughout de- v elopment, rejecting parameterisation that disob ey this cri- terion. Metrop olis MCMC was used to iden tify the b est-fit parameterisation according to this distance function. F or sta- tistical inference, w e use appro ximate B a yesian computation (ABC), a statistical approac h that has successfully b een ap- plied to parametric inference and mo del selection in dynam- ical systems [30] to infer p osterior probability distributions b oth for individual mo dels and the parameters of the mo dels giv en exp erimen tal data. ABC samples p osterior probability distributions on parameters that lead to b eha viour within a certain threshold distance of the given data; these p osteriors are shown to conv erge on the true p osteriors as the threshold v alue decreases to zero (see Supplementary Information). W e emplo yed an MCMC sampler with randomly-selected initial conditions. F or further details, including priors, thresholds and step sizes used in ABC, see Supplementary Information. Minim um copy n umber was recorded directly from the result- ing tra jectories; our measure of total turnov er σ is defined as σ = P 6 i =3 τ 0 i ν i , the sum ov er quiescent dynamic phases of the pro duct of degradation rate and phase length. Creation of heteroplasmic mice. Heteroplasmic mice w ere obtained from a heteroplasmic mouse line (HB) we cre- ated previously by o oplasmic transfer [44]. This mouse line con tains the nuclear DNA of the C57BL/6N mouse, and m tD- NAs b oth of C57BL/6N and a wild-derived house mouse. Both mtDNA v ariants b elong to the same subsp ecies, Mus musculus domesticus . F or details on sequence divergence see Ref. [44]. Isolation and lysis of o o cytes. Mice w ere sacrificed at the indicated ages by cervical dislo cation. Ov aries w ere ex- tracted and immediately placed in cryo-buffer containing 50% PBS, 25% ethylene glycol and 25% DMSO (Sigma-Aldrich, Austria) and stored at -80 o C. F or o ocyte extraction, ov aries w ere placed into a drop of cryo-buffer and disrupted using scalp el and forceps. Oo cytes w ere collected and remaining cum ulus cells were remov ed mechanically by rep eated care- ful suction through glass capillaries. Prepared o o cytes w ere then w ashed in PBS before they were individually placed in to compartmen ts of 96-well PCR plates (Life T ec hnologies, Aus- tria) containing 10 µ l of o ocyte-lysis buffer [50] [50 mM T ris- HCl, (p.H 8.5), 1 mM EDT A, 0.5% tw een-20 (Sigma-Aldrich, Austria) and 200 µ g/mL ProteinaseK (Mac herey-Nagel, Ger- man y)]. Samples co vered stages from primary o o cytes of 3 da y-old mice up to mature o ocytes of 40 day-old mice. Sam- ples were lysed at 55 o C for 2 h, and incubated at 95 o C for 10 min to inactiv ate Proteinase K. The cellular DNA extract w as finally diluted in 190 µ l T ris-EDT A buffer, pH 8.0 (Sigma- Aldric h, Austria). 3 µ L were used p er qPCR reaction. Heteroplasm y quantification b y Amplification Re- fractory Mutation System (ARMS)-qPCR. Hetero- plasm y quantification w as p erformed by Amplification Re- fractory Mutation System (ARMS)-qPCR, an established metho d in the field [57, 58, 59], as describ ed in Ref. [44]. 11 The study was conducted according to MIQE (minim um in- formation for publication of quantitativ e real-time PCR ex- p erimen ts) guidelines [44, 60]. The prop ortion b et ween HB deriv ed and C57BL/6N mtDNA was determined by ARMS- qPCR assa ys based on a SNP in mt-rnr2 [44]. These assays w ere normalised to c hanges in the input mtDNA amoun t b y consensus assays, lo cated in conserved regions of mt-Co2 and m t-Co3 (see Supplemen tary Information). F or the calculation of mtDNA heteroplasmy , the assa y detecting the minor allele (C57BL/6N or wild-derived < 50%) was alw ays used. If b oth sp ecific assays gav e v alues > 50% (which can happ en around 50% heteroplasm y), the mean v alue of b oth assa ys was tak en. All qPCR runs contained no template con trols (NTCs) for all assa ys; these w ere negative in 100%. F urther exp erimen tal details av ailable in the Supplementary Information. Analytic mo del. In the birth-death-partitioning mo del, pro cesses within a cell cycle constitute a birth-death process whic h can b e solv ed using generating functions [61]. F or bino- mial partitioning, the generating function for the system after an arbitrary num b er of divisions has a recursive structure [62] and an analytic solution can b e obtained through solving a Riccati recurrence relation. This reasoning also extends to the differen t phases of replication and degradation, allowing an exact generating function to be constructed for an arbi- trary p oin t in the b ottlenec k. Deriv atives of this generating function are then used to obtain momen ts of the distributions of interest. The full pro cedure is given in the Supplementary Information. Recall that we assume that the b ottlenecking pro cess consists of a series of dynamic phases, which may either inv olve cycling cells (and hence cell divisions) or qui- escen t cells. The expression for mean mtDNA cop y num b er E ( m, t ) at time t is: E ( m, t ) = m 0 e ( t − τ ∗ ) Y phases i e ( n i τ i + τ 0 i )( λ i − ν i ) 2 n i , (2) where n i is the num b er of cell divisions in phase i (0 for quiescen t phases), τ i is the length of a cell cycle in cycling phase i , τ 0 i is the time spent in quiescent phase i (0 for cycling phases), and τ ∗ = Σ i ( n i τ i + τ 0 i ), so that t − τ ∗ is the time since the last cell division. E ( m, t ) is thus in tuitively interpretable as a pro duct of the initial cop y num b er with the effects of halving at each cell division, and the copy num b er ev olution through past and current cell cycles and quiescent phases. The expression for the v ariance is lengthier, taking the form V ( m, t ) = Φ E ( m, t ) Q phases i 4 n i ( e ( λ i − ν i ) τ i − 2) 2 ( λ i − ν i ) 2 + E ( m, t ) − E ( m, t ) 2 , (3) where Φ is a lengthy , though algebraically simple, function of all ph ysical parameters, which w e derive and presen t in the Supplemen tary Information. Once the means and v ariances asso ciated with m utant and wild-type m tDNAs hav e b een determined (for brevit y , w e write these as µ 1 ≡ E ( m 1 , t ) , σ 2 1 ≡ V ( m 1 , t ) and µ 2 ≡ E ( m 2 , t ) , σ 2 2 ≡ V ( m 2 , t )), the relations b elo w can b e used to compute heteroplasmy statistics: E ( h ) = µ 2 µ 1 + µ 2 ≡ µ h (4) V ( h ) = µ 2 h σ 2 2 µ 2 2 − 2 σ 2 2 µ 2 ( µ 1 + µ 2 ) + σ 2 1 + σ 2 2 ( µ 1 + µ 2 ) 2 ! (5) Selection. The predicted mean heteroplasm y at time t as- suming a constant selectiv e pressure (though this assumption can straightforw ardly b e relaxed) is given b y Eqn. 4, which, giv en Eqn. 2, straightforw ardly reduces to E ( h ) = 1 1 + 1 − h 0 h 0 e − ∆ λt , (6) where h 0 is initial heteroplasmy and ∆ λ is the increase (or decrease, if negative) in replication rate of mutan t o ver wild-t yp e m tDNA. Eqn. 6 predicts that mean heteroplasmy in the presence of selection will follo w a sigmoidal form (as exp ected from p opulation dynamics [63], by the constraint that h 0 m ust lie b et ween 0 and 1, and by the intuitiv e fact that heteroplasmy changes slow down as these limits are ap- proac hed). Threshold crossing. The probabilit y of heteroplasmy ex- ceeding a certain threshold h ∗ is simply given by integrating the probability distribution of heteroplasm y betw een h ∗ and 1. The exact distribution of heteroplasmy can b e written as a sum ov er h yp ergeometric functions; how ever, for com- putational efficiency and interpretabilit y , we employ an ap- pro ximation to this distribution in volving the truncated Nor- mal distribution and fixation probabilities. As shown in the Supplemen tary Information, the distribution of heteroplasm y , taking p ossible fixation into accoun t, can b e well appro xi- mated by P ( h ) = (1 − ζ 1 − ζ 2 ) N 0 ( h | µ, σ 2 ) + ζ 1 δ ( h ) + ζ 2 δ ( h − 1) (7) where N 0 is the truncated Normal distribution (truncated at 0 and 1), µ and σ 2 are found numerically given our mo del results for E ( h ) and V ( h ), and ζ 1 ≡ P ( h = 0) and ζ 2 ≡ P ( h = 1) are fixation probabilities, also straightforw ardly calculable from our model. The probability of threshold crossing for 0 < h ∗ < 1 is then P ( h > h ∗ ) = (1 − ζ 1 − ζ 2 ) 1 − 1 2 1 + erf ( h ∗ − E ( h )) / p 2 V ( h ) + ζ 2 . (8) Inference from heteroplasmy measuremen ts. Given a sampled measurement heteroplasm y h m , the probabilit y P ( h 0 | h m ) that embry onic heteroplasmy is h 0 is given by Ba yes’ theorem P ( h 0 | h m ) = P ( h m | h 0 ) P ( h 0 ) / P ( h m ). Assum- ing a uniform prior distribution on embry onic heteroplasmy (though this can b e straightforw ardly generalised), we thus obtain P ( h 0 | h m ) = P ( h m | h 0 ) / R 1 0 P ( h m | h 0 0 ) dh 0 0 , and using the ab o v e expression for the heteroplasmy , P ( h 0 | h m ) = (1 − ζ 1 − ζ 2 ) N 0 ( h m | µ, σ 2 ) + ζ 1 δ ( h m ) + ζ 2 δ ( h m − 1) R 1 0 dh 0 0 (1 − ζ 1 − ζ 2 ) N 0 ( h m | µ, σ 2 ) + ζ 1 δ ( h m ) + ζ 2 δ ( h m − 1) , (9) 12 where µ, σ 2 , ζ 1 , ζ 2 are functions of h 0 : µ, σ 2 ma y b e found n umerically and the ζ v alues are analytically calculable (see Supplemen tary Information). Ethics Statement. The study was discussed and ap- pro ved b y the institutional ethics committee in accordance with Go od Scien tific Practice (GSP) guidelines and national legislation. FELASA recommendations for the health moni- toring of SPF mice were follo wed. Approv ed b y the institu- tional ethics committee and the national authority according to Section 26 of the Law for Animal Exp erimen ts, Tierver- suc hsgesetz 2012 TV G 2012. Comp eting interests. The authors declare that no com- p eting interests exist. References [1] D. W allace and D. Chalkia. Mito c hondrial DNA genetics and the heteroplasmy conundrum in evolution and disease. Cold Spring Harb or Persp e ctives In Biolo gy , 5:a021220, 2013. [2] D. Rand. The units of selection of mitochondrial DNA. Annual R eview Of Ecolo gy And Systematics , page 415, 2001. [3] D. W allace. Mito c hondrial diseases in man and mouse. Science , 283:1482, 1999. [4] R. Ligh towlers, P . Chinnery , D. T urnbull, and N. How ell. Mam- malian mito c hondrial genetics: heredity , heteroplasmy and disease. T r ends In Genetics , 13:450, 1997. [5] J. Poulton, S. Kennedy , P . Oakeshott, and D. W ells. Preventing transmission of maternally inherited mito c hondrial DNA diseases. Bmj , 338, 2009. [6] S. Bacman, S. Williams, M. Pinto, S. Peralta, and C. Moraes. Specific elimination of mutan t mito c hondrial genomes in patien t- derived cells b y mitoT ALENs. Natur e Me dicine , 19:1111, 2013. [7] L. Cra ven, H. T upp en, G. Greggains, S. Harb ottle, J. Murphy , L. Cree, A. Murdoch, P . Chinnery , R. T aylor, and R. Lighto wlers. Pronuclear transfer in human embry os to preven t transmission of mitochondrial DNA disease. Natur e , 465:82, 2010. [8] J. Poulton, M. Chiaratti, F. Meirelles, S. Kennedy , D. W ells, and I. Holt. T ransmission of mito c hondrial DNA diseases and wa ys to preven t them. PL oS Genetics , 6:e1001066, 2010. [9] A. Bredeno ord, G. Pennings, and G. De W ert. Ooplasmic and nu- clear transfer to preven t mitochondrial DNA disorders: conceptual and normative issues. Human R epr o duction Up date , 14:669, 2008. [10] J. Burgstaller, I. Johnston, and J. P oulton. Mito c hondrial DNA disease and developmen tal implications for reproductive strategies. Mole cular Human Repr o duction , 21:11, 2015. [11] L. Cree, D. Samuels, S. de Sousa Lop es, H. Ra jasimha, P . W on- napinij, J. Mann, H. Dahl, and P . Chinnery . A reduction of mito- chondrial DNA molecules during embry ogenesis explains the rapid segregation of genotypes. Natur e Genetics , 40:249, 2008. [12] T. W ai, D. T eoli, and E. Shoubridge. The mitochondrial DNA genetic b ottlenec k results from replication of a subp opulation of genomes. Natur e Genetics , 40:1484, 2008. [13] C. Bergstrom and J. Pritc hard. Germline b ottlenecks and the evolu- tionary maintenance of mitochondrial genomes. Genetics , 149:2135, 1998. [14] P . W onnapinij, P . Chinnery , and D. Samuels. Previous estimates of mito c hondrial DNA mutation lev el variance did not account for sampling error: comparing the mtDNA genetic b ottlenec k in mice and humans. The Americ an Journal Of Human Genetics , 86:540, 2010. [15] C. Aiken, T. Cindrov a-Davies, and M. Johnson. V ariations in mouse mitochondrial DNA copy num b er from fertilization to birth are associated with oxidativ e stress. R epr o ductive Biomedicine Online , 17:806, 2008. [16] J. Jenuth, A. Peterson, K. F u, and E. Shoubridge. Random ge- netic drift in the female germline explains the rapid segregation of mammalian mito c hondrial DNA. Natur e Genetics , 14:146, 1996. [17] D. Samuels, P . W onnapinij, L. Cree, and P . Chinnery . Reassessing evidence for a p ostnatal mito c hondrial genetic b ottlenec k. Natur e Genetics , 42, 2010. [18] L. Cao, H. Shitara, T. Horii, Y. Nagao, H. Imai, K. Ab e, T. Hara, J. Ha yashi, and H. Y onek aw a. The mito c hondrial b ottlenec k occurs without reduction of mtDNA conten t in female mouse germ cells. Natur e Genetics , 39:386, 2007. [19] L. Cao, H. Shitara, M. Sugimoto, J. Hay ashi, K. Ab e, and H. Y oneka wa. New evidence confirms that the mito c hondrial bottle- neck is generated without reduction of mito c hondrial DNA conten t in early primordial germ cells of mice. PL oS Genetics , 5:e1000756, 2009. [20] J. W olff, D. White, M. W o odhams, H. White, and N. Gemmell. The strength and timing of the mito c hondrial b ottlenec k in salmon sug- gests a conserved mechanism in vertebrates. PloS One , 6:e20522, 2011. [21] P . Chinnery and D. Samuels. Relaxed replication of mtDNA: a model with implications for the expression of disease. The Ameri- c an Journal Of Human Genetics , 64:1158, 1999. [22] J. Elson, D. Sam uels, D. T urnbull, and P . Chinnery . Random in tra- cellular drift explains the clonal expansion of mitochondrial DNA mutations with age. The A meric an Journal Of Hu man Genetics , 68:802, 2001. [23] P . W onnapinij, P . Chinnery , and D . Samuels. The distribution of mitochondrial DNA heteroplasm y due to random genetic drift. The Americ an Journal Of Human Genetics , 83:582, 2008. [24] G. Capps, D. Samuels, and P . Chinnery . A mo del of the nuclear control of mito chondrial DNA replication. Journal Of The or etic al Biolo gy , 221:565, 2003. [25] S. P o ov athingal, J. Grub er, B. Halliwell, and R. Guna wan. Sto c has- tic drift in mito c hondrial DNA point mutations: a nov el persp ectiv e ex silico. PL oS Computational Biolo gy , 5:e1000572, 2009. [26] D. Marc hington, V. Macaula y , G. Hartshorne, D. Barlow, and J. Poulton. Evidence from human o ocytes for a genetic b ottlenec k in an mtDNA disease. The Americ an Journal Of Human Genetics , 63:769, 1998. [27] M. Beaumont, W. Zhang, and D. Balding. Appro ximate Bay esian computation in p opulation genetics. Genetics , 162:2025, 2002. [28] M. Sunn ˚ aker, A. Busetto, E. Numminen, J. Corander, M. F oll, and C. Dessimoz. Approximate bay esian computation. PL oS Compu- tational Biolo gy , 9:e1002803, 2013. [29] I. Johnston. Efficien t parametric inference for sto c hastic biological systems with measured v ariability. Stat. Appl. Genet. Molec. Biol. , 13:379, 2014. [30] T. T oni, D. W elch, N. Strelko wa, A. Ipsen, and M. Stumpf. Ap- proximate Ba yesian computation scheme for parameter inference and model selection in dynamical systems. Journal Of The R oyal So ciety Interfac e , 6:187, 2009. [31] H. Jacobs, S. Lehtinen, and J. Sp elbrink. No sex please, we’re mitochondria: a h yp othesis on the somatic unit of inheritance of mammalian mtDNA. Bioessays , 22:564, 2000. [32] G. Twig, B. Hyde, and O. Shirihai. Mitochondrial fusion, fission and autophagy as a quality control axis: the bio energetic view. Bio chimic a Et Biophysic a A cta (BBA)-Bio ener getics , 1777:1092, 2008. [33] B. Hill, G. Benavides, J. Lancaster, S. Ballinger, L. DellItalia, J. Zhang, and V. Darley-Usmar. Integration of cellular bio energet- ics with mito c hondrial quality control and autophagy . Biologic al Chemistry , 393:1485, 2012. [34] R. Y oule and A. V an Der Bliek. Mito c hondrial fission, fusion, and stress. Scienc e , 337:1062, 2012. 13 [35] S. Detmer and D. Chan. F unctions and dysfunctions of mito c hon- drial dynamics. Natur e Rev iews Mole cular Cel l Biology , 8:870, 2007. [36] H. Hoitzing, I. Johnston, and N. Jones. What is the function of mitochondrial netw orks? A theoretical assessment of h yp otheses and proposal for future research. BioEssays (e arly Online) , 2015. [37] G. Twig and O. Shirihai. The interpla y b etw een mito c hondrial dy- namics and mitophagy . Antioxidants & R e dox Signaling , 14:1939, 2011. [38] P . Mouli, G. Twig, and O. Shirihai. F requency and selectivity of mitochondrial fusion are key to its quality maintenance function. Biophysic al Journal , 96:3509, 2009. [39] C. Kuk at and N. Larsson. mtDNA makes a U-turn for the mito- chondrial nucleoid. T r ends In Cel l Biolo gy , 23:457, 2013. [40] D. Bogenhagen. Mito c hondrial DNA nucleoid structure. Bio chim- ic a Et Biophysica A cta (BBA)-Gene R e gulatory Mechanisms , 1819:914, 2012. [41] S. Jakobs and C. W urm. Sup er-resolution microscopy of mito c hon- dria. Curr ent Opinion In Chemic al Biolo gy , 20:9, 2014. [42] B. Poe I II, C. Duffy , M. Greminger, B. Nelson, and E. Arriaga. De- tection of heteroplasmy in individual mito c hondrial particles. An- alytic al And Bio analytic al Chemistry , 397:3397, 2010. [43] K. La wson and W. Hage. Clonal analysis of the origin of primordial germ cells in the mouse. Germline Development , 165:68, 1994. [44] J. Burgstaller, I. Johnston, N. Jones, J. Albrech tov a, T. Kolbe, C. V ogl, A. F utschik, C. Mayrhofer, D. Klein, and S. Sabitzer. mtDNA segregation in heteroplasmic tissues is common in viv o and modulated by haplotype differences and developmen tal stage. Cel l R ep orts , 7:2031, 2014. [45] R. Rossignol, B. F austin, C. Ro cher, M. Malgat, J. Mazat, and T. Letellier. Mito c hondrial threshold effects. Bio chemical Journal , 370:751, 2003. [46] M. Kimura. Solution of a pro cess of random genetic drift with a contin uous mo del. Pr o c e e dings Of The National A c ademy Of Scienc es Of The United States Of Americ a , 41:144, 1955. [47] J. Steffann, N. F rydman, N. Gigarel, P . Burlet, P . Ray , R. F anchin, E. F eyereisen, V. Kerbrat, G. T achdjian, and J. Bonnefont. Anal- ysis of mtDNA v ariant segregation during early human embry onic developmen t: a to ol for successful NARP preimplantation diagno- sis. Journal Of Me dic al Genetics , 43:244, 2006. [48] N. T reff, J. Camp os, X. T ao, B. Levy , K. F erry , and R. Scott. Blas- tocyst preimplantation genetic diagnosis (PGD) of a mito chondrial DNA disorder. F ertility And Sterility , 2012. [49] J. Nunnari and A. Suomalainen. Mito c hondria: in sickness and in health. Cel l , 148:1145, 2012. [50] H. Lee, H. Ma, R. Juanes, M. T achibana, M. Sparman, J. W o od- ward, C. Ramsey , J. Xu, E. Kang, and P . Amato. Rapid mito c hon- drial DNA segregation in primate preimplantation embry os pre- cedes somatic and germline b ottlenec k. Cel l R ep orts , 1:506, 2012. [51] S. Monnot, N. Gigarel, D. Samuels, P . Burlet, L. Hesters, N. F ryd- man, R. F rydman, V. Kerbrat, B. F unalot, and J. Martinovic. Seg- regation of mtDNA throughout human embry ofetal dev elopment: m. 3243A¿ G as a mo del system. Human Mutation , 32:116, 2011. [52] I. Johnston, B. Gaal, R. das Neves, T. En ver, F. Iborra, and N. Jones. Mito c hondrial v ariability as a source of extrinsic cellular noise. PL oS Computational Biolo gy , 8:e1002416, 2012. [53] S. Monnot, D. Samuels, L. Hesters, N. F rydman, N. Gigarel, P . Burlet, V. Kerbrat, F. Lamazou, R. F rydman, and A. Benachi. Mutation dep endance of the mitochondrial DNA copy n umber in the first stages of human embry ogenesis. Human Mole cular Genet- ics , 22:1867, 2013. [54] K. Khrapko, N. Bo dy ak, W. Thilly , N. V an Orsouw, X. Zhang, H. Coller, T. P erls, M. Upton, J. Vijg, and J. W ei. Cell-by-cell scan- ning of whole mito c hondrial genomes in aged human heart reveals a significant fraction of my o cytes with clonally expanded deletions. Nucleic A cids Rese ar ch , 27:2434, 1999. [55] J. Drost and W. Lee. Biological basis of germline mutation: com- parisons of spontaneous germline mutation rates among drosophila, mouse, and human. Envir onmental And Molecular Mutagenesis , 25:48, 1995. [56] D. Gillespie. Exact sto chastic simulation of coupled chemical reac- tions. The Journal Of Physic al Chemistry , 81:2340, 1977. [57] D. Paull, V. Emmanuele, K. W eiss, N. T reff, L. Stewart, H. Hua, M. Zimmer, D. Kahler, R. Goland, and S. Noggle. Nuclear genome transfer in h uman oo cytes eliminates mitochondrial DNA varian ts. Natur e , 493:632, 2013. [58] R. Stein b orn, P . Sc hinogl, V. Zakhartc henko, R. Achmann, W. Sc h- ernthaner, M. Sto jkovic, and E. W olf. Mito c hondrial DNA hetero- plasmy in cloned cattle produced by fetal and adult cell cloning. Natur e Genet. , 25:255, 2000. [59] M. T achibana, P . Amato, M. Sparman, J. W o odward, D. Sanchis, H. Ma, N. Gutierrez, R. Tippner-Hedges, E. Kang, and H. Lee. T ow ards germline gene therapy of inherited mitochondrial diseases. Natur e , 493:627, 2013. [60] S. Bustin, V. Benes, J. Garson, J. Hellemans, J. Huggett, M. Ku- bista, R. Mueller, T. Nolan, M. Pfaffl, and G. Shipley . The MIQE guidelines: minimum information for publication of quan titative real-time PCR exp erimen ts. Clinic al Chemistry , 55:611, 2009. [61] C. Gardiner. Handb o ok of sto chastic metho ds , volume 3. 1985. [62] J. Rausenberger and M. Kollmann. Quantifying origins of cell-to- cell v ariations in gene expression. Biophysic al Journal , 95:4523, 2008. [63] D. F utuyma. Evolutionary Biology, 1997. [64] R. Gilk erson, E. Schon, E. Hernandez, and M. Davidson. Mito c hon- drial nucleoids maintain genetic autonomy but allow for functional complementation. The Journal Of Cel l Biolo gy , 181:1117, 2008. [65] P . Marjoram, J. Molitor, V. Plagnol, and S. T av ar´ e. Marko v c hain Monte Carlo without likelihoo ds. Pro c e e dings Of The National A c ademy Of Sciences Of The Unite d States Of Americ a , 100:15324, 2003. [66] W. Hastings. Monte Carlo sampling metho ds using Marko v chains and their applications. Biometrika , 57:97, 1970. [67] S. Chae, B. Ahn, K. Byun, Y. Cho, M. Y u, B. Lee, D. Hwang, and K. Park. A Systems Approac h for Deco ding Mito chondrial Retrograde Signaling Path wa ys. Scienc e Signaling , 6:rs4, 2013. [68] R. de V ries, R. Gilk erson, S. Przedborski, and E. Sc hon. Mitophagy in cells with mtDNA muta tions: Being sick is not enough. Au- tophagy , 8:699, 2012. [69] M. Deffieu, I. Bhatia-Ki ˇ s ˇ sov´ a, B. Salin, A. Galinier, S. Manon, and N. Camougrand. Glutathione participates in the regulation of mitophagy in yeast. Journal Of Biolo gic al Chemistry , 284:14828, 2009. [70] R. Sentelle, C. Senk al, W. Jiang, S. Ponn usamy , S. Gencer, S. Sel- v am, V. Ramshesh, Y. Peterson, J. Lemasters, and Z. Szulc. Ce- ramide targets autophagosomes to mito c hondria and induces lethal mitophagy . Natur e Chemic al Biolo gy , 8:831, 2012. [71] R. Y oule and D. Narendra. Mechanisms of mitophagy. Natur e R eviews Mole cular Cel l Biology , 12:9, 2010. [72] N. Ap ostolo v a, L. Gomez-Sucerquia, A. Gortat, A. Blas-Garcia, and J. Esplugues. Compromising mito c hondrial function with the antiretro viral drug efavirenz induces cell surviv al-promoting au- tophagy . Hep atolo gy , 54:1009, 2011. [73] L. Brand. A sequence defined by a difference equation. The Amer- ic an Mathematic al Monthly , 62:489, 1955. [74] W. Greene. Ec onometric analysis . 2003. 14 Time / dp c E ( m ) N Source study 0 2.5e5 22 Cree 1 0.29 2.5e5 18 Cree 1 0.58 5.8e4 9 Cree 1 0.73 6.3e4 19 Cree 1 0.88 4.8e4 33 Cree 1 1.31 1.8e4 11 Cree 1 7.5 4.5e2 596 Cree 2 8.5 1.1e3 165 Cree 2 10.5 1.6e3 96 Cree 2 14.5 1.8e3 2615 Cree 2 , 3 0 1.7e5 42 Cao 1 0.29 7.1e4 32 Cao 1 0.58 4.8e4 32 Cao 1 0.88 2.1e4 32 Cao 1 5.5 1.5e3 85 Cao 2 , 3 6.5 1.6e3 43 Cao 2 , 3 7.5 2.0e3 53 Cao 2 , 3 7.75 2.0e3 42 Cao 2 , 3 8.5 2.1e3 82 Cao 2 , 3 9.5 2.2e3 93 Cao 2 , 3 10.5 2.1e3 74 Cao 2 , 3 11.5 2.0e3 67 Cao 2 , 3 12.5 1.9e3 124 Cao 2 , 3 13.5 2.1e3 71 Cao 2 , 3 8.5 2.8e2 20 W ai 4 9.5 2.5e3 20 W ai 4 10.5 2.8e3 20 W ai 4 12.5 4.0e3 20 W ai 4 14.5 5.8e3 20 W ai 4 16.5 2.4e3 20 W ai 4 25 5.0e3 20 W ai 4 29 1.0e4 20 W ai 4 32 3.0e4 20 W ai 4 46 6.5e4 20 W ai 4 Time / dp c V 0 ( h ) N Source study 7.5 5.2e-6 12 Jenuth 5 7.5 0.008 4 Jen uth 5 7.5 0.004 3 Jen uth 5 7.5 0.008 5 Jen uth 5 23 0.039 40 Jenuth 5 23 0.032 37 Jenuth 5 23 0.040 35 Jenuth 5 23 0.038 35 Jenuth 5 23 0.037 34 Jenuth 5 23 0.021 48 Jenuth 5 23 0.026 45 Jenuth 5 * 0.140 26 Jenuth 5 , 6 * 0.017 24 Jenuth 5 , 6 * 0.144 31 Jenuth 5 , 6 * 0.021 49 Jenuth 5 , 6 * 0.033 31 Jenuth 5 , 6 8.5 0.016 20 W ai 7 , 8 8.5 0.018 20 W ai 7 , 8 9.5 0.018 20 W ai 7 , 8 10.5 0.017 20 W ai 7 , 8 10.5 0.025 20 W ai 7 , 8 10.5 0.008 20 W ai 7 , 8 12.5 0.017 20 W ai 7 , 8 13.5 0.014 20 W ai 7 , 8 13.5 0.015 20 W ai 7 , 8 13.5 0.020 20 W ai 7 , 8 13.5 0.021 20 W ai 7 , 8 14.5 0.004 20 W ai 7 , 8 16.5 0.015 20 W ai 7 , 8 25.0 0.002 20 W ai 7 , 8 25.0 0.002 20 W ai 7 , 8 29.0 0.013 20 W ai 7 , 8 29.0 0.027 20 W ai 7 , 8 32.0 0.016 20 W ai 7 , 8 32.0 0.023 20 W ai 7 , 8 35.0 0.026 20 W ai 7 , 8 35.0 0.029 20 W ai 7 , 8 50.0 0.039 20 W ai 7 , 8 51.1 0.043 20 W ai 7 , 8 65.0 0.026 20 W ai 7 , 8 T able 1: Source data used in this study . 1 Data referenced b y number of cells p ost-conception is assigned a time measurement assuming the 7h → 16h doubling times from Ref. [43]. 2 Mean copy num b er taken directly from tabulated data. 3 (W eighted) av erage ov er germline cell classes presented at this time p oin t. 4 Extracted from data in figures; n not explicitly av ailable so estimated as n = 20 from accompanying histograms and discussion. 5 Manually normalised from given data. 6 Data from mature o ocytes in next generation: time in dp c not av ailable. 7 Extracted from data in figures in corresp ondence following study . 8 n not explicitly av ailable so estimated as n = 20 from accompanying histograms and discussion in original pap er. Supplemen tary Information 1 Data from exp erimen tal studies T able 1 contains the datap oin ts used in this study . These data are taken from T ables 1 and 2 of Ref. [11] (lab elled ‘Cao’); T ables 1 and 2 of Ref. [18]; Fig. 1 of Ref. [12] and Fig. 1 of the following corresp ondence (reply to Ref. [17]) (lab elled ‘W ai’); and T able 2 of Ref. [16] (lab elled ‘Jen uth’). Con ven tion in the literature suggests that normalisation of measured heteroplasm y v ariance v alues, p erformed by division by a factor h (1 − h ), allo ws comparison of v ariance v alues from lines with diverse absolute heteroplasmies: the W ai data from corresp ondence is already normalised, and w e manually normalised the Jenuth data using the h v alues present. Where data in the original studies were presented as a function of num b er of cells in a developing organism, as opp osed to an explicit function of time, we ha ve assigned times using the 7h → 16h doubling times from Ref. [43]. Other sources assume a 15h doubling time throughout early developmen t: using the data in terpreted in this wa y did not lead to a qualitative difference in our conclusions and very little quan titativ e change in posterior distributions (data not shown). Some datap oints did not hav e asso ciated or readily av ailable sample sizes N : for these datap oin ts we e stimated N using av ailable evidence in the publication. T o chec k for dep endence on these v alues of N w e p erformed our inference pro cess with a range of alternativ e N v alues and with a test case where N was set to 100 for every datap oin t: all results and posteriors were qualitatively similar, showing a lac k of strong dep endence of our conclusions on the sp ecific num b ers of samples inv olved in deriving the exp erimen tal measurem en ts (data not shown). 2 Heteroplasmic and homoplasmic clusters The sp ecific units of inheritance of mtDNA hav e b een debated in the literature for decades. The smallest possible unit of inheritance is a single mtDNA molecule; some studies hav e hypothesised that the unit of inheritance consists of groups of m tDNA molecules. Within this picture, debate exists as to whether these groups are semi-p ermanen t asso ciations of 15 molecules (whic h we will refer to as ‘quenched’ sets) or more fluid transien t colo calisations of molecules (whic h we refer to as ‘unquenched’). F urthermore, the size of these units is debated, with estimates ranging from an av erage size of 1.4 to 10 mtDNA molecules [39, 40], and it is unknown whether the mtDNAs within a group are strictly homoplasmic or if heteroplasmic groups are p ossible, although current evidence, at the finest resolution, p oin ts tow ards homoplasmic groups of size < 2 [42, 41, 64, 1]. W e will classify these different pictures with three parameters. First, the characteristic size c of an mtDNA group. Second, a classifier denoting whether these groups are quenc hed (in the sense that the individual constituents of a group remain the same ov er many cell divisions) or unquenched (in the sense that the individual constituents of a group may change b et w een cell divisions). Third, a classifier denoting whether groups are necessarily homoplasmic, or if heteroplasmy is p ermitted. An early hypothesis from Jacobs et al. [31] considered ‘n ucleoids’ which corresp ond to quenc hed heteroplasmic groups with c > 1, retaining their internal structure across cell divisions and containing differen t mtDNA t yp es. If the mito c hondrial organelle is the unit of inheritance, we may exp ect unquenched heteroplasmic groups with c > 1, as mito c hondrial dynamics act to mix the conten t of the mito c hondrial system b etw een cell divisions, but organelles are likely to contain more than one m tDNA molecule. If nucleoids are the units of inheritance and, as current understanding suggests, n ucleoids are small and homoplasmic (if mtDNA indeed exists in groups at all), the appropriate picture is c ' 1, homoplasmic groups. Here we show that the heteroplasmy statistics resulting from these different pictures of group ed inheritance collapse onto t wo represen tative cases: first, that corresp onding to homoplasmic clusters with c > 1, and second, that corresp onding to c = 1 (binomial inheritance). Quenching – whether mtDNA con tent can remix within n ucleoids – is sho wn to b e unimportant in determining heteroplasmy statistics. Our mo del for these differen t situations is as follo ws. W e consider a cellular population as consisting of a set of mtDNA molecules, existing in groups of size c . During a cell cycle, the p opulation of groups doubles deterministically (we ignore random birth-death dynamics in this mo del, in order to fo cus on partitioning dynamics), so that ev ery group pro duces one exact cop y of itself. F or unquenched sim ulations, a new set of groups is then formed by resampling the individual mtDNA constituen ts of the cell. F or quenched simulations (represen ting the situation p ostulated in Ref. [31]), the existing groups remain intact. A t cell divisions, groups are binomially partitioned b etw een the tw o daughter cells. The mo del is initialised with a cell containing m 0 m tDNAs, split into (1 − h ) m 0 wild-t yp e and hm 0 m utant molecules. These mtDNAs are clustered into m 0 /c groups, according to the cluster picture under consideration (i.e. homoplasmic or heteroplasmic clusters). W e simulate the subsequen t doubling then partitioning of this system through cell divisions many times, ass uming a constan t cell cycle length, and record the cell-to-cell heteroplasmy v ariance with time. Fig. 6 sho ws the resultant heteroplasmy v ariance tra jectories for different cases (with h 0 = 0 . 1; other initial heteroplas- mies show ed similar b eha viour). The first striking result is that the inheritance of heteroplasmic groups pro duces the same heteroplasm y v ariance as binomial partitioning, regardless of cluster size. This b eha viour is due to the balance betw een sto c hasticit y asso ciated with the makeup of, and partitioning of, groups. A small num b er of large groups will exp erience substan tial partitioning noise, but larger heteroplasmic groups are more likely to faithfully represent the o verall cell hetero- plasm y . As iden tified in Ref. [31], the inheritance of heteroplasmic groups thus pro vides a means to facilitate lo cal mtDNA complemen tation while pro voking no increase in heteroplasmy v ariance b ey ond that asso ciated with binomial partitioning of elemen ts at divisions. W e also observe that quenc hed populations behav e in the same wa y as unquenched p opulations. In the case of homoplasmic groups, this result is obvious, as a set of homoplasmic n ucleoids of a given size can only b e constructed in one wa y for a given n umber of mtDNA molecules of different types. F or heteroplasmic groups, this result implies that resampling the cellular p opulation to pro duce a new group pro duces a negligible amoun t of additional stochasticit y compared to that already presen t in the random makeup and inheritance of groups. Thus, the only determinant factors of heteroplasmy v ariance related to the inheritance of groups are whether groups are homoplasmic or heteroplasmic, and, if the former, the characteristic size of groups. These results illustrate that the binomial inheritance mo del can also describ e the statistics asso ciated with heteroplasmic n ucleoids of arbitrary size, o ver a timescale of several dozen cell divisions (suitable to describ e the developmen tal process). The theoretical long-term behaviour of these systems in volv es some more subtleties. At muc h longer times, the probabilit y that all mtDNA types b ecome extinct in a cell is not negligible. When complete extinction cannot b e ignored, heteroplasmy statistics b ecome p oorly defined. This extinction timescale is shorter for cluster inheritance than for binomial inheritance, as a greater v ariability in cop y num b er (though not in heteroplasmy) results from eac h division for larger clusters. How ever, our sim ulations indicate that as long as the heteroplasm y v ariance associated with heteroplasmic clusters remains w ell defined, it matches that resulting from binomial inheritance. W e prop ose that a reasonable view may b e that individual mito c hondrial fragments, including several small, homoplasmic n ucleoids, are the lik ely elemen ts of inheritance at partitioning. F urthermore, there is lik ely some mov ement of these nucleoids within the mito c hondrial net work, and fission and fusion lik ely mean that a given mtDNA will not b e asso ciated with the same static mito c hondrial element in perp etuit y . In this case, the picture of an unquenched, heteroplasmic group of mtDNAs – those contained within a discrete element of the mito c hondrial system – seems most reasonable. W e can th us sp eculate that, as demonstrated b y the previous results, the precise size of mito c hondrial fragments at partitioning is not imp ortan t 16 0 0.01 0.02 0.03 0.04 0 5 10 15 20 V(h) Division Homo, Q/UQ, cs = 1 Homo, Q/UQ, cs = 4 Homo, Q/UQ, cs = 16 Hetero, U, cs = 4 Hetero, Q, cs = 4 Hetero, U, cs = 16 Hetero, Q, cs = 16 Figure 6: Heteroplasm y v ariance in a model system under sev eral differen t group-inheritance regimes. V ( h ) ov er many cell divisions when the elements of inheritance are heteroplasmic or homoplasmic groups of different size. Groups may b e quenched (Q; constituents remain the same across cell divisions) or unquenched (UQ; constituents are randomly resampled from the cellular p opulation each cell cycle); for homoplasmic clusters, an unquenched proto col yields identical results to the quenched proto col. V ( h ) b eha viour differing from binomial partitioning ( c = 1) is only observed for homoplasmic groups with c ≥ 2. Poin ts for heteroplasmic groups are slightly offset in the x-direction for clarity . for the heteroplasmy dynamics (nor indeed is whether they are quenc hed or unquenched). Our simple binomial partitioning mo del is thus consisten t with what one might consider the most physiologically plausible mo del, and indeed with any mo dels not inv olving large and strictly homoplasmic groups as the elements of mito c hondrial inheritance. 3 P arametric inference for b ottlenec king dynamics Our mo del is a function of the parameter set 1 θ = { ν i , λ i , n i , τ i , S, α, T , c, h 0 , m 0 , δ λ } . F or the following parameters w e use uninformativ e uniform priors on the giv en interv al: λ i , ν i ∈ [0 , 1]hr − 1 ; S ∈ { 0 , 1 } ; α ∈ [0 . 005 , 1]; T ∈ [0 , 100]da y; c ∈ [0 , 100]; h 0 ∈ [0 , 1]; m 0 ∈ [0 , 10 6 ]. The following v alues are fixed from exp erimental studies [43, 55]: n 1 = 29; n 2 = 7; τ 1 = 7hr; τ 2 = 16hr. λ 6 = 0hr − 1 is fixed to a void m tDNA proliferation after developmen t; h 0 = 0 . 2 is fixed as an intermediate v alue as heteroplasmy v ariance measurements are generally normalised; δ λ , a parameter allowing a difference in replicativ e rates b et w een mutan t and wildtype mtDNAs, is fixed at zero throughout as w e ignore selective pressure. The parameter τ i for i > 2 is used to determine the length of time sp en t in different quiescent phases and is sub ject to the uniform prior τ i ∈ [0 , 50]day. Giv en these priors, we use an approximate Bay esian computation (ABC) approach to build a p osterior distribution ov er the parameters in our b ottlenec king mo del [30]. ABC inv olv es using a summary statistic ρ ( θ , D ) to compare the a v ailable data D to the predictions of a mo del giv en parameters θ . If parameter sets are sampled from the set for which ρ ≤ , where is a threshold difference b et w een the resulting mo del behaviour and exp erimental data, the p osterior distribution P ( θ | ρ ( θ , D ≤ )) is sampled, which is argued to sufficien tly approximate P ( θ |D ) for suitably small [65]. W e define a residual sum-of-squares difference b et w een the results of a sim ulated mo del and exp erimental data [29]: ρ ( θ , D ) = N m X i =0 log E θ ( m | t = t ( i ) D ,m ) − log E D ( m | t = t ( i ) D ,m ) 2 + N h X i =0 A 1 V θ ( h | t = t ( i ) D ,h ) − V D ( h | t ( i ) D ,h ) 2 (10) where D denotes exp erimen tal data. W e thus amalgamate exp erimen tal results of t wo types: mean mtDNA copy num b er (with N m data p oin ts measuring E D ( m ) at times t ( i ) D ,m ), and mean and v ariance of heteroplasmy (with N h data p oin ts measuring V D ( h ) at times t ( i ) D ,h ). The s ets of data for E ( m ) and V ( h ) con tain different num b ers of p oin ts and are of different absolute magnitudes. W e comp ensate for these differences by using the logarithms of copy n umber measurements (as these v alues span sev eral orders of magnitude), and weigh ting parameter A 1 = 10 3 . This w eighting parameter comp ensates for the different magnitudes and num b er of datap oin ts in eac h class of measurement, ensuring that the contribution to the total residual from eac h set of data is of comparable magnitude. Our summary statistic thus records a residual sum-of-squares 1 F or reference, the meanings of these parameters are (as in Fig. 1D in the Main T ext): replication ( λ i ) and degradation ( ν i ) rates; n umber of cell divisions ( n i ) and cell cycle length ( τ i ) in each dynamic phase i ; deterministic or stochastic dynamics label ( S = 0 , 1 resp ectiv ely); a proportion α of mtDNAs capable of replication after threshold time T ; deterministic ( c = 0), binomial ( c = 1) or clustered ( c > 1) partitioning at divisions; initial heteroplasmy h 0 and initial copy num b er m 0 ; δ λ is an additional parameter allowing a p ossible difference in replicative rates between mutant and wildt yp e mtDNA: this is zero unless otherwise stated. 17 0 0.05 0.1 0.15 0.2 0.25 0.3 0.35 0.4 0.45 0 0.5 1 1.5 2 2.5 3 3.5 4 P(r esidual ) E(m ) resid ual ε ₁ ε ₂ ε ₃ ε ₄ 0 0.1 0.2 0.3 0.4 0.5 0.6 0 0.5 1 1.5 2 2.5 3 3.5 4 P(r esidual ) A ₁ × V(h ) resid ual ε ₁ ε ₂ ε ₃ ε ₄ Figure 7: Residual distributions at different ABC thresholds . The distribution of squared residuals corresponding to individual experimental datap oin ts compared to an ensemble of simulated tra jectories for (top) log E ( m ) (b ottom) V ( h ). The V ( h ) residuals are scaled by A 1 = 10 3 to ensure that the tw o sets of measurements are compared on a quantitativ ely equal fo oting. As is decreased ( 1 , 2 , 3 , 4 = 40 , 50 , 75 , 100), distributions of residuals from accepted tra jectories tighten around zero. difference b et ween exp erimen t and simulation v alues for log E ( m ) and V ( h ) at each time p oin t where an exp erimen tal measuremen t exists. W e p erformed our mo del selection pro cess using several different alternative proto cols, including comparing logarithms of V ( h ) measurements (in contrast to the raw v alues) and v arying A 1 o ver orders of magnitude from 10 2 − 10 4 (corresp onding to un balanced weigh ting, fav ouring E ( m ) and V ( h ) data respectively). In all cases, the BDP mo del identified in the Main T ext experienced substan tially more supp ort than any alternativ e. F or inference in volving the new dataset from the HB mo del system, we use the default proto col ab o ve and set A 1 = 3 × 10 3 to account for the threefold decrease in a v ailable V 0 ( h ) datap oin ts. W e use an MCMC implemen tation of ABC, whereb y we construct a Mark ov chain θ i , where each state consists of a set of trial parameters to b e assessed. W e create θ i +1 b y p erturbing each parameter within θ i with a p erturbation kernel consisting of a Normal distribution on each parameter with standard deviations b et ween 0 . 1 − 1% of the width of the prior (v aried as the mo del dep ends more sensitiv ely on some parameters than others). In the case of discrete parameter c , a con tinuous represen tation c 0 is used and v aried in the MCMC approach, with c = b 100 c 0 c . W e accept θ i +1 as the new state of the c hain if ρ ( θ i +1 , D ) ≤ . W e ran 10 6 MCMC iterations for ABC mo del selections and c heck ed con vergence by running five instances of each simulation for different random num b er seeds. F or the initial optimisation of mo del fitting, we ran 10 6 MCMC steps using the proto col ab ov e but accepting a mo ve according to the Metrop olis-Hastings protocol [66], recording the parameterisation leading to the low est recorded residual. In this case w e used uninformative initial conditions, with identical choices for all rate parameters, corresp onding to an inaccurate tra jectory of cop y num b er and heteroplasm y v ariance. F or model selection, we used the proto col abov e, with a differen t set of parameters θ M for each model M , with each MCMC step prop osing a random mo del from the Cao alone, W ai alone, and BDP set describ ed in the text, as in the SMC ABC mo del selection protocol prop osed in Ref. [30]. W e record the prop ortion of accepted steps inv olving each mo del type. The parameterisations found through initial optimisation were used as initial conditions in the ABC mo del selection and inference simulations. Initial optimisation identified parameterisations all displaying residuals under = 50. W e chose = { 45 , 50 , 60 , 75 } for the ABC mo del selection simulations to display the v arying degrees of supp ort for eac h mo del as stricter agreement with exp erimen t w as enforced. W e c hose = 40 for the ABC inference of BDP mo del parameterisation to ensure these mo dels all displa yed b etter fits to data than the alternative mo dels. In Fig. 7 w e illustrate the distribution of squared residuals for the BDP mo del under a range of v alues. 18 4 P osteriors for all v ariables and datasets In Fig. 8 we display all posterior distributions for all parameters resulting from our ABC approach assuming the BDP mo del. There is substantial v ariability in the p ossible timescales and magnitudes of random turnov er associated with eac h random dynamic phase i > 2, exemplified by the complicated and bimodal structure of the p osteriors on these parameters. This v ariability reflects the fact that an increase in heteroplasmy v ariance can b e achiev ed through a v ariety of sp ecific m tDNA tra jectories, and current exp erimen tal data is insufficient to distinguish sp ecific time b ehaviours within this v ariety . Ho wev er, the total contribution of eac h random phase to the ov erall dynamics is more constrained, as shown in the p osterior distribution on a measure of total random turnov er σ = P 6 i =3 τ 0 i ν i . This quan tity is the sum ov er all later phases of the pro duct of the length of that phase and the rate of random turnov er, thus giving a measure of total random turno ver. The fact that this posterior is more tightly constrained than the p osteriors on individual t i , ν i parameters suggests that the required mtDNA turnov er can b e achiev ed through a range of sp ecific dynamic tra jectories from the inferred mec hanism: for example, the exact time at which random mtDNA turnov er sharply increases is curren tly flexible (though constrained to lie around 25 dp c) without more detailed data. This flexibility is also observed in the tra jectories of p osterior distributions in the main text. 5 Exp erimen tal measuremen ts T able 2 contains the measurements of heteroplasmy h , mean heteroplasmy E ( h ), raw and normalised heteroplasm y v ariance V ( h ) and V 0 ( h ), and n umber of datap oin ts n , from the HB model system. Exp erimen tal procedures are describ ed in Methods; further sp ecifics follow. Consensus ass a ys: Co2-f:GCCAA T AGAA CTTCCAA TCCGT A T A T, Co2-r:TGGTCGGTTTGA TGTT ACTGTTG, Co2-F AM:CTGA TGCCA TCCCAGGCCGA CT AA-BHQ1 (Amplicon length: 136bp); Co3-f:TCTT A T A TGGCCT ACCCA TTCCAA, Co3-r:GGAAAA CAA TT A TT AGTGTGTGA TCA TG, Co3-F AM: TTGGTCT A CAAGA CGCCACA TCCCCT-BHQ1 (Amplicon length: 103bp). ARMS-assa ys: 16SrRNA2340(3)G-f: AA TCAACA T A TCTT A TTGACCaA G (haplotype C57BL/6N), 16SrRNA2340(3)A-f: AA TCAACA T A TCTT A TTGACCgAA (haplotype HB); 16SrRNA2458-r: CAC CA T TGG GA T GTC CTG A TC, 16SrRNA-F AM: F AM-CAA TT A GGG TTT ACG A CC TCG A TG TT-BHQ-1. (Amplicon length: 142bp). Ev ery qPCR run consisted of one consensus and an ARMS assay . Master-mixes for triplicate qPCR reactions contained 1x buffer B (Solis BioDyne, Estonia); 4.5 MgCl2 for the ARMS and the Co3 consensus assays, and 3.5 mM MgCl2 for the Co2 consensus assay; 200 M of eac h of the four deo xynucleotides (dNTPs, Solis BioDyne, Estonia), HOT FIREPol DNA p olymerase according to the man ufacturers instructions (Solis BioDyne, Estonia), 300 nM of eac h primer and 100 nM h ydroloysis prob e (Sigma-Aldrich, Austria). P er reaction 12 µ L of master-mix and 3 µ L DNA were transferred in triplicates to 384-w ell PCR plates (Life T echnologies, Austria) using the automated pip etting system epMotion 5075TMX (Epp endorf, Germany). Amplification w as p erformed on the ViiA 7 Real-Time PCR System using the ViiA T M 7 Soft ware v1.1 (Life T echnologies, USA). DNA denaturation and enzyme activ ation were performed for 15 min at 95 o C. DNA was amplified o ver 40 cycles consisting of 95 o C for 20 sec, 58 o C for 20 sec and 72 o C for 40 sec for b oth assays. The standard curv e method was applied. Amplification efficiencies w ere determined for each run separately by DNA dilution series consisting of DNA from wild-derived mice, harb ouring the resp ective analysed m tDNA. Typical results: slop e = -3.665, -3.562, -3.461, -3.576; mean efficiency = 0.87, 0.9, 0.94, 0.90; and Y-intercept = 32.2, 28.3, 33.8, 34.5; for the consensus Co2, consensus Co3, C57BL/6N and HB assays resp ectiv ely . Coefficient of correlation was > 0 . 99 in all assays in all runs. All target samples la y within the linear interv al of the standard curves. T o test for sp ecificit y , in each run a negativ e control sample, i.e. a DNA sample of a mouse harb ouring the m tDNA of the non-analysed t yp e in the heteroplasmic mouse (i.e. C57BL/6N or HB m tDNA) w as measured. All assays could discriminate b et ween C57BL/6N and HB mtDNA at a minimum level of 0.2%. T arget sample DNA was tested for inhibition by dilution in T ris-EDT A buffer (Sigma-Aldrich, Austria), pH 8.0. 19 0 0.2 0.4 0.6 0.8 1 -1 -0.5 0 0.5 κ 1 0 0.1 0.2 0.3 0.4 0.5 0.6 0.7 0.8 0.9 -1 -0.5 0 0.5 κ 2 0 0.1 0.2 0.3 0.4 0.5 0.6 0.7 0.8 0.9 1 -1 -0.5 0 0.5 κ 3 0 0.1 0.2 0.3 0.4 0.5 0.6 0.7 -1 -0.5 0 0.5 κ 4 0 0.1 0.2 0.3 0.4 0.5 0.6 0.7 -1 -0.5 0 0.5 κ 5 0 0.2 0.4 0.6 0.8 1 -1 -0.5 0 0.5 κ 6 0 0.05 0.1 0.15 0.2 0.25 0.3 0.35 0.4 0.45 -0.5 0 0.5 1 ν 1 0 0.1 0.2 0.3 0.4 0.5 0.6 0.7 -0.5 0 0.5 1 ν 2 0 0.05 0.1 0.15 0.2 0.25 0.3 0.35 0.4 0.45 0.5 -0.5 0 0.5 1 ν 3 0.03 0.035 0.04 0.045 0.05 0.055 0.06 0.065 0.07 -0.5 0 0.5 1 ν 4 0.025 0.03 0.035 0.04 0.045 0.05 0.055 0.06 0.065 -0.5 0 0.5 1 ν 5 0.01 0.02 0.03 0.04 0.05 0.06 0.07 0.08 0.09 -0.5 0 0.5 1 ν 6 0 0.2 0.4 0.6 0.8 1 0 24 τ 1 0 0.2 0.4 0.6 0.8 1 0 24 τ 2 0 0.05 0.1 0.15 0.2 0.25 0.3 0.35 0.4 0.45 -1000 0 1000 2000 τ '3 0 0.05 0.1 0.15 0.2 0.25 0.3 -1000 0 1000 2000 τ '4 0 0.05 0.1 0.15 0.2 0.25 -1000 0 1000 2000 τ '5 0 0.05 0.1 0.15 0.2 0.25 0.3 -1000 0 1000 2000 τ '6 0 0.2 0.4 0.6 0.8 1 -0.5 0 0.5 1 h0 0 0.05 0.1 0.15 0.2 0.25 0.3 0.35 -5000 00 0 500000 1e+06 m0 0 0.2 0.4 0.6 0.8 1 -0.6 -0.4 -0.2 0 0.2 0.4 0.6 δ λ 0 0.02 0.04 0.06 0.08 0.1 0.12 0.14 -1000 0 1000 2000 Min E( m) 0 0.02 0.04 0.06 0.08 0.1 0.12 0.14 0.16 0.18 0.2 -1000 0 1000 2000 T ur nover σ Figure 8: Posterior distributions on mo del parameters. The p osterior distributions on individual model parameters, assuming the inferred BDP b ottlenec king mechanism. Replication rates are presented as κ = λ − ν , thus representing ov erall proliferation rates of mtDNA. Units are omitted for clarit y . Pale, single-v alues distributions correspond to parameter v alues fixed within the mo del ( κ 6 = 0 to prev ent m tDNA proliferation after developmen t; τ 1 = 7hr , τ 2 = 16hr fixed by data on cell doubling times; h 0 = 0 . 2 fixed for simplicity as heteroplasmy v ariances are normalised; δ λ = 0 fixed to av oid v arying selective pressure). The ‘turno ver’ parameter, described in the text, is P 6 i =3 τ 0 i ν i , a measure of the total random turnov er in the mtDNA p opulation. 20 Age 3 3 4 4 4 4 8 8 9 9 9 24 37 37 40 n 25 30 21 13 13 11 30 34 20 17 36 25 24 20 20 E ( h ) 0.501 0.419 0.183 0.337 0.382 0.354 0.301 0.559 0.193 0.245 0.049 0.457 0.566 0.276 0.238 V ( h ) 0.00256 0.00359 0.00824 0.01308 0.00913 0.00461 0.00350 0.00631 0.00408 0.00301 0.00097 0.00625 0.01000 0.00913 0.00662 V 0 ( h ) 0.0102 0.0147 0.0551 0.0585 0.0387 0.0202 0.0167 0.0256 0.0262 0.0163 0.0210 0.0252 0.0407 0.0457 0.0364 h × 100 40.8 26.5 7.4 16.7 26.9 25.1 18.2 38.7 8.3 13.3 1.7 32.5 38.0 12.8 8.9 43.4 30.6 7.6 23.1 28.8 25.7 22.0 41.7 9.3 16.9 1.7 32.6 39.2 13.8 12.1 44.1 31.8 7.9 24.0 29.4 29.1 23.7 43.9 10.8 20.1 1.8 37.1 45.9 15.9 13.9 44.2 33.2 9.6 24.4 29.8 30.8 23.9 46.4 13.5 20.2 1.9 37.1 50.9 16.6 15.7 46.6 36.4 9.7 26.8 30.2 36.5 24.6 47.5 13.5 20.2 2.0 38.0 51.0 20.3 18.8 46.7 37.7 10.3 27.0 36.7 36.7 25.9 47.9 15.8 21.3 2.8 39.5 51.7 20.6 19.1 46.9 37.9 12.4 28.6 37.1 38.2 26.0 49.5 16.3 23.7 2.8 40.0 51.7 21.8 19.5 47.4 38.7 14.3 39.8 40.2 38.3 26.2 51.4 16.4 24.9 2.9 41.1 51.8 23.6 20.8 48.0 39.2 14.8 40.4 40.5 40.4 26.3 51.5 18.4 25.2 2.9 43.0 52.0 23.8 22.5 48.4 39.5 16.0 41.9 43.6 43.6 26.9 52.8 18.7 26.2 3.0 43.7 54.1 26.2 22.7 48.5 39.7 17.0 42.9 45.8 44.8 26.9 52.8 20.7 27.0 3.0 43.7 54.2 28.3 23.2 48.7 41.4 17.1 50.1 46.7 27.8 52.9 20.7 27.3 3.0 44.2 54.4 29.6 23.4 49.3 42.1 18.6 52.8 60.5 28.9 53.2 21.3 27.6 3.0 44.5 54.9 32.6 27.8 50.3 42.6 19.7 29.1 53.2 21.8 27.8 3.3 46.3 55.3 33.1 28.9 50.5 42.7 20.8 29.7 53.5 23.8 28.2 3.3 46.6 55.7 33.1 29.4 50.6 42.7 25.7 29.9 53.9 24.2 30.0 3.5 47.0 57.2 34.5 30.1 50.8 42.9 25.7 30.1 54.2 26.5 36.7 3.5 49.1 57.5 38.4 30.9 51.2 43.8 26.4 30.7 55.2 26.5 3.7 49.8 59.9 40.5 34.8 53.7 44.5 28.3 31.3 56.0 26.8 3.8 50.1 61.1 42.2 35.2 54.5 44.7 35.6 31.7 56.2 32.1 3.8 51.8 64.8 43.9 39.4 55.0 44.8 39.3 32.6 57.1 4.0 53.0 69.9 56.2 45.9 33.0 57.3 4.0 54.3 74.1 56.6 47.0 33.4 59.8 4.9 55.7 76.1 59.0 47.6 33.6 60.0 5.5 55.7 76.5 62.0 48.7 34.7 60.1 5.8 66.2 48.7 34.9 61.3 5.9 48.8 35.3 61.3 6.0 48.9 35.8 62.1 6.1 49.1 41.2 65.6 6.7 49.7 48.5 67.1 7.9 68.3 8.2 69.2 8.3 69.4 8.5 70.1 8.8 11.6 16.6 T able 2: New heteroplasmy measurements from the HB mo del system. Heteroplasmy measurements and statistics from the HB mo del system. Ages are given in days after birth. 6 Bottlenec king mec hanisms and further exp erimen tal elucidation Here we summarise p oten tial mec hanisms for the b ottleneck that conflict with our statistical interpretation, highlighting the reasons for the conflict. W e also prop ose further exp eriments that would efficiently provide more evidence to distinguish these hypotheses. 6.1 Other prop osed mechanisms Random partitioning of homoplasmic mtDNA clusters. Ref. [18] suggests a less p o werful depletion of m tDNA cop y n umber during early developmen t than assumed b y other studies, with heteroplasmy v ariance increase instead b eing explained by the partitioning of clusters of mtDNA at cell divisions. How ever, the time p erio d ov er which Refs. [12] and [16] observ e increasing heteroplasm y v ariance corresponds to a situation in which germ line cells are largely quiescen t, immediately suggesting that partitioning at cell divisions cannot explain increasing v ariance (as cell divisions do not o ccur). F urthermore, results from our mo del suggest that, unless these clusters are very small, this mechanism would immediately lead to a rather higher and sharp er increase in heteroplasmy v ariance than observed. Replication of a specific subset of m tDNAs during folliculogenesis. Ref. [12] prop oses a mec hanism in which only a subset of m tDNAs replicate during folliculogenesis. There are several sp ecific dynamic schemes by which this mec hanism could b e manifest. The first that w e consider inv olves the following scenario: at some p oint during developmen t, around the start of folliculogenesis, a sp ecific subset of m tDNAs in eac h cell is ‘marked’ as able to replicate (we next consider the case in which this subset is more plastic with time). In this case, the effect of ‘switching off ’ replication of a subset of m tDNAs dep ends on the balance of replication and degradation rates of the mtDNA p opulation: • Low replication, low degradation. In this case, the p opulation stays largely static; the switching off of replication has little effect, and the heteroplasmy v ariance cannot increase to the levels observed in exp erimen t. • Low replication, high degradation. In this case, the high degradation rate ensures that the non-replicating mtDNAs are remo ved from the cell, pro viding a ‘b ottlenec k’ as only the replicating mtDNAs remain. How ever, this regime yields a transien t p eriod of m tDNA copy num b er depletion, while the non-replicating mtDNAs are degrading but the (small) p opulation of replicating agen ts remains low. This copy num b er depletion is not observed. • High replication, high degradation. In this case, non-replicating m tDNAs are remo ved and replicating mtDNAs are capable of fast enough replication to survive the transient drop in copy n umber. How ev er, the rates asso ciated with this mec hanism are necessarily high enough such that the increase in heteroplasm y v ariance is very sharp, notably more so than the smo oth increase with time observed in exp erimen t (see, for example, Fig. 2A in the Main T ext). 21 • Com bined subset replication, and/or heteroplasmic cluster inheritance, with and random dynamics. Our approac h do es not provide supp ort against a model combining our inferred mechanism (increased random turno ver of m tDNAs) with some other dynamic schemes, namely (a) that in whic h only a subset of mtDNAs may replicate during folliculogenesis, and/or (b) where heteroplasmic mtDNA clusters, rather than individual mtDNAs, are the units of inheritance. A combination with (a) would allo w the reduction of the key parameters asso ciated with each: so the rate of random turnov er could be lo wer, and the proportion of replicating genomes larger, than in the case of the pure incarnations of those respective mechanisms. This scheme may th us pro vide a viable alternativ e – ho wev er, it requires an in tro duction of t wo coupled mechanisms, which exp erimen tal data curren tly cannot disam biguate. F or this reason and for parsimon y , we rep ort the case where random dynamics alone are resp onsible, and b elo w suggest exp erimental proto cols to further elucidate this p ossible link or its absence. A combination with (b) is p ossible and cannot b e discounted using the av ailable data, as the tra jectories of heteroplasm y v ariance under (b) and under binomial inheritance are the same. W e prop ose observ ations of mito c hondrial ultrastructure and mtDNA lo calisation during developmen t to resolve this remaining mechanistic question. 6.2 Observ ation of a subset of replicating genomes Ref. [12] p erforms BrU lab elling to observe the prop ortion of mito chondria replicating in primary o o cytes b etw een P1-4 (21-25 dp c on our time axis). The observ ations contained therein (Fig. 2 in Ref. [12]) show a small subset of BrU-lab elled mito c hondrial fo ci compared to the ov erall p opulation of mito c hondria lab elled with another dye. Here we show that this observ ation is compatible with (and exp ected from) our prop osed mo del of random mtDNA turnov er. Consider a population of mtDNAs replicating with rate λ and degrading with rate ν . W e mo del the BrU lab elling assay as follows. At time t = 0, w e b egin the BrU lab elling, which we conserv ativ ely mo del as a p erfect pro cess, so that ev ery m tDNA that replicates b ecomes lab elled. W e contin ue this lab elling until t = t ∗ , when we observe the prop ortion of lab elled m tDNAs. F or simplicity , we will consider a fixed p opulation of m tDNAs of size N , though this reasoning extends to changing p opulation size. W e denote by l the num b er of lab elled mtDNAs. After BrU exp osure, this n umber may c hange in three w ays: (A) a replication even t inv olving a previously unlab elled mtDNA will pro duce tw o new lab elled mtDNAs; (B) a replication even t inv olving a previously labelled m tDNA will pro duce one new lab elled mtDNA; (C) a degradation even t in volving a labelled m tDNA will remov e one lab elled m tDNA. The dynamics of lab elled m tDNA n umber during BrU exposure are given by dl dt = ( A ) + ( B ) + ( C ) (11) = 2 λ ( N − l ) + λl − ν l (12) Assuming that l = 0 at t = 0, the solution of this equation, for the num b er of lab elled mtDNAs at time t ∗ , is l = 2 N λ λ + ν 1 − e − ( λ + ν ) t ∗ (13) Assuming a constant p opulation size requires λ = ν . The conclusions of this illustrative study do not substantially change if w e allo w ( λ 6 = ν ) and hence an increasing or decreasing p opulation. W e consider the v alues of λ and ν required to yield v alues of l comparable with those found in Ref. [12]. W e will roughly estimate these v alues, based on the proportion of lab elled fo ci observ able, as l = 0 . 5 N for 24h BrU exp osure (half of observed m tDNAs being labelled) and l = 0 . 05 N for 2h BrU exp osure (5% of observed mtDNAs b eing lab elled). A v alue of λ = ν = 0 . 014 hr − 1 yields l = 0 . 49 N at t ∗ = 24hr and l = 0 . 055 N at t ∗ = 2hr. Fig. 3D in our Main T ext gives the p osterior distribution on ν , c haracterising the rate of random mtDNA turnov er in our mo del, at different times. It can b e seen that a v alue of ν = 0 . 35 day − 1 comfortably falls within the region of high p osterior densit y during the time range 21-25 d.p.c – lying immediately b efore the strong increase in random turnov er that our mo del subsequen tly predicts. Our inferred mechanism of random mtDNA turno ver is th us compatible with the observ ations of a lab elled subset of mtDNAs in the BrU incorp oration assay in Ref. [12] – we would exp ect to see roughly the observ ed labelling prop ortion simply due to the likely rates of random mtDNA turnov er inferred at that stage of dev elopment. F urthermore, w e can use this line of reasoning to pro duce a testable prediction: similar exp erimen ts carried out several days later – when random mtDNA turnov er is inferred to increase substantially – should show a larger subset of lab elled mtDNAs for the same BrU exp osure. 22 Measuremen t Purp ose MtDNA cop y n umber before and after cell divisions and/or v ariance of copy number b et ween daughter cells T o elucidate mec hanism of mtDNA partitioning and whether this partitioning is deterministic or sto c hastic. Copy num b er tra jectories with differen t mtDNA hetero- plasmies T o assess the mo dulation of copy number dynamics by mtDNA heteroplasmy via retrograde signalling. Measurement of mean heteroplasmy through developmen t, with a v ariety of mtDNA type pairings T o assess and quantify to what extent selection mo dulates mtDNA dynamics during germline developmen t Copy num b er measurements after upregulation of mi- tophagy T o assess the presence and strength of compensatory mec h- anisms that may act to preserv e m tDNA cop y num ber – and hence whether upregulating mitophagy will act to in- crease mtDNA turnov er or simply low er copy num b er. Heteroplasmy variance after upregulation of mitophagy T o assess the efficacy of mitophagy for increasing the p o wer of the b ottlenec k. Heteroplasmy distribution in cells after the b ottlenec k from sampled/known initial heteroplasm y T o confirm predictions for threshold crossing and statistics between generations. BrU incorp oration in o ocytes b et ween 30 and 40 dpc T o confirm the random turnov er mechanism: we exp ect a large proportion of BrU incorp oration subset of mtDNAs to b e observed in this time p erio d (see Section 6.2). Mitochondrial ultrastructure and mtDNA localisation dur- ing developmen t T o assess and characterise any p oten tial mo dulation of the size of units of mito c hondrial inheritance by mito c hondrial dynamics through dev elopment, in particular, inv estigating whether there is time-v arying modulation of cluster size at points of division. T able 3: Exp eriments for further elucidation of the m tDNA b ottlenec k. 6.3 Exp erimen tal elucidation In T able 3 we list sev eral classes of p oten tial exp erimen tal proto cols that w ould assist in further elucidation of the b ottle- nec king mechanism and our predictions. Poten tially useful results include further characterisation of the microscopic detail underlying mtDNA dynamics during developmen t, confirmation of our random turno ver mo del, assessing degree to whic h heteroplasm y mo dulates cop y n umber dynamics and exploring our predictions relating mitophagy and b ottlenec king p o wer. 7 Mitophagy regulation The results from our mo del suggest a p oten tial clinical pathw ay for increasing heteroplasm y v ariance, and thus the p o w er of the bottleneck to remo ve heteroplasmic cells. W e ha ve sho wn that upregulation of m tDNA degradation (for example, through increasing mitophagy) leads to low er mtDNA cop y num b ers and greater heteroplasmy v ariance. It is unclear whether a given treatmen t will ha ve the sole effect of upregulating mitophagy: it seems lik ely that compensatory mec hanisms (which w e do not explicitly mo del, but may include retrograde signalling [67]) will engage to stabilise mtDNA copy num b er. Ho wev er, suc h mechanisms would most straightforw ardly b e exp ected to act through increasing mtDNA proliferation, thus having the net effect of increasing mtDNA turnov er. W e hav e shown that suc h an increase in turnov er also increases the heteroplasmy v ariance in a p opulation. W e therefore propose that upregulating mitophagy ma y b e a fruitful pathw a y of in vestigation for increasing b ottlenec king p o wer, either as a standalone effect or due to the action of comp ensatory mechanisms it ma y inv ok e. Sp eculativ ely , p oten tial strategies to upregulate mitophagy may include the limited use of uncouplers to accelerate the mitophagy normally inv olved in qualit y control [68]; targetted c hemical treatments with agents that hav e b een identified as regulating mitophagy , including glutathione in y east [69] and C 18 -p yridium ceramide in human cancer cells [70]; mo dulation of mito c hondrial ultrastructure and dynamics to upregulate fission, intrinsically linked to the pro cess of mitophagy [37, 71]; or the use of existing drugs which hav e b een found to mo dulate mitophagy , such as Efavirenz [72]. 8 Heteroplasm y statistics W e hav e defined heteroplasmy by h = M 2 M 1 + M 2 . (14) T o find statistics for this quantit y we consider the T a ylor expansion of a function f ( X 1 , X 2 ) of tw o random v ariables X 1 , X 2 ab out a p oin t ( µ 1 , µ 2 ), where µ i = E ( X i ). W e assume that the moments of X i are well-defined and b oth hav e zero probabilit y mass at X i = 0. The T aylor expansion is: f ( X 1 , X 2 ) = f ( µ 1 , µ 2 ) + f 1 ( µ 1 , µ 2 )( X 1 − µ 1 ) + f 2 ( µ 1 , µ 2 )( X 2 − µ 2 ) + higher order terms , (15) 23 where f i denotes the deriv ative of f with resp ect to X i . W e truncate the expansion at first order for later algebraic simplicit y , noting that ev en with this level of precision, the agreemen t betw een the resulting analysis and n umerical sim ulation is exce llen t. Then E ( f ( X 1 , X 2 )) = E ( f ( µ 1 , µ 2 ) + f 1 ( µ 1 , µ 2 )( X 1 − µ 1 ) + f 2 ( µ 1 , µ 2 )( X 2 − µ 2 ) + ... ) . (16) W e note that E ( X i − µ i ) = 0, so E ( f ( X 1 , X 2 )) ' f ( µ 1 , µ 2 ) . (17) Similarly , V ( f ( X 1 , X 2 )) = E (( f ( X 1 , X 2 ) − E ( f ( X 1 , X 2 ))) 2 ) (18) ' E (( f ( X 1 , X 2 ) − f ( µ 1 , µ 2 )) 2 ) (19) = E (( f 1 ( µ 1 , µ 2 )( X 1 − µ 1 ) + f 2 ( µ 1 , µ 2 )( X 2 − µ 2 )) 2 ) , (20) and noting that E (( X i − µ i ) 2 ) = V ( X i ) we obtain V ( f ( X 1 , X 2 )) ' ( f 1 ( µ 1 , µ 2 )) 2 V ( X 1 ) + ( f 2 ( µ 1 , µ 2 )) 2 V ( X 2 ) + 2 f 1 ( µ i , µ 2 ) f 2 ( µ 1 , µ 2 ) C ( X 1 , X 2 ) , (21) where C ( X 1 , X 2 ) is the cov ariance of X 1 and X 2 . If we now use f ( X 1 , X 2 ) = X 1 X 2 , we hav e f 1 = X − 1 2 , f 2 = − X 1 X − 2 2 ; so E ( X 1 /X 2 ) ' E ( X 1 ) / E ( X 2 ) (22) V ( X 1 /X 2 ) ' V ( X 1 ) / E ( X 2 ) 2 + E ( X 1 ) 2 V ( X 2 ) / E ( X 2 ) 4 − 2 E ( X 1 ) C ( X 1 , X 2 ) / E ( X 2 ) 3 . (23) If X 1 = M 2 and X 2 = M 1 + M 2 , and M 1 and M 2 are indep enden t (due to the lac k of coupling betw een the mtDNA sp ecies), C ( X 1 , X 2 ) = V ( M 2 ), and so E ( h ) = E ( M 2 ) E ( M 1 ) + E ( M 2 ) (24) V ( h ) = E ( M 2 ) E ( M 1 ) + E ( M 2 ) 2 × V ( M 2 ) E ( M 2 ) 2 − 2 V ( M 2 ) E ( M 2 )( E ( M 1 ) + E ( M 2 )) + V ( M 1 ) + V ( M 2 ) ( E ( M 1 ) + E ( M 2 )) 2 ! , (25) 9 Deriv ation of analytic results for binomial mo del Generating function within a cell cycle. T o make analytic progress describing the mito c hondrial con tent of quiescent cells, and within a single cell cycle of dividing cells, we use a birth and death mo del to describ e mito c hondrial evolution. Without cell divisions, the dynamics of a p opulation of replicating and degrading entities is giv en by the master equation dP ( m, t ) dt = ν ( m + 1) P ( m + 1 , t ) + λ ( m − 1) P ( m − 1 , t ) − ( ν + λ ) mP ( m, t ) , (26) P ( m, 0) = δ m m 0 , (27) with P ( m ) the probability of observing the system with a copy num b er m at time t , and m 0 the initial copy num b er. The corresp onding generating function, using the transformation G ( z , t ) = P m z m P ( m, t ), ob eys ∂ G ( z , t ) dt = ( ν (1 − z ) + λ ( z 2 − z )) ∂ G ( z , t ) ∂ z (28) G ( z , 0) = z m 0 , (29) whic h is straightforw ardly s olv ed by 24 G 0 ( z , t | m 0 ) = ( z − 1) ν e ( λ − ν ) t − λz + ν ( z − 1) λe ( λ − ν ) t − λz + ν m 0 (30) ≡ [ g ( z , t )] m 0 , (31) where the 0 subscript signifies that no divisions ha ve o ccurred, and we hav e sp ecifically lab elled the base of G 0 as g 0 for later conv enience. Generating function o ver cell divisions. W e no w consider a system undergoing cell divisions. Now, we hav e a p opulation of organelles with time ev olution describ ed by a generating function G = [ g ] m 0 and sub ject to binomial partitioning at cell division. The probability distribution of m after a single cell division is: P 1 ( m, t | m 0 ) = ∞ X m 1 ,b =0 m 1 ,b X m 1 ,a =0 P 0 ( m, t | m 1 ,a ) m 1 ,b m 1 ,a 2 − m 1 ,b P 0 ( m 1 ,b , τ | m 0 ) , (32) where m i,a , m i,b mean resp ectively the num b er of individuals after and b efore the i th cell division, and the subscript in P 0 denotes the fact that this function refers to time evolution within a cell cycle (with no division). The sum takes in to account all p ossible configurations of the system up to the cell division then all p ossible configurations afterwards, with weigh ting according to a binomial partitioning. This line of reasoning can straightforw ardly b e extended to n cell divisions [62]: P n ( m, t | m 0 ) = ∞ X m n,b =0 m n,b X m n,a =0 ... ∞ X m 1 ,b =0 m 1 ,b X m 1 ,a =0 P 0 ( m, t | m n,a ) n − 1 Y i =1 Φ i , (33) where Φ i is a ‘probability propagator’ of the form Φ i = m i,b m i,a 2 − m i,b P 0 ( m i,b , τ | m i +1 ,a ) , (34) and m n +1 ,a ≡ m 0 . F or clarity , we in tro duce the nomenclature: 0 X i,j ≡ ∞ X m i,b =0 m i,b X m i,a =0 ... ∞ X m j,b =0 m j,b X m j,a =0 (35) No w consider the generating function of P n : G n ( z , t | m 0 ) = X m z m P n ( m, t | m 0 ) (36) = X m 0 X n, 1 z m P 0 ( m, t | m n,a ) n − 1 Y i =1 Φ i (37) = 0 X n, 1 G 0 ( z , t | m n,a ) n − 1 Y i =1 Φ i (38) = 0 X n − 1 , 1 ∞ X m n,b =0 m n,b X m n,a =0 [ g 0 ( z , t )] m n,a m n,b m n,a 2 − m n,b | {z } binomial term P 0 ( m n,b , τ | m n − 1 ,a ) n − 2 Y i =1 Φ i (39) = 0 X n − 1 , 1 ∞ X m n,b =0 z }| { 1 2 + g 0 ( z , t ) 2 m n,b P 0 ( m n,b , τ | m n − 1 ,a ) | {z } generating function with transformed v ariable n − 1 Y i =1 Φ i (40) ≡ 0 X n − 1 , 1 z }| { G 0 ( z 0 , τ | m n − 1 ,a ) n − 2 Y i =1 Φ i , (41) where we hav e used the iden tity P b a =0 x a b a 2 − b ≡ 1 2 + x 2 b and changed v ariables z 0 = 1 2 + g 0 ( z ,t ) 2 . Comparing Eqns. 38 and 41 and follo wing this process b y induction w e can see that the ov erall generating function is G n = h m 0 0 , where h is the solution to the recursive system 25 h i = g 0 1 2 + h i +1 2 , τ (42) h n = g 0 ( z , t ) . (43) h i is of the form ah i +1 + b ch i +1 + d (from Eqn. 30). This expression takes the form of a Riccati difference equation and can b e solv ed exactly after Ref. [73]. The solution is straightforw ard but algebraically length y , and we defer presentation of the full pro cedure to a future tec hnical publication. The ov erall solution is: G C ( z , t, n ) = h 0 = 2 n ( l − 2)( λz − ν ) + l 0 ( z − 1)(( λ (2 n − l n ) − ν l n ( l − 2))) λl 0 ( z − 1)(2 n + l n − l n +1 ) + 2 n ( l − 2)( λz − ν ) (44) where the C subscript denotes cycling cells, and l = e ( λ − ν ) τ (45) l 0 = e ( λ − ν ) t (46) Generating function for different phases. W e now consider how to extend this reasoning to the ov erall b ottlenec king pro cess, which in general may in volv e sev eral phases of quiescent and cycling dynamics with different kinetic parameters. W e b egin with the generating function bases g i ( z , t ) for each regime i . F or consistency with the ab o ve approach, w e lab el phases starting from a zero index, so the first phase corresp onds to i = 0, and we use i max to denote the lab el of the final phase. Then we use h i max = g i ( z , t ) (47) h i = g i ( h i +1 , 0) (48) G ov erall = h m 0 0 , (49) using induction ov er the differen t phases in the w ay w e used induction ov er different cell cycles ab ov e. Here w e consider the changeo ver b et ween regimes by using the generating function at the start of the incoming phase. The appropriate generating function bases for quiescent (Eqn. 30) and cycling (Eqn. 44) cells can b e written as g Q ( z , t | m 0 ) = A Q z + B Q C Q z + D Q , (50) g C ( z , t, n | m 0 ) = A C z + B C C C z + D C , (51) with co efficients A Q = ν l 0 − λ (52) B Q = ν − ν l 0 (53) C Q = λl 0 − l 0 (54) D Q = ν − λl 0 (55) A C = 2 n λ ( l + l 0 − 2) − l n l 0 ( λ + ν ( l − 2)) (56) B C = l n l 0 ( λ + ν ( l − 2)) − 2 n ( λl 0 + ν ( l − 2)) (57) C C = − λl n l 0 ( l − 1) + 2 n λ ( l + l 0 − 2) (58) D C = λl n l 0 ( l − 1) − 2 n ( λl 0 + ν ( l − 2)) , (59) using, as b efore, l = e ( λ − ν ) τ and l 0 = e ( λ − ν ) t . Note that the cycling co efficien ts reduce to the quiescen t co efficien ts when n → 0 and τ → 0. The v alues of the appropriate A, B , C , D co efficien ts for a given dynamic phase th us follow straigh tforwardly from the kinetic parameters of that phase, with the appropriate choice b et w een quiescen t and cycling parameters b eing made. If we now lab el these co efficien ts with a subscript denoting the appropriate phase of b ottlenec king, so that, for example, A i is Eqn. 56 with λ i , ν i , n i replacing λ, ν, n , we can write: 26 h i max = A i max z + B i max C i max z + D i max (60) h i = A i h i +1 + B i C i h i +1 + D i (61) g ov erall = h 0 . (62) F ollowing this recursion for n phases of b ottlenec king and simplifying the resultant multi-la yer fraction gives rise to the solution g ov erall = h 0 = A 0 z + B 0 C 0 z + D 0 , (63) where A 0 B 0 C 0 D 0 = n Y i =1 A i B i C i D i (64) from which G ov erall = g m 0 ov erall follo ws straightforw ardly . The following results will b e of assistance: E ( m ) = d dz A 0 z + B 0 C 0 z + D 0 m 0 z =1 = m 0 ( A 0 D 0 − B 0 C 0 ) A 0 + B 0 C 0 + D 0 m 0 − 1 ( C 0 + D 0 ) 2 (65) d 2 dz 2 A 0 z + B 0 C 0 z + D 0 m 0 z =1 = m 0 ( B 0 C 0 − A 0 D 0 ) A 0 + B 0 C 0 + D 0 m 0 ( B 0 C 0 ( m 0 + 1) + A 0 (2 C 0 + D 0 (1 − m 0 ))) ( A 0 + B 0 ) 2 ( C 0 + D 0 ) 2 (66) = − A 0 + B 0 C 0 + D 0 ( A 0 + B 0 ) 2 ( B 0 C 0 ( m 0 + 1) + A 0 (2 C 0 + D 0 (1 − m 0 ))) E ( m ) . (67) As Eqns. 52-55 can b e though t of as sp ecial cases of Eqns. 56-59, w e combine Eqns. 56-59 into Eqn. 64, and, simplifying, w e find the following relations: A 0 + B 0 = C 0 + D 0 = Y phase i 2 n i ( l i − 2)( λ i − ν i ) (68) A 0 D 0 − B 0 C 0 = Y phase i 2 n i ( l i − 2) 2 l n i i l 0 i ( λ i − ν i ) 2 ; (69) w e then immediately obtain E ( m ) = m 0 Y i 2 n i ( l i − 2) 2 l n i i l 0 i ( λ i − ν i ) 2 4 n i ( l i − 2) 2 ( λ i − ν i ) 2 (70) = m 0 Y i 2 − n i l n i i l 0 i (71) V ( m ) = − ( B 0 C 0 ( m 0 + 1) + A 0 (2 C 0 + D 0 (1 − m 0 ))) Q i 4 n i ( l i − 2) 2 ( λ i − ν i ) 2 E ( m ) + E ( m ) − E ( m ) 2 (72) lea ving us only with the problem of calculating the expression ( B 0 C 0 ( m 0 + 1) + A 0 (2 C 0 + D 0 (1 − m 0 ))) in the v ariance calculation. W e were not able to dramatically simplify this expression and so, for clarity , write: Φ = − ( B 0 C 0 ( m 0 + 1) + A 0 (2 C 0 + D 0 (1 − m 0 ))) , (73) whic h gives us: V ( m ) = Φ E ( m ) Q i 4 n i ( l i − 2) 2 ( λ i − ν i ) 2 + E ( m ) − E ( m ) 2 . (74) 27 W e note that Φ is just a notational simplification and is straightforw ardly calculable by inserting Eqns. 56-59 into Eqn. 64 then computing Eqn. 73. Constan t p opulation size. F or generality , we consider enforcing a constan t p opulation size in p ost-mitotic cells (not undergoing divisions). This pro cess in volv es setting λ = ν , so the net gain in m tDNA is zero. If we write λ = ν + and take the limit → 0, Eqn. 30 b ecomes G c,post ( z , t ) = ν tz − z − ν t ν tz − 1 − ν t m 0 . (75) T o enforce a constant mean p opulation size in mitotic cells, it is necessary to balance the exp ected loss of mtDNA through rep eated divisions with an exp ected increase during the cell cycle. This balance can b e accomplished by setting λ = ν + ln 2 τ . W riting λ = ν + ln 2 τ + and taking the → 0 limit w e obtain G c,mito ( z , t ) = 2 ν τ ( z − 1) − 2 t/τ ( z − 1) (( n 1 + 2) ν τ + n 1 ln 2) + z ln 4 2 ν τ ( z − 1) − 2 t/τ ( z − 1)( n 1 + 2)( ν τ + ln 2) + z ln 4 m 0 . (76) In b oth these cases, the same approach as ab ov e can b e used to derive momen ts of the resulting probability distributions. Explicit distributions. The probabilit y of observing exactly m mtDNAs of a giv en t yp e can be f ound from the generating function with P ( m, t ) = 1 m ! ∂ m ∂ z m G ( z , t ) z =0 . (77) W e can use Leibniz’ rule on a generating function of form G = A 0 z + B 0 C 0 z + D 0 m 0 b y setting f ≡ ( A 0 z + B 0 ) m 0 , g ≡ ( C 0 z + D 0 ) m 0 and writing ∂ m G ∂ z m = m X k =0 m k ∂ k f ∂ z k ∂ ( m − k ) g ∂ z ( m − k ) (78) = m X k =0 m k ( A 0 ) k ( A 0 z + B 0 ) m 0 − k m 0 ! ( m 0 − k )! ( C 0 ) m − k ( C 0 z + D 0 ) ( − m 0 − m − k ) ( − 1) m − k ( m 0 + m − k − 1)! ( m 0 − 1)! . (79) Enforcing z = 0 and rewriting in terms of a hypergeometric function gives P ( m, t ) = 1 m ! ( − 1) m ( B 0 ) m 0 ( C 0 ) m ( D 0 ) − m − m 0 ( m 0 + m − 1)! ( m 0 − 1)! 2 F 1 − m, − m 0 ; 1 − m − m 0 ; A 0 D 0 B 0 C 0 . (80) The distribution of heteroplasmy is then given by P ( h ) = ∞ X m 1 =0 ∞ X m 2 =0 P ( m 1 , t | (1 − h 0 ) m 0 ) P ( m 2 , t | h 0 m 0 ) I m 2 m 1 + m 2 , h , (81) where I ( h 0 , h ) is an indicator function returning 1 if h 0 = h and 0 otherwise. Computing the probability of observing a giv en heteroplasm y thus inv olves a sum, ov er all m tDNA states that corresp ond to that heteroplasmy , of the probabilit y of that state. The ev aluation of h yp ergeometric functions is more computationally demanding than that of more com mon mathematical functions, and the infinite sums at first glance seem intractable. How ever, in practise and using parameterisations from our inferential approach, v anishingly little probability density exists at m 1 , m 2 > 5 × 10 5 , corresp onding to the biological observ ation that mtDNA copy num b er is v ery unlikely to exceed this v alue. Dynamic programming then allo ws these sums to b e p erformed straightforw ardly . Finally , the computation of P ( m = 0 , t ) is imp ortan t in our analysis of the c haracterisation of key distributions using the first t wo moments (see below), where it appears as P ( m 2 = 0 , t ), the probability of wildtype fixation. This is relatively straigh tforward to address analytically as when m = 0, Eqn. 77 reduces to P (0 , t ) = G ov erall | z =0 , which in the notation ab o v e is simply: ζ ≡ P (0 , t ) = B 0 D 0 m 0 , (82) 28 where we introduce the notation ζ for fixation probability for later brevit y . W e could not dramatically simplify the full expression so we leav e it in this form and note that it can b e readily calculated (as ab o ve) b y inserting Eqns. 56-59 in to Eqn. 64 then computing Eqn. 82. Multiple sp ecies and heteroplasmy . The heteroplasmy h = m 2 / ( m 1 + m 2 ) is straigh tforwardly addressable by considering the ab o ve solutions for m 1 and m 2 . W e can also consider a more general case, in which we hav e four sp ecies of m tDNA in our mo del: wildtype repro ducing ( m 1 ), mutan t repro ducing ( m 2 ), wildtype sterile ( m 3 ) and mutan t sterile ( m 4 ). W e assume that these sp ecies evolv e in an uncoupled wa y with time. The parameter h 0 , initial heteroplasmy , determines the initial prop ortion of mutan t genomes: h 0 = m 20 + m 40 m 0 , where m 0 = m 10 + m 20 + m 30 + m 40 is the total initial copy num b er of mtDNA. The parameter α determines the prop ortion of genomes capable of repro ducing: α = m 10 m 10 + m 30 = m 20 m 20 + m 40 . W e compute the time tra jectories for all m i then calculate heteroplasmy by setting M 1 = m 1 + m 3 , M 2 = m 2 + m 4 , resp ectiv ely the total num b ers of wildtype and m utant m tDNAs, and using Eqns. 24 and 25, where all means and v ariances are straightforw ardly extracted from the ab o v e analysis. 10 Characterisation of distributions of imp ortan t quantities with momen ts W e are interested in the probability with whic h heteroplasmy h exceeds a certain threshold v alue h ∗ . This probability can b e computed using Eqn. 81 ab o ve, but the large sums of hypergeometric functions suggest that a simpler approximation of the heteroplasmy distribution may b e desirable, b oth for computational simplicity and in tuitive interpretabilit y . W e here explore how well distributions of copy num b er and, imp ortantly , heteroplasmy are c haracterised by quan tities that are easily obtained from our analytic approaches without large summations: sp ecifically , low-order moments E ( m ) , V ( m ), and fixation probabilities P ( m = 0). F or mo derate initial heteroplasm y 0 . 7 > h 0 > 0 . 3, all distributions are w ell matc hed by the Normal distributions computed using the first t wo moments E ( m ) and V ( m ). This matc h b egins to fail as initial heteroplasmy decreases or increases to the exten t where fixation of one mtDNA type b ecomes likely . The resultant non-negligible probability densit y at h = 0 and/or h = 1 represents a truncation p oin t which forces skew on the distributions (particularly P ( h )) and weak ens the Normal appro ximation. W e can make progress by considering P ( h ) to b e a weigh ted sum of a truncated Normal distribution N 0 ( µ, σ 2 ) (truncated at 0, 1; and with currently unknown parameters µ, σ ) and t wo δ -functions at h = 0 and h = 1 represen ting the fixation probabilit y of wildtype and mutan t mtDNA resp ectiv ely . If we write P N 0 ( h ) for the probability densit y at h of such a truncated Normal distribution, we hav e: P ( h ) = (1 − ζ 1 − ζ 2 ) P N 0 ( h ) + ζ 1 δ ( h ) + ζ 2 δ ( h − 1) , (83) where ζ 1 = P ( m 2 = 0 , t ) is the fixation probability of the wildt yp e and ζ 2 = P ( m 1 = 0 , t ) is the fixation probability of the m utant, expressions for which were computed previously in Eqn. 82. Kno wledge of the parameters µ, σ that describ e the truncated Normal part of this distribution will then provide us with a b etter estimate of P ( h ). W e can use the relations E ( h ) = R h P ( h ) dh and V ( h ) = R h 2 P ( h ) dh − E ( h ) 2 . As δ ( h ) provides a nonzero con tribution to these integrals only when h = 0, the contribution from this part of P ( h ) is alwa ys zero; then, E ( h ) = Z h ((1 − ζ 1 − ζ 2 ) P N 0 ( h ) + ζ 2 δ ( h − 1)) dh (84) = (1 − ζ 1 − ζ 2 ) E ( N 0 ) + ζ 2 (85) V ( h ) = Z h 2 ((1 − ζ 1 − ζ 2 ) P N 0 ( h ) + ζ 2 δ ( h − 1)) dh − E ( h ) 2 (86) = (1 − ζ 1 − ζ 2 ) V ( N h> 0 ) + E ( N h> 0 ) 2 − E ( h ) 2 + ζ 2 (87) where E ( N 0 ), V ( N 0 ) are resp ectiv ely the mean and v ariance of the truncated Normal distribution, and in the final line we ha ve used the fact that V ( N 0 ) = R h 2 P N 0 ( h ) dh − E ( N 0 ) 2 . Results are known [74] for moments of the truncated Normal distribution: E ( N 0 ) = µ + σ f ( α 1 ) − f ( α 2 ) F ( α 2 ) − F ( α 1 ) (88) V ( N 0 ) = σ 2 1 − α 1 f ( α 1 ) − α 2 f ( α 2 ) F ( α 2 ) − F ( α 1 ) − f ( α 1 ) − f ( α 2 ) F ( α 2 ) − F ( α 1 ) 2 ! (89) 29 0 1 2 3 4 5 6 7 0 0.2 0.4 0.6 0.8 fixed 0 0.2 0.4 0.6 0.8 1 P(h) P(h=0 ) h h = 0 .01 0 1 2 3 4 5 6 7 8 9 10 0 0.2 0.4 0.6 0.8 fixed 0 0.2 0.4 0.6 0.8 1 P(h) P(h=0 ) h h = 0 .05 0 1 2 3 4 5 6 0 0.2 0.4 0.6 0.8 fixed 0 0.2 0.4 0.6 0.8 1 P(h) P(h=0 ) h h = 0 .1 0 0.5 1 1.5 2 2.5 3 3.5 4 4.5 0 0.2 0.4 0.6 0.8 fixed 0 0.2 0.4 0.6 0.8 1 P(h) P(h=0 ) h h = 0 .2 0 0.5 1 1.5 2 2.5 3 3.5 4 0 0.2 0.4 0.6 0.8 fixed 0 0.2 0.4 0.6 0.8 1 P(h) P(h=0 ) h h = 0 .3 0 0.5 1 1.5 2 2.5 3 3.5 0 0.2 0.4 0.6 0.8 fixed 0 0.2 0.4 0.6 0.8 1 P(h) P(h=0 ) h h = 0 .4 Figure 9: Comparison of truncated Normal approximation with exact heteroplasmy distribution. Representa tions of heteroplasmy distributions at a time t = 21dp c, with various starting heteroplasmies, using (as an example) the maximum likelihoo d parameterisation emerging from the inference procedure in the main text. Dark lines and bars sho w exact distributions from Eqn. 81; pale lines and bars show distributions arising from the truncated Normal distribution describ ed in the text. where, in our case (with truncations at h = 0 and h = 1) α 1 = − µ/σ , α 2 = (1 − µ ) /σ and f ( x ) = ( √ 2 π ) − 1 exp( − x 2 / 2) and F ( x ) = 1 2 (1 + erf( x/ √ 2)) are resp ectiv ely the p.d.f. and c.d.f. of the standard Normal distribution. Given these expressions, w e wish to inv ert these Eqns. 85 and 87 to find µ and σ , the parameters underlying the truncated Normal distribution, giv en E ( h ), V ( h ) and ζ 1 , 2 = P ( m 2 , 1 = 0), which w e can compute (see b elow). W e hav e not b een able to find an analytic solution for these equations; how ever, numerically solving these equations is computationally far cheaper than p erforming the numeric simulations required to better c haracterise the real distribution. W e then obtain an expression for P ( h ), which w ell matches the exact distribution deriv ed using Eqn. 81 (see Fig. 9). Threshold crossing. The probabilit y of crossing a threshold heteroplasmy h ∗ with time is simply given b y the probabilit y densit y in the region h > h ∗ . W e can then use the result P ( h > h ∗ ) = (1 − ζ 1 − ζ 2 ) 1 − 1 2 1 + erf ( h ∗ − µ ) / √ 2 σ 2 + ζ 1 (1 − δ ( h ∗ )) + ζ 2 (1 − δ ( h ∗ − 1)) , (90) for threshold crossing, which follows straigh tforwardly from considering the in tegrated density of the model distribution (Eqn. 83) of h ab ov e h ∗ , with parts from the error function represen ting the definite in tegral of the truncated Normal part of the distribution, with additional terms from wildtype fixation (if h ∗ 6 = 0) and mutan t fixation (if h ∗ 6 = 1). Inferring embry onic heteroplasmy . The probability that a sample measurement h m came from an embry o with heteroplasm y h 0 can b e found from Ba yes’ Theorem: P ( h 0 | h m ) = P ( h m | h 0 ) P ( h 0 ) P ( h m ) . (91) W e assume a uniform prior distribution P ( h 0 ) = ρ on embry onic heteroplasm y (though this can b e straightforw ardly generalised). P ( h m ) is giv en b y the integral ov er all p ossible embry onic heteroplasmies of making observ ation h m , so we obtain 30 P ( h 0 | h m ) = ρ P ( h m | h 0 ) R 1 0 dh 0 0 ρ P ( h m | h 0 0 ) dh 0 0 (92) = (1 − ζ 1 − ζ 2 ) N 0 ( h m | µ, σ 2 ) + ζ 1 δ ( h m ) + ζ 2 δ ( h m − 1) R 1 0 dh 0 0 ((1 − ζ 1 − ζ 2 ) N 0 ( h m | µ, σ 2 ) + ζ 1 δ ( h m ) + ζ 2 δ ( h m − 1)) , (93) where the µ, σ 2 momen ts characterising the truncated Normal distribution are found numerically as ab o ve (for each h 0 0 v alue in the integrand, which is p erformed numerically); and ζ 1 , ζ 2 are also functions of h 0 . 31
Original Paper
Loading high-quality paper...
Comments & Academic Discussion
Loading comments...
Leave a Comment