Where You Are Is Who You Are: User Identification by Matching Statistics
Most users of online services have unique behavioral or usage patterns. These behavioral patterns can be exploited to identify and track users by using only the observed patterns in the behavior. We study the task of identifying users from statistics…
Authors: Farid M. Naini, Jayakrishnan Unnikrishnan, Patrick Thiran
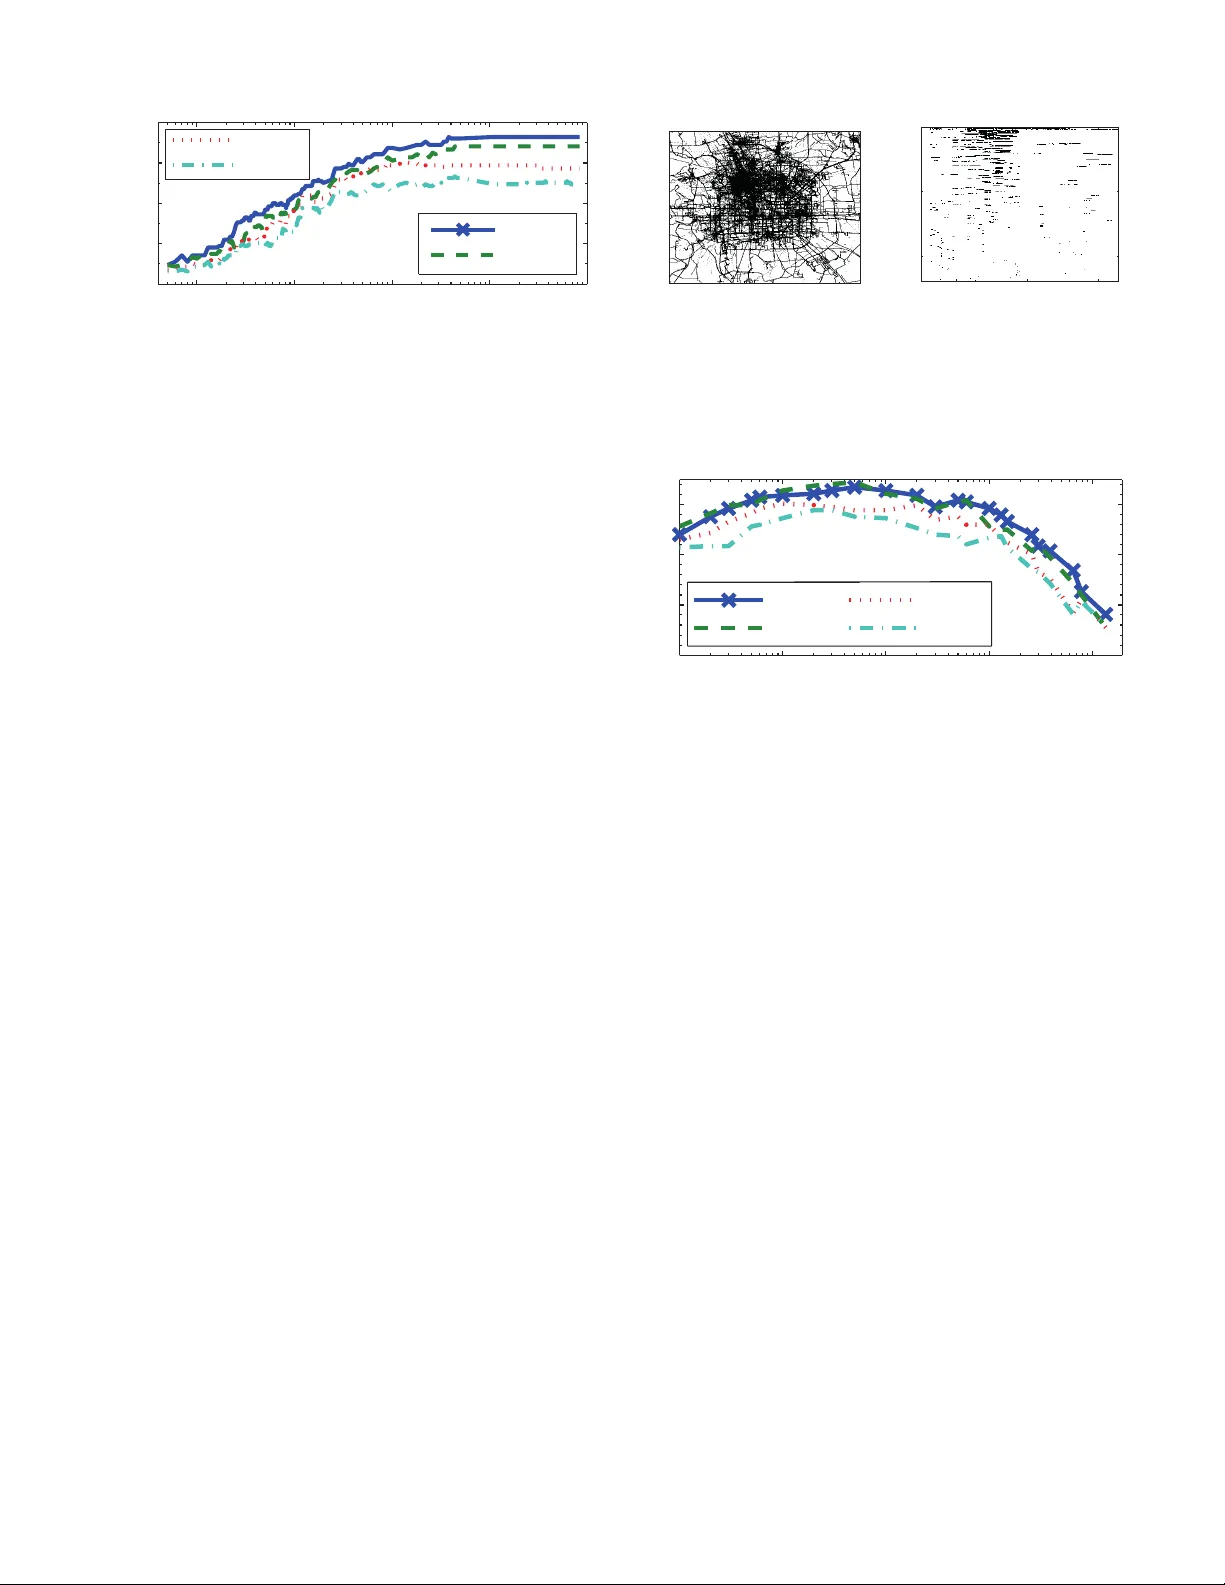
1 Where Y ou Are Is Who Y ou Are: User Identificati on b y Matchi ng S tatistic s Farid M. Na ini, J ayakrishna n Unnikrishnan, Membe r , IEEE , Patrick Thiran, F e llow , IEEE , and Martin V etterli, F ellow , IEEE Abstract —Most users of onlin e ser vices h a ve uniq ue behavio ral or usage patterns. These beha vioral patterns can be exploited to identify and tra ck users by using only the observed patterns in the behav ior . W e study the task of identifyin g users fr om statistics of their behav ioral patterns. Specifically , we focus on the settin g in which we ar e giv en histograms of u sers’ data collected during two d ifferent experiments. W e assume th at, in th e first dataset, the users’ identities are anonymized or hidden and that, in the second dataset, th eir id entities are known. W e stud y the task of identifying t he u sers by matching the histograms of their data in the first d ataset with th e histograms from the second dataset. In recent works [ 1], [2] th e optimal algorithm fo r this user identification task is introduced. In this paper , we ev aluate the effectiv eness of this meth od on t hree different types of datasets with up to 50 , 000 users, and in multiple scenarios. Usin g datasets such as call data records, web browsing histories, and GPS trajectories, we demonstrate that a lar ge f raction of users can be easily identified given only histogra ms of th eir data; hence these histograms ca n act as users’ fingerprints . W e also verify th at simultaneous iden tification of users achieves better perf ormance compared to one-by-one user iden tification. Fu rthermore, we show that using the opt imal method f or identification indeed giv es higher iden tification accuracy than heuristics-based approaches in practica l scenarios. The accuracy obtained under thi s opti mal method can thu s be used to quantify the maximum level of user identification that is possible in such settings. W e show that the key factors affecting the accuracy of the optimal identifi cation algorithm ar e the du ration of the data collection, the number of users in the anonymized dataset, and the resolution of th e dataset. W e also analyze the effectiv eness of k -anonymization in resisting u ser iden tification attacks on t hese datasets. 1 Index T erms —Data priv acy , De-anonymization, Identification of persons I . I N T R O D U C T I O N A com mon task in data analysis is to id entify users b y exploiting statistics of their data. In many app lications, we have access t o some info rmation ab out a set o f users fro m o ne source, and som e other info rmation about the s et of user s fro m another source, an d the task is to match pieces of informatio n from the first source to piece s of informatio n f rom the second source that corr espond to the same u nderly ing user . I f the identities of the users in the two sets are known, then this Copyri ght (c) 2013 IEEE. Personal use of this material is permitted. Ho we ver , permission to use this material for an y other purposes must be obtaine d fro m the IEEE by sendi ng a request to pubs-permissions@i eee.or g. F . M. Naini, J. Unnikrishnan, P . Thiran, and M. V etterl i are with EPFL, Lausanne, Switze rland. E-m ail: f arid.nain i@alumni.ep fl.ch, dr .j.unnikrishnan @ieee.or g, patric k.thiran@e pfl.ch, and mar- tin.ve tterli @epfl.ch. 1 Follo wing the principle of repr oducibl e r esearc h , the code for performing user matching a nd for genera ting the figures re lated to the publicly a vail able dataset s are ma de a vail able for d own load a t rr .epfl.ch . is a trivial task. Howev er , in many p ractical application s, the identities of the users are unk nown eithe r in the first set or in the second set or in b oth; therefo re, in such c ases, the task beco mes n on-trivial. For example, the two datasets might co ntain info rmation abo ut locatio n statistics of users in a city m easured over d istinct time per iods. Th e first set can be obtained by tr acking cell phone connection s to cell- towers and the secon d set can b e obtained from credit-card usage pattern s. In this ca se, the task is to iden tify the correct matching from the user s’ p hone n umbers to their credit ca rd number s. Another example of the matching pr oblem is relevant to datasets collected from the same service during two dif f erent time periods. F or instance, the users on a website might choose to chang e their on line user identities fo r p riv acy p urposes; but given th e statistics of the users’ data me asured prior to the cha nge a nd af ter the ch ange, it might still be possible to identify the users by matchin g the statistics acr oss the two time per iods. Matching users betwee n two da tasets incr eases the net inf ormation available abou t the users, which in turn is useful for providing better targeted advertisements and recommen dations for produ cts an d services [3] . The problem of matching users is also relev ant in the context of p riv acy of an anonymized database. In recent years, many datasets contain ing informatio n about individuals h ave been released into the p ublic d omain in ord er to provide op en access to statistics or to facilitate data-minin g research. Often these databases are an onymized by suppressing identifiers tha t reveal the identities of th e users, such as n ames o r socia l security num bers. Nevertheless, r ecent research has revealed that the p riv acy offered by such anonym ized databases co uld be compr omised, if an adversary corr elates the revealed in- formation with auxiliary inf ormation about the users from publicly av ailab le databases. A famo us example of such a de- anonymization attack was shown in [4], in which anonym ous movie ratings released durin g the Netflix Prize contest were de-ano nymized by using public user r evie ws from the I nternet Movie Da tabase (IMDB). In such attacks, the ad versary’ s task of de -anonymizatio n is essentially a matching task. The objec- ti ve is to identif y users in the an onymized dataset b y m atching their data to the p ublicly av a ilable auxiliary inf ormation . As the question of matchin g users is relev ant in many applications, th is pr oblem has been studie d by m any auth ors in different fields, inclu ding da tabase manage ment [5], info r- mation retriev a l [6], n atural langua ge pr ocessing [7], author identification [8], [9], and pr iv acy [4]. Nevertheless, mo st solutions to the matching problem rely o n heu ristics th at are relev an t for specific applications, but not for other app lications. 2 (a) Unlabel ed histograms (Da y 1 ) User Location Dorm. Rest. Lib . ? 75% 15% 10% ? 31% 30% 39% ? 15% 15% 70% ? 15% 65% 20% (b) Labeled histogr ams (Day 2 ) User Location Dorm. Rest. Lib . John 33% 33% 34% Jill 70% 20% 10% Mary 15% 60% 25% Mike 15% 20% 65% T ABLE I A N I L L U S T R ATI V E E X A M P L E O F U S E R I D E N T I FI C ATI O N TA S K ON H I S T O G R A M S . L O C AT I O N S TA T I S T I C S I N TH E F O R M O F HI S T O G R A M S O F S O M E US E R S A R E R E L E A S E D ( I N ( A ) ) , WH E R E T H E U S E R I D E N T I T I E S A R E R E M OV E D . A N A D V E R S A R Y H A S AC C E S S TO S O M E AU X I L I A RY H I S T O G R A M S ( I N ( B ) ) A B O U T TH E S A M E U S E R S W H E R E T H E U S E R I D E N T I T I E S A R E K N O W N . T H E T I M E P E R I O D D U R I N G WH I C H T H E H I S T O G R A M S I N ( A ) AR E CO L L E C T E D D O E S NO T OV E R L A P W I T H T H E TI M E P E R I O D D U R I N G W H I C H TH E HI S T O G R A M S I N ( B ) A R E C O L L E C T E D . T H E O B J E C T I V E O F T H E A DV E R S A RY I S TO M ATC H T H E U S E R S ( I . E . , RO W S ) AC R O S S T H E T W O T A B L E S . In this paper, we present a sy stematic study of the matching problem u nder a general setting. The pro blem we st udy dif fe rs from typ ical approa ches in d ata analy sis in that we focus on the setting in which the available infor mation abo ut a user ’ s data is in the form o f histograms of th e user’ s data. Th e histograms capture the h abits of the user s. I n the case of mobility traces, such histogr ams c ould b e the average time spent by ea ch user at different loca tions during a d ay , o r during different time inter vals. In so me application s, such as urban planning, the d ata collected naturally co ntains only the statistics of the data, as they are sufficient f or suc h applications. In other app lications, the data is intentionally stripped of timin g information to enh ance the pr i vacy of the users; in which case, all t hat r emains are h istograms. W e s tudy the problem of matching histograms of users’ data measured in two independen t exper iments as a hypoth esis testing p roblem . This novel for mulation has the advantage of makin g it possible to rigoro usly define the accuracy of a matching scheme and to iden tify an algorithm that is p rovably more accu rate than other schem es. An example of a user identification task, is to consider a dataset comprised of u nlabeled location histograms, gi ven in T able I(a), where th e u ser identities are re moved. Now consider an a dversary who has access to the labele d loca tion histograms of the same u sers in an indep endent experiment where the u ser id entities are known (r efer to T ab le I (b)). This inf ormation cou ld be obtain ed, for instance, by trackin g the u sers during a different time-p eriod com pared to tho se in T ab le I(a). The histog rams co rrespon ding to each user in the two tables are expecte d to be similar, as the habits of the user are expected to r emain the same across the two datasets; but they might not be exactly iden tical due to the inherent randomn ess in the user’ s behavior . T he objectiv e of the adversary is to match th e user identities (i.e., the rows) across the two tables. In the next section, we provide a detailed co mparison of this prob lem with existing literature on user identification and highligh t the n ew contr ibutions of this work . W e state the problem in math ematical form and prop ose our solu tion in Section III. W e exper imentally ev aluate our solution by using three different datasets in Sectio n IV. In Section V, we analyze the ef ficacy of our algorithm if add itional p riv acy enha ncing technique s, such as k -anonym ization, ar e app lied to histograms of u sers’ data. W e co nclude th e pap er with some discussion s in Section VI. I I . R E L AT E D W O R K A N D C O N T R I B U T I O N S The user m atching studied in this paper is clo sely related to se veral problems that have been studied in oth er different commun ities. In this section, we p resent a comp arison of our approac h with related problem s fr om several areas, an d highligh t ou r contributions r elativ e to existing work. A. Entity res olution A match ing problem studied in the da tabase comm unity is that of identifying different d ata r ecords that refer to the same real-world object [5]. Similarly , in natural-lan guage processing, the p roblem of link ing different mentions of the same u nderlyin g entity in text [7] is analogou s to th e ob jectiv e in the user-matching p roblem . Anoth er exam ple fro m the informa tion-retrieval literature is th e prob lem of classifying docume nts by their authors, given docu ments from d ifferent authors with th e same name [6]. User matching h as also been stu died in the social-networks commu nity in wh ich the objective is to id entify d ifferent pro files that belong to th e same under lying user [10]. Su ch prob lems fall und er the umbrella- term entity r esolu tion (ER) [11]. In these pr oblems, the av ailable inf ormation abo ut the user s is often not in the form of histogr ams, and the solutions proposed are often based on h euristics an d pr actical convenience; wh ereas th e solution we propo se in this paper is specific to the setting in which the on ly inform ation av ailable ab out the users is in the form of h istograms, and in this setting , the solution is optimal for minimizing the pr obability of m isclassification. B. De-an onymization a ttacks Our work is also c losely r elated to the literature on de- anonymization methods [4], [1 2] studied in th e literatur e on priv acy . A n umber of works on de-an onymization f ocus on demonstra ting that ev en when u sers’ data ar e anonymized, the data belonging to each user is often unique. In such e xamples, an adversary who has access to auxiliary inform ation about the users can de-an onymize the anonymized datasets by exploiting the uniqueness of the data belongin g to each user . For example, in [ 13] the a uthors perf orm a stud y on the top k locations most freq uently visited by users in a nationwid e call-data record (CDR) d ataset. Th ey con sider various levels of spatial granular ity (such a s sector , cell, z ip c ode, c ity , state, and country ) and te mporal gr anularity ( such as day an d mo nth), and th ey show that the most f requen tly visited loca tions can act as qua si-identifiers to re- identify anonymous u sers. Thus an adversary can de-ano nymize such a dataset by obtaining access to auxiliary inf ormation about the users’ zip code s and times of activity . The ad versary’ s goal is essentially a matching task, i.e., the adversary seek s to match the auxiliary inform ation about the users with th e uniq ue aspects o f the users’ d ata. Some o ther work s such as [13]–[1 9] study the uniq ueness of 3 mobility data traces. The re is a line o f work o n studying the uniquen ess of web browsing history patterns of u sers [20], [21]. In [20] the au thors co nsider a dataset wh ere e very r ecord is the set of visited web sites by a user during some period o f time. The auth ors investigate how uniq ue is a single user’ s record comp ared to other u sers’ recor ds in the d ataset. Although o ur w ork is related to d e-anonymiza tion, it d iffers in sev eral aspects. First, we assume that the on ly informatio n about the users in the two datasets are time-a veraged statistics of the u sers’ data. In most works on user match ing and de- anonymization [4], [ 22], [23], the v ulnerab ility to privac y breaches o ften arises due to the spa rsity o f the temporal ev olu tion of the users’ d ata. For instance, the fact th at a user watched an d r ated a movie dur ing a p articular time -period or was at a spe cific lo cation during a particular time can b e used to easily iden tify th e u ser’ s data f rom the anonymized dataset. Other d e-anonym ization works focus on identify ing the temporal patterns of the data collected from the users. For example, in [17], [ 18], a Markov model is con structed based on the temporal ev olutio n of the mobility p atterns of the users, and then similarity measures are used for de-anonymizatio n. Such temp oral in formatio n in the u sers’ data, however , is removed w hen only statistics in the fo rm of h istograms fro m each user is c ollected or released. Of ten this results in a mu ch lower u niquene ss i n the information av ailable about the users; hence matching users’ statistics is, in gener al, much more difficult tha n matching users’ datasets. Second, we assume that the two sets of the statistical in- formation are mutually statistically indep enden t. For e xample, in the case of mo bility data, th is could be becau se the two datasets were o btained ov er d ifferent time period s. W e seek to perfor m the match ing by o nly exploiting th e fact that users’ habits rem ain stationary an d ergodic across th e two datasets. This is in contrast to the appr oach of work s such as [15], [16], [2 4] th at p erform de-a nonymization by u sing aux iliary informa tion collected over the same p eriod of time as th e anonymized d ataset. In suc h cases, th e auxiliary in formatio n is not indep enden t of the an onymized user data. In [20], the authors in vestigate the stability of the set of visited web sites by a u ser across time. In par ticular, th ey record th e set o f visited websites by a user during on e d ay . T hey use the Jaccard in dex to measur e the similarity between the sets collected for one user over different da ys. They show that the set of v isited websites by a user is stable during a four-week p eriod. A special case of our work is when the labeled and unlabeled histograms are o btained from the sam e source in d ifferent time periods. The accuracy of our match ing alg orithm in suc h cases is dep enden t o n how how muc h the statistical characte ristics of the data is preserved over time. Third, we perform simultaneous matching o f the informa- tion av ailab le abo ut all users and not one user at a tim e. Simultaneou s matching takes into accoun t all the info rmation av ailable abo ut the users at the same time, and h ence ou t- perfor ms m atching users one at a time. Simultaneou sly taking into a ccount a ll the information for various attack s h as alread y been employed in different domains [9], [25]– [27] and in th is paper we em ploy it in the dom ain of histogram match ing. There is also a related line of work on graph d e- T r aining histograms T est histogram (a) Histogr am classification T r aining histograms T est histograms (b) Histogr am matching Fig. 1. (a) The problem of histogram classificati on, which is to to classify the test histogram to the corre ct class based on the training histograms. (b) The problem of histogram matching studied in this paper , which is to simultane ously classify the test histog rams to the training h istograms subject to the constra int that each test histogram belong s to a dist inct cla ss. anonymization , also k nown as grap h alig nment [2 2], [23], [28]. It is the p roblem of m atching the no des across two similar g raphs, where th e only available information is th e two graphs. For example, given the graph o f co nnection s between users o n two different social ne tworks (e.g., Facebook and LinkedIn), it mig ht be p ossible to match user s across th e two social networks by exploitin g the fact that the structure of the underly ing graphs ar e expected to b e similar . This prob lem is different from that studied in the present p aper bec ause, in our setting, th e graph- based co nnection s among th e u sers are n ot av ailable. C. Supervised lea rning The ma tching task stu died in th is pa per is c losely related to the classification task studied in supervised learning [2 9], where th e o bjective is to classify test data to the corr ect class based on labeled train ing data obser ved unde r each o f the classes. Nevertheless, a key aspect o f o ur ap proach th at differs from supervised learning is that we seek to simultaneously classify test data that b elong to a group of u sers subject to the constraint that each user belong s to a distinct class (refer to Figure 1). Thus ou r solution , originally in troduced in [1], [2 ], can be inter preted as a solutio n to a constrained classification problem . Our solution is tailored to the setting in which the av ailable infor mation is in t he form of histograms. It could be possible to extend this solutio n to mo re general k inds of data by comb ining the matching algorith m presented in this work with feature extractio n techniques in m achine learning [2 9]. D. Contributions Compared to existing works on the user-matching problem, our work is unique in se veral respects. Ou r main contributions can be summarized as f ollows: • W e dem onstrate that statistics a bout users’ behaviors contain a significant amou nt of informatio n that can be used as fingerprints to uniq uely iden tify users, by an adversary wh o has access to aux iliary informatio n about the users. M oreover , we sho w th at identification by using only data statistics can sometimes result in acc uracy higher than existing methods based on more complicated data mode ls (e.g., Markov Cha ins). 4 • W e e valuate a provably op timal algorithm for matching users’ statistics on thr ee datasets of diverse nature and demonstra te that it outperfor ms heu ristics-based methods. W e addre ss the p ractical setting of p erform ing the matc h- ing across distinct sets o f users. • W e comp are the perfor mance of o ur algorith m with different parameters and under different settings, such as user c onfigur ation an d data r esolution. W e verify th at, in particu lar , matchin g users simulta neously leads to a matching accuracy significantly higher than ma tching one user at a time . • W e analyze the p erforma nce o f the match ing algorithm under different p riv acy-p reserving mech anisms su ch as data obfu scation and k - anonymization . I I I . P RO B L E M S TA T E M E N T A N D P R O P O S E D S O L U T I O N W e assume that the data belon ging to each user in o ur system follows some fixed underlying probab ility law that is unknown a priori. The prob ability law associated with each user is u nique and captures th e habits of the u ser . For example, in the case of web- browsing histor ies, the pro bability law captures th e user’ s relative p referen ces for various we bsites. Similarly , in the case of shopping d ata, the prob ability law could rep resent shopp ing preferen ces and, in th e case of mobility data, the law could rep resent the pr eference s for visiting various location s. I n th e basic version of the user- matching p roblem, we are g iv en two datasets correspond ing to the sam e set of users, and the task is to match user s acro ss the two datasets by exploiting th e fact that the un derlying probab ility law of each u ser is u nique. W e will later generalize this to the setting in wh ich th e two datasets belo ng to dif f erent sets o f users. Throu ghou t this paper, we focus on the spec ific setting in which each dataset reveals on ly the histogra ms o f each user’ s da ta and not the data itself. W e use the term adversary to denote the entity th at per forms th e u ser-matching task. W e use feminin e pron ouns fo r ref erring to the users and masculine prono un for referr ing to the adversary . In th e following, we state the problem math ematically . A. Pr ob lem statement Consider a d iscrete alphabet set S = { S 1 , S 2 , . . . , S K } of size |S | = K and a set of N users labe led 1 , 2 , . . . , N . The set S represen ts the set of a ll possible values that c an be taken by each instance o f the d ata belonging to each user . For example, in the case of web-b rowsing data, S is the set of all websites that a user could visit, and in the case of mob ility data, S is the set of a ll possible location s (e.g ., regions o f a city) that a user co uld visit. For the pur pose of illustration, in the rest o f this section, we will fo cus on the example of mo bility data. For a data string s = [ s (1) , s (2) , . . . , s ( T )] ∈ S T of length T , we use Γ s to denote the histogr am (i.e. , empirical distribution) o f the string defined as Γ s ( l ) = 1 T T X t =1 I { s ( t ) = S l } , l = 1 , 2 , . . . , K . (1) In the simplest version of the user -matching problem studied in this paper, we are given tw o sets o f histograms of the data g en- erated b y e ach o f th e user s. Le t set ψ 1 = { Γ x 1 , Γ x 2 , . . . , Γ x N } represent a set of unlab eled histogram s each generated by a distinct user, an d let ψ 2 = { Γ y 1 , Γ y 2 , . . . , Γ y N } repr esent a set of labeled h istograms each g enerated by a distinct u ser . Here ψ 1 and ψ 2 represent the histograms contained in two datasets. In the case of mob ility data, ψ 1 is a set of anonymized histograms of users’ mobility tra ces that are released, and ψ 2 represents the auxiliary histog rams of th e users’ mobility traces, which is ob tained by an adversary by tracking the users over a time per iod. I n other application s, the aux iliary histograms ca n b e o btained by the adversary b y u sing pu blicly av ailable inf ormation . In b oth cases, the adversar y is aware of the u sers’ id entities in the second dataset, and seeks to decode the identities of the users in the first ano nymized set of histogram s. T he histogram s of each user are assumed to be statistically indep endent of th ose of others. Furtherm ore, for each user, the histogram gene rated by the user in the first data set is assume d to be inde penden t o f the histogram in the second d ataset. In the m obility example, indep enden ce is a reasonable assum ption provided that there is no overlap between th e time- periods over which the h istograms in ψ 1 and ψ 2 are computed. For example, ψ 1 contains histograms collected over a week and ψ 2 contains h istograms collected over the fo llowing week. In the m atching pro blem, the objective of the adversary is to determine the tr ue match ing between th e histogram s of ψ 1 and ψ 2 . W e repre sent the ground truth via an unk nown permu tation function , σ : { 1 , 2 , . . . , N } 7→ { 1 , 2 , . . . , N } (2) such that, in reality , for ea ch i ∈ { 1 , 2 , . . . , N } , the histog rams Γ x σ ( i ) and Γ y i are generated by the same user i . The ob jectiv e in th e matchin g pro blem is, equiv alently , to estimate σ . In Section II I-D, we d iscuss the p ractical setting where the histograms in the sets ψ 1 and ψ 2 are gen erated by different sets of users. B. P oten tial appr o ach: W eighted b ipartite matching The problem of m atching histogram s across two sets can be best visualized as a matching problem on a bipartite graph. Let G = ( V 1 , V 2 , E ) be a comp lete b ipartite graph where each vertex in the set V 1 (respectively , set V 2 ) is associated with a unique histogram in the set ψ 1 (respectively , set ψ 2 ). There exists an edge from each e lement in V 1 to each eleme nt in V 2 and no edges between elements in V 1 or V 2 . Hence we ha ve a complete bipartite grap h where V 1 and V 2 form the two par ts. Let no de j in set V 1 and n ode i in set V 2 be associated with histogram Γ x j in ψ 1 and Γ y i in ψ 2 , respectively . T he graph G is illustrated in Figur e 2. A matching in graph G is a subset of edges E of G such that no two edges in the subset share a vertex. A maximal matching is a matching suc h that th e additio n of any edge to the subset violates the matching prope rty . Let σ m be a permutation of { 1 , 2 , . . . , N } , for m = 1 , 2 , . . . , N ! . There are N ! possible maximal matchings on G cor respond ing to the N ! different permutatio ns. T he matching co rrespon ding to perm utation σ m is the m atching in which each node i from set V 2 is ma pped to node σ m ( i ) in V 1 ; in o ther words, histog ram Γ y i in ψ 2 is 5 Γ x 1 Γ x 2 Γ x N Γ y 1 Γ y 2 Γ y N w 11 Dataset one histograms ( ψ 1 ) Dataset two histograms ( ψ 2 ) Fig. 2. The problem of m atchin g hist ograms across tw o set s can be visual ized as a matching problem on a weighted bipartite graph. Correspo nding to the N ! dif ferent permutations, there are N ! possible m aximal matchings on G . The green edges represents the correct matching associated w ith σ in (2). The solution can be obtai ned vi a a wei ghted bipartite mat ching algorithm on the graph with appropriate edge weights. mapped to histogr am Γ x σ m ( i ) in ψ 1 . Th e matching associated with σ in (2) is shown b y g reen edges in Figure 2. An intuiti ve approach f or estimatin g the correct ma tching between the histogr ams is as follows. Defin e a weight for e very edge in G such th at the weight of the ed ge w j i from j to i is equ al to some ap propr iately defined distance between the histograms Γ x j and Γ y i , i.e., w j i = d (Γ x j , Γ y i ) (3) for som e d istance mea sure d ( . ) . Now perf orm a min imum- weight maxim al bipar tite match ing o n the resultant weig hted bipartite graph . The minimu m-weight maximal matchin g cor- respond s to a config uration where the sum of the d istances between the match ed histograms is minimum , hence expected to pr ovide a good estimate for the co rrect match ing. The re lev ant q uestions that ar ise h ere are: Wha t is a goo d choice f or the distance mea sure between histograms and does the choice of measure depend on the nature of the data or ca n there be a gener al-purp ose measure? The literature contain s various choices of pr ev alent distance measur es that can be used in the weight function. For example, in [13] the authors use the cosine distance b etween th e histog rams o f the num ber of calls o f users at d ifferent GSM an tennas as a distan ce m easure for a nalyzing th e call behavior of u sers. T he co sine distance between histog rams Γ x j and Γ y i is defines as w cos j i = 1 − Γ x j , Γ y i Γ x j 2 k Γ y i k 2 , (4) where Γ x j , Γ y i is the dot pr oduct betwe en the h istograms, which we denote by w dot j i , w dot j i = Γ x j , Γ y i = K X l =1 Γ x j ( l )Γ y i ( l ) , (5) and k Γ s k 2 = q P K l =1 Γ s ( l ) 2 . An other heuristic measure often used in the m achine learning com munity is the l 1 distance between the h istograms, given by w l 1 j i = Γ x j − Γ y i 1 = K X l =1 Γ x j ( l ) − Γ y i ( l ) . (6 ) Alternatively , we can u se a similarity measure, such as the dot pr oduct defined in (5) a s the weight fu nction in (3). W e then id entify the best per mutation by using a ma ximum we ight matching o n th e r esultant w eighted bipartite grap h. In the next subsection, we present a new cho ice of the weigh t function and argue that it is a jud icious choice. C. Optimal solu tion via hy pothesis testing interpretation The problem of fin ding the matching between the his- tograms of ψ 1 and ψ 2 can be v iewed as a m ulti-hyp othesis testing prob lem with N ! h ypoth eses, { H 1 , H 2 , . . . , H N ! } , where hyp othesis H m correspo nds to p ermutation σ m , for m = 1 , 2 , . . . , N ! . I n the hy pothesis testing framework, we study decision rules by using probability of error under the dif- ferent h ypotheses as the perf ormanc e metric. T yp ical solutio ns to hyp othesis testing problems seek the decision ru le that leads to an optima l trade off between various er ror pr obabilities under the different h ypoth eses. In our prio r works [ 1], [2], we showed that, when each user’ s d ata is ge nerated by an i.i.d. process governed by her probab ility law , an op timal trade- off between th e various erro r probabilities f or the matchin g problem is obtain ed by decidin g in fa vor of the hyp othesis correspo nding to the minimum-weig ht maximal matching on the bipartite g raph G with edge weig hts w j i = D (Γ x j k 1 2 (Γ x j + Γ y i )) + D (Γ y i k 1 2 (Γ x j + Γ y i )) . (7) In (7), D ( ·k· ) is the Kullback-Leibler divergence fu nction [30], defined as D ( π k µ ) = K X l =1 π ( l ) log ( π ( l ) /µ ( l )) . The weight w j i in ( 7) satisfies 0 ≤ w j i ≤ 2 lo g(2) and it is equ al to 0 wh en Γ x j = Γ y i and equal to 2 log (2 ) when the histog rams h av e disjoin t supp ort (i.e., when ∄ l such that Γ x j ( l ) , Γ y i ( l ) > 0 ). The exact optimality result is b ased on an asymptotic analysis o f error probab ilities as the length T of the data strings increases to infinity . I t is shown in [1], [2] that a variant of this test yields optima l trade-o ffs betwe en the err or exponents un der the different hypoth eses. For the sake o f completene ss, we provide the intuition behind the choice o f the metr ic (7) in the following settin g. T o every user i , we associate a prob ability distribution π i ∈ P K − 1 . The pro bability distributions are distinct, which means tha t π i 6 = π m for i 6 = m , b u t th ey a re unknown. Suppose th at ea ch user i gen erates d ata in an i.i.d. man ner fr om the distribution π i . Co nsider a set ψ 1 = { x 1 , x 2 , . . . , x N } of u nlabeled strings of length T each gen erated by a distinct user, and an indepen dent set ψ 2 = { y 1 , y 2 , . . . , y N } of la beled strin gs of length T each g enerated by a distinct user . Let i d enote the user who gen erated strin gs x σ ( i ) ∈ S T and y i ∈ S T where σ is given in ( 2). A comm only used solu tion f or multi-h ypothesis testing problem s is to id entify the maxim um-likelihoo d (ML) hy poth- esis, which is the h ypothe sis under which the log-likeliho od of the observations is maximized. I n our pro blem, however , the under lying probability distributions π i ’ s of the users are unknown, thus th e log-likeliho od has to be r eplaced with 6 the generalized log-likelihoo d. Th e first step is th erefore to compute th e g eneralized log -likelihood. For h ypoth esis H m the gen eralized likelihood is ob tained by maxim izing the likelihood function over all possible c hoices of the π i ’ s, and is given b y L ( H m ) = sup π 1 , π 2 ,..., π N N X i =1 T X t =1 h log π i ( x σ m ( i ) ( t )) + log ( π i ( y i ( t ))) i . (8) It is known that for an i.i.d. -genera ted string , the maximum likelihood estimator of the unde rlying distribution is given by the empirical d istribution of the string . Hence, it is easy to see that each of the N terms in the sum mation (8) is maxim ized by setting π i = 1 2 (Γ x σ m ( i ) + Γ y i ) , for i = 1 , 2 , . . . , N . W e can theref ore rewrite (8) as L ( H m ) = − 2 T N X i =1 n H (Γ x σ m ( i ) ) + H (Γ y i ) + D (Γ x σ m ( i ) k 1 2 (Γ x σ m ( i ) + Γ y i )) + D (Γ y i k 1 2 (Γ x σ m ( i ) + Γ y i )) o , (9) where H ( . ) is the Sh annon entro py fun ction [30], defined as H ( π ) = − P K l =1 π ( l ) log ( π ( l )) . The maximu m generalized likelihood solution is given by b H = arg max H m L ( H m ) . Gi ven the sets o f histograms { Γ x j } and { Γ y i } , the term P N i =1 H (Γ x σ m ( i ) ) + H (Γ y i ) in (9) is a constant ter m that does not depend on the hyp othesis H m . Hence, by removin g this constant ter m we can show that b H = arg min H m D ( H m ) , where D ( H m ) = P N i =1 w σ m ( i ) i with w j i giv en in (7). Hen ce, b H can be in terpreted as the hy pothesis correspo nding to the minimum-weig ht max imal matching on the co mplete bipartite gra ph G in Fig ure 2 with weights (7). Although this optimality result was established for i.i.d. processes, we argue that the solution is a reasonable approach to u se for the matching problem , provided tha t each user’ s habits fo llow a proba bility law that is statio nary and ergodic. In such cases, we expect the histogr ams of each user in th e two datasets to be similar , hence the solution for i.i.d. data is well-ju stified. Therefo re, in this paper, we propose to u se the solution given by the minimum-weigh t ma ximal matching on G with the w eight metric in (7). W e demonstra te, in our exper iments in Section IV, that the matchin g accuracy obtained b y using (7) is indeed higher than those o btained by using (4), (5), and (6) und er various setting s. D. Generalization to d iffer ent sets of distinct users Denote b y U 1 the set of users who g enerate the histogr ams ψ 1 and by U 2 the set o f users who gener ate the histog rams ψ 2 . So far, we have assumed that the two sets of h istograms ψ 1 and ψ 2 are gen erated by the same set of N users; i.e., U 1 = U 2 with | U 1 | = N . In practice, howe ver , the histogram s in s ets ψ 1 and ψ 2 can belong to dif f erent sets of d istinct u sers, that is, U 1 6 = U 2 . When U 1 6 = U 2 , th e ad versary needs to solve the match ing p roblem of ide ntifying the set U 1 ∩ U 2 and o f iden tifying the matching between the labeled a nd th e unlabeled histog rams belo nging to the users in th e set U 1 ∩ U 2 . Our matching solution and optimality result can be extended to the case U 1 6 = U 2 [2]. Let the nu mber of users in sets U 1 and U 2 (i.e, numbe r of histog rams in sets ψ 1 and ψ 2 ) be N an d N ′ , respectively . W e assume that the probab ility l aw of e very user in the set U 1 ∪ U 2 is distinct. W ithout loss of gen erality , we assume that N ′ > N , i.e., there are m ore lab eled histogr ams than unlab eled histograms. First, co nsider the case U 1 ⊂ U 2 . Here | U 1 ∩ U 2 | = N . It represents the scenario where for each u nlabeled histogram in set ψ 1 there exists an associated labele d histogram in set ψ 2 that is generated by the same user, but not vice v ersa. As before we construct the complete bipartite graph G = ( V 1 , V 2 , E ) , where | V 1 | = N , | V 2 | = N ′ , and ed ge weights are as in (7). The gra ph is illustrated i n Fig ure 3( a). A m atching between all the N unlab eled histogra ms and N out o f N ′ of the labeled histograms is a ma ximal m atching on the grap h G . Similarly to the case where U 1 = U 2 , the optimal solu tion is g iv en b y the minimu m-weight maximal match ing in the g raph G . Now consider the m ore gener al case whe re | U 1 ∩ U 2 | = r < N . Furthe rmore, let the value o f r b e kn own to the adversary . This case rep resents the scen ario where some labeled h istograms in set ψ 2 are not associated with any unlabeled histogr ams in ψ 1 and v ice versa. The graph G f or this case is illustrated in Figure 3(b). If the ad versary knows the value o f r , h e can try to match on ly a set of r unlabeled histograms to the labele d histograms such that the two sets are as close as possible to each other . In othe r word s, the adversary ca n try to choose r out of N un labeled histogram s and match them to r out of N ′ labeled histograms such that the summation of the distances b etween th e m atched pairs (given in (7)) is minimized. Such a matchin g can be obtained from a minimum- weight m atching with car d inality r on the gr aph G . This pro blem is also k nown as the minimum- cost imperfect matching [31]. W e experimentally ev aluate this app roach in Section IV -A4. If the adversary does no t know th e value of r , he can still try to match min { N , N ′ } users. Ho wev er this leads to a larger fraction of incorrect matches, as we demo nstrate in the experiments of Section IV - A4. E. Algorithms an d complexity An impo rtant practical aspect of the u ser-matching ta sk is the algorithm f or obtainin g the match ing solution o n the weighted graph G and the associated time-comp lexity . I n Sections III -B and III-D, we discussed thr ee different settings for finding th e matchin g solution between ψ 1 and ψ 2 on the grap h G : (i) case U 1 = U 2 depicted in Figure 2; ( ii) case U 1 ⊂ U 2 depicted in Fig ure 3(a); a nd ( iii) the case | U 1 ∩ U 2 | = r < N depicted in Fig ure 3(b ). W e r equire two kinds of alg orithms to id entify the solu tions: (A1) Alg orithm f or identif ying the minimu m-weight maximal matching on G , (A2) Alg orithm for iden tifying the minimum -weight matching with a fixed card inality r on G . The matching solution on G can be ob tained v ia ( A1) in cases (i) and (ii), and via (A2) in case (iii). W e note that in case of using a similarity m easure such as (5) as the choice of the weight fun ction in G , th e m atching solu tion is identified 7 Γ x 1 Γ x 2 Γ x N Γ y 1 Γ y 2 Γ y N ′ w 11 Histograms ψ 1 Histograms ψ 2 (a) U 1 ⊂ U 2 Γ x 1 Γ x 2 Γ x N Γ y 1 Γ y 2 Γ y N ′ w 11 Histograms ψ 1 Histograms ψ 2 (b) | U 1 ∩ U 2 | = r < N Fig. 3. Matchin g prob lem when t he histograms in sets ψ 1 and ψ 2 belong to dif ferent sets of disti nct users (i.e., U 1 6 = U 2 ). Histog rams belongi ng to users in U 1 ∩ U 2 are marked by black circles and histograms in the sets U 1 \ U 2 and U 2 \ U 1 are marked by black triangl es and squares, respecti vely . In (a), U 1 ⊂ U 2 with | U 1 | = N . The propo sed soluti on is gi ven by the minimum- weight maxi mal matchin g of the graph. In (b ), | U 1 ∩ U 2 | = r < N . In this case, the proposed solution is gi ven by the minimum-weight matching with cardina lity r on the graph. The green edges represent the correct matchi ng betwee n the h istograms i n the set U 1 ∩ U 2 . via the maximu m-weight matching on G . In this case, af ter negating all the edge-weight v alu es an d shifting t hem to m ake them positive, (A1) an d (A2) can b e used to identify the matching solution . The Hun garian algo rithm [32] is a pop ular and efficient al- gorithm for (A1 ) and can be adapted to solve (A2) as explained in [31]. I n ou r experiments, we use the Hungarian algo rithm for (A1 ) and a polynomial-time algorithm, based o n the theory of matroid s (see, e.g., [ 33, Ch. 8] ), for (A2 ). The time- complexity o f obtaining the match ing solution o n the g raph G by using the Hungar ian algorithm is O ( | U 1 || U 2 || U 1 ∩ U 2 | ) ; i.e., it is O ( N 3 ) , O ( N 2 N ′ ) , and O ( N N ′ r ) for (i), (ii), and (iii), respectively . In pr actice, the co mplexity can of ten be r educed significantly . F or instance, when histograms Γ x j and Γ y i have disjoint support, then w j i in (7) ta kes its max imum value, which is 2 lo g (2) . Then th e edge co nnecting the cor respond ing vertices in G can b e removed, a s it will almost certain ly not be selected in the minimum -weight max imal m atching. If the resulting grap h has E ed ges, th en the comp lexity is O ( E | U 1 ∩ U 2 | ) . In a p ractical implem entation o f this d e-anonymiz ation ap- proach , the o verall complexity depen ds on both the complexity of compu ting the edge weights in graph G and of ru nning the matching algorithm (A1) or (A2) on graph G . The former has complexity O ( N N ′ K ) where K is the number of locations. In Section IV -D we present de tailed time-c omplexity r esults of our d e-anonym ization approach . An alternative appr oach for so lving (A1) and (A2) is to use an approximate minimum-weight matching algorithm on grap h G instead of the Hungarian algorithm. Alth ough finding the exact minimum-weigh t match ing solution has the advantage of obtaining the max imum matching accuracy , it brings the inher- ent compu tational com plexity of weighte d bip artite matc hing into our solution. Th is could h inder the app licability o f our solution to very large datasets as the nu mber of histograms becomes very large. An alternative app roach in dealing with very large d atasets is to obtain an a ppr ox imate minimu m- weight ma tching solution on gr aph G [34]. Alth ough this approa ch r educes the match ing accuracy , it makes it possible to find an appr oximate solutio n in reasonab le time. For example by using the approach in [34], a (1 − ǫ ) - approx imate matching solution to (A1) in case (i) can be obtained with complexity O ( N 2 ǫ − 1 log ǫ − 1 ) instead of O ( N 3 ) . I V . E X P E R I M E N TA L E V A L U A T I O N S In this section we compare the performance of the proposed matching algorithm with other meth ods for user identifica- tion. Althoug h numer ous identification algorithms exist in the literature, we perf orm comparison s prim arily with id entifi- cation method s that rely o nly on histogram inform ation as the foc us of this pape r is on suc h methods. Nevertheless, in Section IV -C4 we compa re our approach with an existing Markov-based metho d, for which histog rams ar e o nly a subset of the info rmation available to the meth od. W e sh ow that by using on ly histograms we can still get better de-an onymization accuracy than th e Markov-based app roach th at exploits mor e informa tion fr om the dataset. W e test our matching alg orithms on thr ee d atasets of different nature. The first is a call-data reco rds data set, the second is a web br owsing-history dataset, and the third is a dataset of GPS mobility traces. In our experiments, a location represents the coverage region o f a GSM anten na, a website, and a region o n the map in the fi rst, second, and third dataset, respectively . W e interpret the sequen ce of locations visited by a user as a data string. Th us a u ser’ s histogram is simply the relative fractions o f visits of the u ser to th e different locations, within the time period co nsidered . For each dataset, we co mpute the histogr ams of the users over two different non-overlapp ing time pe riods to obtain the sets ψ 1 and ψ 2 described in Section II I-A. W e th en con struct the com plete bipartite graphs G shown in Fi gures 2, 3(a), and 3( b) and app ly the match ing algorith ms propo sed in Sections III an d III-D on this gra ph with approp riately cho sen edg e-weights. W e estimate the matching ac curacy o btained with the different algorithm s b y calculatin g the percentag e of comm on users (i.e., users in the set U 1 ∩ U 2 ) wh ose histog rams are cor rectly matched. W e recall that we focu s on the priv a cy fro m the perspective of the adversary an d no t of the users; hen ce, this particular choice f or notio n of accuracy is reason able. A. Experiments on call-da ta recor ds (CDR) 1) Dataset descriptio n and prepr o cessing: Th e call-data records (CDR) dataset con sists of anonymized records of phone calls between 5 0 , 000 Or ange cu stomers (i.e., users) in Ivory Co ast [35], ch osen random ly fro m millions of users. The dataset covers th e two-week p eriod fr om Monday 9 th to Sunday 22 nd of Apr il 2012 a nd con tains the tim e of e very call made by e very user and th e identifier o f the a ntenna to which the user was connected whe n mak ing th e call. Figure IV - A1 shows a map of Ivory Coast with the positions of 123 7 antennas in th e cou ntry in dicated by black circles [3 5]. 8 Fig. 4. (a) Position of Orange’ s GSM antennas in Ivory Coast [35]. T he sub-prefec tures are sh own by dif ferent colo rs. Dataset Charac teristic s Choice of metri c in (A1) N K proposed l 1 cosine dot CDR 46986 1211 21 . 1% 18 . 6% 16 . 4% 13 . 3% WBH 121 83 219 90 . 0% 81 . 1% 72 . 7% 64 . 4% GL 154 1024 58 . 4% 51 . 3% 52 . 0% 46 . 8% T ABLE II M AT C H I N G AC C U R A C Y OB TA I N E D O N G I N F I G U R E 2 BY U S I N G ( A 1 ) W I T H VAR I O U S C H O I C E S F O R T H E D I S TA N C E / S I M I L A R I T Y M E A S U R E S B E T W E E N T H E H I S T O G R A M S D E FI N E D I N (7) , (6 ) , (5) , A N D (4) . T H E P RO P O S E D W E I G H T F U N C T I O N C O N S I S T E N T LY Y I E L D S T H E H I G H E S T AC C U R A C Y F O R A L L T H R E E D AT A S E T S . W e first split the CDR dataset into two parts, where par t one correspo nds to the calls made in the first one-we ek period from the 9 th to 15 th of April, and part two correspo nds to the calls made in the second one-week period f rom the 16 th to 22 nd of April. W e then restrict o ur attention on ly to users who are active in both weeks, i.e., the users wh o made at least o ne call in each o f the two we eks. Th ere are N = 4698 6 such users, and overall they connec ted to K = 12 11 antenn as. Each user, on average, made 101 . 2 calls and con nected to 6 . 7 dif ferent antennas. W e consider the coverage region of each an tenna to be a loc ation. W e disregard th e timing inf ormation o f the ca lls and construct th e histograms of the calling patterns of each user in each week. Th us, the h istogram Γ x σ ( i ) (respectively , Γ y i ) of user i in the first (respectively , second) week gives the re lativ e fractions o f calls made by the user in various locations in the first ( respectively , second) week . Th e set ψ 1 (respectively , ψ 2 ) consists o f the histog rams compu ted over the first week (respec ti vely , second week). 2) Matching acc uracy with differ en t metrics: After com - puting the histog rams, we co nstruct the comp lete b ipartite graph G shown in Figure 2 and described in Sec tion III-B. W e choose edg e weights w j i giv en in (7) and comp ute, b y using (A1), a minimum- weight maxim al matchin g on G . The obtained result is shown in the first ro w of T ab le II. Of 4698 6 users, 9927 are correctly matched, which g iv es an accura cy of 21 . 1% . T his m eans that, given the proportio ns of calls of users from different antennas d uring two consecu tiv e wee ks, we are able to co rrectly match mor e th an one-fif th of th em. W e also compare the matching accur acy obtained b y using the distance measure (7) with the accuracy o btained by using the distance measures given in (4) and (6), as w ell as the similarity measure of (5). W e o bserve from the table that the matchin g 10 1 10 2 10 3 10 4 10 40 70 100 Accuracy ( % ) N ψ 1 ψ 2 | ψ 1 | = | ψ 2 | = N proposed l 1 -norm cosine dot Fig. 5. The obta ined av erage ac curac y by using differen t edge weights a s a functio n of the number of users N , in the se tting w here the histogra ms in sets ψ 1 and ψ 2 are genera ted by the same set of N users (i.e., U 1 = U 2 ). The measures are defined in (7), (6), (4), and (5). The 90% confidence interv al is also sho wn for our pro posed metric. W e observ e that inc reasing the number of users N leads to a reduct ion in the matc hing accu racy . accuracy obtained by using the weight fu nction pr oposed in (7) is significantly highe r than that obtained by using any o f the other heuristic measures. W e rem ark that the nai ve approach of deciding on a pur ely random matching between the histog rams yields, o n average, one correctly matched user . The resulting accuracy ( 0 . 00 2% ) is negligible compared to those ob tained in T able II. 3) Effect of varying the nu mber N of users: I n this ex- periment, we keep U 1 = U 2 but vary | U 1 | . W e first ch oose unifor mly at random a subset of the 46986 user s co nsidered in the p revious experiment. W e deno te the subset size by N . W e then choose sets ψ 1 and ψ 2 to be the histog rams associated with the N ch osen users in the first week and the second week, respectively . W e th en apply (A1) to th e graph G of Figure 2 with different cho ices of edge weights. F or ea ch value of N we repea t the expe riment se veral times, ch oosing the sub set random ly and p erform ing th e matching. The obtained average accuracies ar e shown in Figur e 5 as a function o f N f or each choice of edge weight. W e observe from Figure 5 that as the value of N incr eases, the match ing accu racy u nder all metrics decr eases. This is expected becau se as N increases, the hab its of the users start resembling tho se of others, and it bec omes more difficult to d istinguish the histograms of one user from those of oth ers. Henc e, the matchin g accuracy decreases. Furtherm ore, although the 21 . 1% accuracy obtained with the pro posed m etric of (7) in T able II migh t seem sm all at first, it is associated w ith a large value o f N . If the number of users wer e smaller, the a ccuracy would be highe r (e.g., 78% for 10 0 0 users). 4) Matching differ ent sub sets of users: Follo wing the dis- cussion in Section III- D, here we inv estigate the practical scenario wh ere the h istograms in sets ψ 1 and ψ 2 belong to different sets of distinct users. In other words, in this experiment U 1 6 = U 2 . W e first consider the setting in which we are given histograms of all u sers on th e second week b ut only a su bset o f users on the first week . That is, U 1 ⊂ U 2 , as depicted in Fig ure 3(a). W e let ψ 2 be the collection o f histograms o f all th e N = 46986 users on the seco nd week. For ψ 1 we use the collection of histogram s of a rand omly chosen subset of user s on th e first week. W e construct G in Figure 3(a) with edge weights 9 BBBBBBB AAAAAA 10 15 20 25 30 0 2.5 5 7.5 10 10 0 10 1 10 2 10 3 10 4 10 0 x 100 Accuracy ( % ) # corr . matches Number of histograms in t he first dataset ( | ψ 1 | ) ψ 1 ψ 2 Accuracy # corr . matches | ψ 2 | = N | ψ 1 | < | ψ 2 | Fig. 6. The average number of c orrect m atches and the a verage a ccurac y as a functio n of | ψ 1 | in the setting wh ere we are giv en histograms of all users on the second wee k (i.e., | ψ 2 | = N ) bu t only a subse t of users on t he first we ek (i.e., | ψ 1 | < N ). The leftmost point represents one-by-one user matching approac h, which y ields t he smal lest a ccurac y . in (7) and run (A1). Th e resulting matching has a size equa l to | ψ 1 | . The number of corr ectly matched h istograms in the set ψ 1 divided b y | ψ 1 | defines the obtained accuracy . Figu re 6 shows t he average nu mber of correct matches and the a verag e accuracy obtain ed for dif ferent values of | ψ 1 | , where the results are averaged over several rep etitions of the experiment. Th e leftmost po int rep resents one- by-o ne user matching appr oach, which yields the smallest accuracy . Fro m a user’ s perspective, as | ψ 1 | increases, the adversary has more information a vailable and thus ca n obtain a b etter matching . Hence, the obta ined matching accuracy incr eases. This ob servation has important implications in the perspective of priv acy of a nonymized statistics. A user’ s p riv acy d epends not on ly o n how m uch her trajectory is revealed to the adversary , but a lso on how much of others’ trajectories are revealed to th e adversary . In the secon d part of this e x perimen t, we consider the setting where | U 1 ∩ U 2 | = r < N . This is the setting depicted in Figure 3(b). W e choo se u niform ly at random a set of histograms from the first wee k and from the second week, such that | U 1 | = | U 2 | = 500 0 , and | U 1 ∩ U 2 | = 3750 . W e choo se these values as an example. W e th en construct G in Figu re 3(b ) with ed ge weigh ts given in (7). W e first choose 3750 of the unlabeled histogr ams in U 1 and matche d them to 3750 of the labeled histogram s in U 2 , such th at the summation of the d istance between the matched pairs is minimized. W e do this by applying (A2 ) with r = 3 750 to G . Altern ativ ely , we m atch all the 5000 unlabeled histog rams in U 1 to the labeled histogra ms in U 2 by ap plying (A1) to G . The ob tained results a re shown in T ab le III. Althou gh the first appro ach yields a smaller numb er of cor rect match es ( 1340 versus 16 7 2 ) compa red to th e second ap proach , it yields a larger p ercentage of corre ct matches ( 36% versus 3 3% ). Therefo re, it makes sense to use (A2) instead of (A1) when the adversary is interested in maximiz ing his percentage accuracy (i.e., n umber of co rrect m atches divided by th e size of the outputted match ing). 5) Effect of varyin g the time-d uration of d ata collectio n: W e now inv estigate ho w the matchin g accuracy is affected by the time-dur ation over which users’ statistics are comp uted. W e consider all users who were active on ea ch Monday of Algorith m matching size # correct matches Percent age accura cy # inc orrect matches (A2) wi th r = 375 0 3750 1340 36% 2410 (A1) 5000 1672 33% 3328 T ABLE III O B TA I N E D MAT C H I N G R E S U LT F O R TH E C A S E | U 1 ∩ U 2 | = r < N D E P I C T E D I N F I G U R E 3 ( B ) W I T H r = 3750 A N D N = 5000 . C O M PA R E D T O T H E S E C O N D A P P RO A C H , T H E FIR S T A P P R O AC H Y I E L D S A S M A L L E R N U M B E R O F C O R R E C T M AT C H E S B U T A L A R G E R P E R C E N TAG E O F C O R R E C T M ATC H E S . 10 20 30 Accuracy ( % ) T i me duration included i n the dataset Mon Mon–T ue Mon–W ed Mon–Thu Mon–Fri Mon–Sat Mon–Sun ψ 1 ψ 2 | ψ 1 | = | ψ 2 | = N proposed l 1 -norm cosine dot Fig. 7. The obt ained matchi ng accurac y ( N = 30937 ) with dif ferent choices of edge weights as a function of time-durat ion over which users’ statistics are co mputed. The measures are d efined in (7), (6), (4), and (5). As long as users’ habits remain stationary and ergodi c, by increasing the time-du ration ov er which st atistic s are computed, histograms b elongin g to each user become closer to each other , and thus t he o veral l matc hing accur acy in creases. the two-week period, i.e., u sers who made at least one call on Mo nday 9 th and on Monda y 1 6 th of Apr il. There are N = 30937 such users. In the first part of this experimen t, the set ψ 1 (respectively , ψ 2 ) co rrespon ds to the histogram s of the number o f calls o f this N u sers from th e K locations (i.e., GSM antennas) dur ing the fir st Monday (respectively , second Monday ). W e then co nstruct graph G illustrated in Figure 2 with different choices of edg e weights, an d r un (A1 ). The obtained accuracy , mar ked o n the x-axis by “Mon ”, is shown in Figure 7. In the second part of this exp eriment, we in crease the time- duration over wh ich we compute u sers’ statistics. W e compu te the statistics of the same N users dur ing the Monday an d T uesday of the first week and of the secon d week . Th us, the set ψ 1 (respectively , ψ 2 ) n ow correspon ds to th e histog rams o f the number of calls of the N users fro m the K lo cations during the first ( respectively , second) Monday and T uesday . W e th en construct the grap h G with different ch oices of edge weights and ru n (A1). Th e obtain ed matching accu racy , marked by “Mon-Tue”, is shown in Figur e 7. Similarly , we incre ase the number of con sidered d ays for every user and repeat th e experiment. The se results are shown in the figur e as well. As can b e s een from Figur e 7, the ma tching acc uracy increa ses as we inclu de mo re days in the d ataset. Th is is becau se as lo ng as u sers’ hab its rem ain stationary and ergodic, b y incr easing the time-du ration over which statistics are co mputed , the two histograms belonging to each user become closer to each other, and thus the o verall matchin g accu racy increa ses. Furthermore, the matc hing accuracy obtained by using the weigh t function propo sed in (7) is significantly hig her than th at obtain ed by using any of the other heuristic measures. A standout feature in Figure 7 is the fact that the incremental improvement in g oing 10 from Mon to Mon -T ue is lower tha n that observed in oth er data points in the gra ph. This is proba bly because Monday , April 9 th was White Mon day , a pu blic holiday in Ivory Coast. On the following day (i.e., T u esday 10 th of April) the users made o n average only 1 . 9 calls compare d to the average of 7 . 2 calls p er day . 6) Effect of location aggr e g ation: In addition to the remov al of user identifier s (i.e., an onymization) , an additio nal well- known priv acy-pr otection mech anism that is u sually app lied to mobility traces is spatial-reso lution red uction, which is known also as location obfuscation or location ag gregation [36], [37]. Here we investigate the effect o f location aggr egation on the matching accur acy . The Ora nge call-data re cords dataset also includ es a low- spatial resolu tion version [ 35] that co ntains the time of every call m ade by 5 00 , 000 rand omly chosen users and the sub- prefectur es (i.e., administrativ e divisions within the p rovinces) of the antenn as to which th ey were connected while making the call. The sub-pre fectures, shown by different colo rs in Figure IV -A1, in gener al contain multip le a ntennas, thus the dataset has a spatial resolution lower than t he origina l d ataset. W e consider a two-week period an d randomly ch oose a subset of size N = 46986 active users out of the total 500 , 000 users. The set ψ 1 (respectively , ψ 2 ) correspo nds to the histograms of the num ber of calls of the N users from eac h sub- prefectur es (i.e., location ) d uring th e first week (resp ectiv ely , second we ek). Users, in total, made calls fro m K = 2 37 sub - prefectur es. W e then construct the com plete bipartite graph G illustrated in Figu re 2 with edge weights given in (7), and run (A1). There are 2070 correctly matched users, which giv es an accuracy o f 4 . 4 0% . Th e obtained a ccuracy is much lower th an the 21 . 1% obtain ed for the same numb er of users in the o riginal high -resolution dataset. As anten nas are aggregated into s ub-pr efectures, users’ histogra ms become less distinguishab le and , as a re sult, the match ing accuracy d rops significantly . B. Experiments on web br owsing history ( WBH) data set 1) Dataset description and pr epr ocessing: The W eb His- tory Rep ository [ 38] consists o f a nonymized detailed web browsing history of hun dreds of users. Users can u pload their anonymized u sage data to the repository by using a Mozilla Firefox add- on. In orde r to protect the users’ pri vacy , all URLs and h osts are repr esented by a global un ique id entifier . Th e web browsing history (WBH) dataset co ntains the b rowsing history of 472 users. Users p articipated in th e data collection for d ifferent time-pe riods dur ing the course o f se veral years. For each user , the dataset contains every visited URL ( with en- crypted name), the favicon identifier associated with the URL, and the time of visit to the URL. The favicon, also known as a shortcut icon, is a small icon associated with a par ticular website. Generally , d ifferent URLs associated with the same website (e.g., domain name) hav e the same fa vicon and hence can be map ped to a single website. For example, if a user visits the URLs “news.yahoo.co m” and “mail.yah oo.com ”, the URLs will appear with different enc rypted names in the database; howev er , both URLs will have the same favicon 10 0 10 1 10 2 10 3 10 4 10 5 10 0 10 3 10 6 Number of visits W ebsite identifier Fig. 8. The total nu mber of visits (i.e., popu larity) to the K websites by all the users in the t wo-wee k pe riod. The figure i s plotted in a l og-log scale and the websites are indexe d acco rding to their popula rity . identifier (e.g ., “1”). Th us, we can learn tha t the u ser has visited a p articular website (i. e., “yaho o.com” ) twice. W e remove fr om the dataset a ll URLs that d o not have a fa vicon. W e consider eac h website (e.g., “yahoo.com ”) to b e a location and treat the fa v icon identifier as the website identifier for each URL. W e then identif y the period o f two consecuti ve weeks that has the max imum number of active users (i.e., users who visit at least one we bsite d uring each of the two weeks). There ar e N = 1 21 a ctiv e users in this tw o -week period. They visited K = 8 3219 d ifferent websites, 77935 of which were visited by not more than one user . Figure 8 sh ows a log-log plot of the total numbe r of visits to the websites b y all th e users in the two-week p eriod. The y-axis values r epresent th e popula rity of the web sites. W e disregard the timing information of the visited websites and constru ct the h istograms of the browsing patterns of each user in each week. Th us, the h istogram Γ x σ ( i ) (respectively , Γ y i ) of user i in the first ( respectively , second) week gives the r elativ e f ractions of the visits to various w ebsites by that user in the first (respectively , second ) week. The set ψ 1 (respectively , ψ 2 ) consists of the h istograms comp uted over the first week (respec ti vely , second week) . 2) Matching accuracy with differ en t metrics: W e co nstruct the gra ph G shown in Figure 2 fro m the histog rams and apply (A1) to G w ith different choices of ed ge weig hts. The obtained results are shown in th e secon d row o f T able II. W e o bserve that the ma tching a ccuracy obtained by u sing the weight fu nction prop osed in (7) is significantly high er than that obta ined by using any of th e other h euristic measures. Furthermo re, given the propo rtions of visited websites du ring two consecutive week s, we are able to correctly match almost all of th em. 3) Considering po pular websites: One reason we obtain a high matching ac curacy is that some websites are v isited b y only a small numb er of users dur ing the two-week perio d, hence it is easy to m atch th ose users. W e in vestigate th is effect as fo llows. W e consider a ll user s who visited at least one of the top 5 popular websites, in Figu re 8. There are N = 102 such users. W e co nsider a sub set (of size not less than 5 ) of the most popu lar of th e visited websites (refer to Figure 8). W e then keep for ev ery u ser i ( 1 ≤ i ≤ 1 02 ) the elements o f Γ x σ ( i ) and Γ y i that correspo nd to the consid ered subset o f websites, an d we set the remaining eleme nts equal to zero. W e th en re-n ormalize the remain ing histograms such that they sum to one. W e recon struct, by using d ifferent choices of edge weights, the bipartite graph G in Figure 2 and run 11 10 1 10 2 10 3 10 4 10 5 0 25 50 75 100 proposed l 1 -norm cosine dot Accuracy ( % ) Number of websites ( K ) Fig. 9. Matching accurac y for the WBH dataset with N = 102 users by using dif ferent measures when only a subset of the popular websites are considere d. The measures a re defined i n (7), (6 ), (4), and (5). The pro posed weight function yields the highest perc entage acc uracy in the matchi ng. The populari ty of t he websites is sho wn in Figure 8 . (A1) o n the graph. W e rep eat the experiment b y varying th e size of the consider ed sub set of po pular websites. Th e result is shown in Figur e 9. As expected, as fewer websites are considered , we hav e less informa tion available for m atching; hence the m atching accuracy drops. Howev er , by co nsidering merely the to p 60 most po pular websites, we can still correctly match m ore than 50% of users. Mo reover , as in T ab le II, the matching accuracy obtained by using the weight function in (7) is consistently hig her than that o btained b y using any of the other heu ristic measures. C. Experimen ts on GeoLife (GL) GPS da taset 1) Dataset description and p r ep r ocessing: The Geo life (GL) d ataset [3 9] contain s the GPS trace s of 182 users collected over five years. T he user traces in th is da taset are represented b y a sequ ence of time-stamped points, e ach of which co ntains the infor mation of latitud e and longitud e. The trajectories are widely distributed over many cities in China and even some in the USA and E urope, but the major ity of the da ta is created in th e city of Beijing. In ou r exper iments, we focus o n the tra jectories collected within the 5 th ring road of Beijing, w hich is an area ap prox imately 39 km × 39 km. W e first grid this are a into 100 m × 10 0 m squ ares. Each square represents a location. Figure 10(a) shows the considered area, where all the location s with a record ed GPS p osition are darkened. W e call a p articular one-week period active for a user if she has at least one recor ded GPS position during the w eek. Figure 10 (b) shows the a ctiv e week s f or each user d uring the data collection campaign. As can be seen from Figure 10(b), the users contributed to the dataset during different p eriods. W e filtered out all users with number of acti ve weeks equal to 1 a nd were left with N = 154 users. The users ha ve on aver - age 15 . 4 acti ve wee ks of data. W e split e ach user ’ s tr ajectories into two parts, where part one cor respond s to the trajector ies recorde d in the first half of her active weeks, an d part two correspo nds to th e trajectories reco rded in th e secon d ha lf of her activ e weeks. W e c onstruct histogr ams o f the location s visited by each u ser in each week . Thus, the histogr am Γ x σ ( i ) (respectively , Γ y i ) of user i in th e fir st (respectively , seco nd) part gi ves the relative fractions of recorded GPS position s from 116.15 116.35 116.55 39.75 39.95 Latitude Longitude (a) 2008 2010 2012 1 75 150 User ID T i me (b) Fig. 10. (a) Gridding of t he 5 th ring roa d of Bei jing into square s of 1 00 m × 100 m. In area has approximate size of 39 Km × 39 Km. The grids i n which a GPS posit ion is recorde d for a user is dark ened. (b) The acti ve weeks for each user during the data collectio n campaign. 10 0 10 1 10 2 10 3 10 4 0 20 40 60 proposed l 1 -norm cosine dot Accuracy ( % ) Side lengths of grid squares (in meters) Fig. 11. T he e volu tion of the matching accuracy for the GL dataset ( N = 154 ) as a function of the grid side-length by using diffe rent metric s. The measures a re defined i n (7), (6), (4), and (5). The accurac y is maximum for moderate side-lengths. various locatio ns ( i.e., grid squares on th e map) in the first (respectively , second) part of her data. The set ψ 1 (respectively , ψ 2 ) correspo nds to th e histog rams of th e numb er of record ed GPS positions of the N user s from the K location s in th eir first parts (respectively , secon d parts). 2) Matching acc uracy with differ ent metrics: W e set the side len gth o f grid squares equal to 10 0 0 m, and we comp ute the histog rams and a pply ( A1) to the gr aph G of Figure 2 with d ifferent choices o f ed ge weights. The obtaine d matchin g accuracy , wh en the side length of grid squares is 1000 m, is shown in the last row of T able II. The accuracy obtained by u sing the weig ht function pr oposed in (7) is sig nificantly higher than that o btained by using any of the o ther heu ristic measures. 3) Effect of spatia l r esolutio n: W e rep eat the previous experiment with varying c hoices for the side len gths of grid squa res. Th e resulting matching acc uracies are shown in Fig ure 11 as a functio n of the side lengths. For very large side-leng ths, the spatial r esolution is low , hence the users’ location tra ces are easily confu sed, thus leading to low matching ac curacy . For very small side-length s, there ar e too many locations in the sense that the inherent no ise in the GPS trajectories com e into effect, whic h leads to an over-fitting of th e da ta, and thus th e matching accur acy is ag ain low . Therefo re, the accuracy is maximum for moderate side-len gths – aroun d 100 m in the figur e. 12 4) Compa rison with existing work: In [17] the au thors propo se a de-an onymization scheme based o n a mob ility model called the Mobility Mar kov Chain (MMC) and applied it to the GL dataset. In their appro ach, an M MC is constructed for eac h user from her mo bility trace s ob served during th e training phase and during th e test phase. Distance metrics between MMCs are then used to link a user’ s trace f rom the test phase to the co rrespon ding trace in the training phase. There are three main dif ferences be tween th eir appro ach and ours. Fir st, in their app roach, the set o f locatio ns that a user visits is lea rned by apply ing a clustering algo rithm to the user’ s G PS trajectories. The clustering algo rithm identifies the accumulation regio ns of the user’ s trajectory that is then used to represen t the set of locations that the user visits, whereas in o ur approach , we partitio n the map area into squares th at repre sent the set of locations. Second, th ey use the timing inf ormation pr esent in the users’ trajecto ries to learn the MMCs, whe reas in o ur case we disregard all the timing information present in the trajectories and on ly consider the f raction o f v isits to different lo cations. Th ird, they d e- anonymize the users one-by -one, where as we simultaneo usly de-ano nymize all the users. In [17], the authors report a de- anonymizatio n accur acy of up to 4 5% on 7 7 users in the setting where the regions identified from the clustering algorithm have a ma ximum radius equ al to 50 0 m. In compar ison, ou r scheme ob tains a de-an onymization accur acy of up to 6 0% for 15 4 users in the setting where th e side lengths of grid squares ran ge from 300 m to 1 000 m. If we do one-by-one user de-ano nymization, this accu racy d rops down to 50% , howe ver it still rema ins higher than the 4 5% repor ted in [17]. W e believe th at th is is because b y u sing a complicated and dyn amic mod el such as MMC, there is a su bstantial over fitting of the user data to th e model. In [1 7], a K × K transition probab ility matrix is fitted to each trace, whereas in our appro ach a K -length probability vector is fitted . This leads to p oorer performances because the model lear ned fr om the fir st d ataset do es not “ generalize” well to the seco nd dataset. D. Runn ing time Here we present the timing info rmation of perfo rming the de-anonymizatio n attacks that are given in T able II. W e consider only the case wh ere our p roposed metr ic is used . The r unning times are given for MA TLAB version 8 . 3 . 0 . 532 runnin g on a L enovo T hinkpa d T 410 equip ped w ith Intel i 7 processor with clock speed o f 2 . 6 7 GHz, with 8 Gb o f RAM, and with Microsoft W in dows 7 64 - bit o perating system. The ru nning time for compu ting the ed ge weights ( w j i in (7)) of graph G and fo r running (A1) o n G are 4 1 min and 432 m in, respectively , for th e CDR dataset. The respective number s for the WBH d ataset a re 6 sec and 0 . 1 sec for computin g the edge weigh ts of G and f or runn ing ( A1) on G , re spectiv ely , The re spectiv e number s for the GL dataset are 0 . 9 sec and 0 . 2 sec for compu ting the ed ge weights of G and for r unning (A1) on G , resp ectiv ely . Note that the rep orted number s do not includ e the preprocessing time, that is , the time required fo r compu ting the h istograms fr om the raw data. V . P R I V AC Y E N H A N C I N G M E C H A N I S M S W e demo nstrated by our experime nts in Section IV that applying anonymization to histogra ms of users’ beh avior is not effecti ve in pr otecting the users’ identities from an adversary who has access to au xiliary kno wledge abo ut the users. In th is section, we discuss additional pr i vacy-preserving mechanisms that can be app lied to the histograms in order to m ake it difficult fo r the adversar y to id entify the user s. Th ese mechanisms essentially make the released histograms closer to each o ther so that there is g reater scope fo r confusio n in distinguishing them fr om ea ch other , and thus th e m atching accuracy declines. A. Basic da ta coarsening and d ata suppr ession T wo pop ular categories of pri vacy-preserving mech anisms are da ta obfusca tion an d da ta suppression metho ds [40]. An example o f data coarsenin g is spatial r esolution reductio n, which can be ach iev ed by agg regating d ifferent locatio ns into on e. W e investigated the latter in o ur experiments in Section IV -A6 and in Fig ure 1 1. Data suppression is the process o f restricting the released data associated with each user . For example, in our exper iment in Figu re 9 fo r th e WBH da taset, we consider only t he sub set of popular websites (i.e., web sites that are visited by most u sers) an d publish the histograms values associated with this subset. An other example is time-domain restriction, which refers to the proc ess of limiting th e time-p eriod over which the histog rams are computed . W e investigated this app roach in our experiment in Figure 7 for the CDR dataset. Anoth er po pular priv acy- preserving mec hanism is k -an onymization, wh ich we investi- gate in the next subsection. B. k -An onymization v ia micr o -aggr egation A released dataset is said to have the k -anonymity property if the d ata for each user contained in the dataset is identical to the data for at le ast k − 1 o ther u sers [ 41]. One mech anism fo r guaran teeing k -anonymity for a dataset is by means of micro - aggregation [ 42]. In micro-ag gregation, users’ data are parti- tioned into different clusters such that each cluster contain s data of at least k users. The average of the data within each cluster is comp uted and then used to repla ce the o riginal d ata values of all the users within the cluster . These new data values are then released, resulting in a dataset with the k -anonymity proper ty . I n micro-ag gregation, the par titioning is done by using a criterion of min imum w ithin-cluster infor mation loss, and it has been shown that find ing the optimal p artitioning is NP-hard [43]. In the following, we define m icro-agg regation in mathem atical terms, and describe how ou r matching method can be ad apted to d e-anonymize micro-aggregated histograms of users’ da ta. 1) Micr o- aggr egation: L et { C 1 , C 2 , . . . , C g } be a partition- ing of the u sers U 1 (i.e., the users who generate the histog rams ψ 1 ) into g clusters. That is, U 1 = ∪ g q =1 C q and C q ∩ C q ′ = ∅ for q 6 = q ′ . W e later elab orate on the c riteria for choosing the set { C q } 1 ≤ q ≤ g . Furth ermore, define k = min 1 ≤ q ≤ g | C q | , and Γ C q = 1 | C q | X j ∈ C q Γ x j , (10) 13 for 1 ≤ q ≤ g , which represent th e av erage of h istograms of all users within e ach cluster . In micro -aggregation , instead of releasing th e set of histogr ams ψ 1 , th e set of micro -aggregated histograms e ψ 1 = n e Γ x j o is released, where e Γ x j = Γ C q for j ∈ C q and for 1 ≤ q ≤ g . It is straightforward to see that when e ψ 1 is released, every user in set U 1 is guaran teed k - anonymity . Although m icro-agg regation gu arantees k -anonym ity to the users, it d istorts the released d ataset. Specifically , every his- togram Γ x j is replaced by e Γ x j . The criteria for o btaining { C q } 1 ≤ q ≤ g in micro -aggr egation is to min imize the to tal distortion to the data, for a g iv en value of k . I n the litera ture, the l 2 -norm is often used to mea sure the distortion [44], howe ver because the histogram s lie on the probability simplex, we use the l 1 -norm to measure the d istortion. In particular th e total add ed distortion, which is also called information loss , is P g q =1 P j ∈ C q Γ x j − Γ C q 1 . The max imum inf ormation loss occurs w hen all th e u sers ar e p artitioned into a single cluster , i. e., when g = 1 . The inf ormation loss in this case is P N j =1 Γ x j − Γ x 1 , where Γ x = P N j =1 Γ x j / N . Conse- quently , we can define a normalized informatio n loss measure as follows: L = g X q =1 X j ∈ C q Γ x j − Γ C q 1 , N X j =1 Γ x j − Γ x 1 . (11 ) The extreme case, L = 0 , rep resents the scenario wh ere no micro-ag gregation is perform ed (i.e., g = N ) and wher e all users are guaran teed 1 -a nonymity . The oth er extrem e case, L = 1 , r epresents the scenario where g = 1 an d where all users ar e g uaranteed N -ano nymity . For a giv en value of k , we seek the partitio ning { C q } 1 ≤ q ≤ g whose norm alized informa tion loss L given in (11) is as small as possible. In our fo llowing experiment, we use the algorithm propo sed in [44] for perf orming micro-aggregation , where we adapt the algorithm to measure the d istortion by usin g l 1 -norm . 2) Experimen tal evaluations: Here we e valuate the ef fec- ti veness of the matching algorith m when m icro-agg regation is perf ormed on the un labeled histogr ams ψ 1 . W e consider an ad versary who has access to th e lab eled histogr ams ψ 2 and is interested in matching th ese histograms to the micro- aggregated ones in e ψ 1 . W e co nsider two dif ferent no tions o f accuracy for the m atching. Let th e labeled histogr am Γ y i be matched to the unlabe led micro- aggregated histog ram e Γ x j . According to our first notion , there is a correct match if j = σ ( i ) , wh ere σ is defined in (2 ). Acco rding to ou r secon d notion, th ere is a correct m atch if e Γ x j = e Γ x σ ( i ) . T he fo rmer notion of accura cy ( called user-le vel ) measures the num ber of correctly matched users and is the same notio n tha t we u sed in our expe riments in Section IV, whereas the latter n otion (called c luster-le v el ) measures the nu mber o f users wh ose k - anonymity class (i.e., cluster) is co rrectly identified. For the CDR dataset, we con sider the setting describ ed in Section I V -A3. In particular, we rando mly choose N = 100 0 out of the 469 86 users an d construc t the sets ψ 1 and ψ 2 . For the WBH dataset, we consider the sub set of the top K = 100 popular websites and con struct the sets o f h istograms ψ 1 and ψ 2 as described in Section I V -B3. For the GL dataset, we 10 0 10 1 10 2 10 3 0 20 40 60 80 100 U-Lev . accuracy C-Lev . accuracy Information loss # clusters k % (a) CDR dataset ( N = 1000 ) 0 20 40 60 80 100 10 0 10 1 10 2 k % (b) WBH dataset ( N = 102 ) 10 0 10 1 10 2 0 20 40 60 80 100 k % (c) GL dataset ( N = 15 4 ) Fig. 12. The trade-of f between user-l e vel (denoted by U-Lev . ) and cluste r- le vel (d enoted by C-Lev .) m atchin g ac curaci es and the information lo ss L as k -anon ymity is guarantee d to the users. As k incr eases, more distortion is added to the histogra ms (i.e., more information is lost) but the user-le vel accura cy drops meaning that the users enjo y higher pri v acy with respect to the adversa ry . The cluste r-le vel accura cy howe ver experienc es much less fluctuat ion. consider the setting described in Section IV -C2 when grid side- length is set equal to 100 0 m. For each dataset, we p erform m icro-agg regation with dif fer- ent values o f k on the set ψ 1 . W e th en perf orm the matchin g between e ψ 1 and ψ 2 by usin g only the propo sed metric of (7 ). The obtain ed accu racies are shown in Figure 1 2(a) a nd 12( b) and 12(c) for the CDR, WBH, a nd GL d ataset, respectively . The figu res also show th e nor malized infor mation loss L defined in (11) and the normalize d numbe r of clusters (i.e, g / N ), expressed in perce ntages. In the extreme case with k = 1 , n o m icro-agg regation is perfo rmed; th erefore, g = N , L = 0 , an d the user-lev el accuracy is eq ual to the cluster- lev el accuracy . I n the o ther extreme case, k = N , a nd all the released unlab eled histogr ams are identical; theref ore, the in formation loss is maxim um ( L = 1 ), and wh ile the user-le vel accur acy is minimum, the clu ster-le vel accuracy is maximum . As k increases to about 10 , the user-le vel acc uracy dramatically dro ps, hen ce the users enjoy an increased lev el of priv acy guarantee, wh ereas the cluster-le vel accuracy r emains almost the sam e for all values of k . V I . C O N C L U S I O N W e have studied the task of identifyin g users fro m the statistics of their behavioral patterns. Spe cifically , g iv en an anonymized dataset in th e form of histogram s belonging to a set of user s and an other inde penden t set o f histograms generated by the same set o f users, we h av e shown that it is possible to identify the identities of the users in the first dataset to a surpr ising le vel of accuracy by matching the statistical characteristics of th e users’ beh aviors across the two datasets. Thus da ta histo grams act as fingerprints for identifying u sers. 14 Our pr oposed solution can be implemen ted via a min imum- weight maxim al match ing alg orithm o n a com plete weig hted bipartite g raph and y ields hig her accuracy than h euristics- based metho ds on three d ifferent datasets of different natu re. W e have studied the p erform ance of the algor ithm over a wide range of experimental conditio ns and demo nstrated the effect of various factors, suc h as th e numb er of users, the resolution of the data, the duration o f the d ata co llection, and the amount of data supp ressed, on the accuracy of the matching algorithm . W e have ga ined the insight tha t the simultaneo us matching of th e user s yields h igher accur acy compared to on e- by-on e user matc hing. Fu rthermo re, we have demonstra ted the power of simplicity o f statistics: I dentification based only on data statistics ca n sometim es result in hig her accur acy than existing m ethods b ased on m ore co mplicated data m odels. W e have fur ther stud ied the perfo rmance o f the algorith m un der priv acy-e nhancem ent techn iques, such as k -ano nymization, and d emonstrated th e ef fect of k o n the m atching accu racy . Our resu lts suggest th at users can be iden tified, to a sur- prisingly hig h level of accur acy , even fr om th e statistics of their behavior . Moreover , usin g the co rrect metric an d optimal matching algorith m can lead to a significant improvement in matching accur acy over h euristics-based m ethods. Pri vacy enhancem ent via k -an onymization an d data obfu scation can reduce id entification accu racy , but the ac curacy remains n on- negligible for mod erate lev els of data d istortion. V I I . A C K N O W L E D G M E N T S W e tha nk Jacques Ragu enez and V inc ent Blondel f or grant- ing us access to the Orange CDR dataset. W e thank Alessandra Sala for her feedb ack on the man uscript. R E F E R E N C E S [1] J. Unnikrishn an and F . Mov ahedi Naini, “De-anon ymizing pri vate data by mat ching s tatist ics, ” in 51 th Annu al All erton Co nfer ence , 2013. [2] J. Unnikrishnan , “ Asymptoticall y optimal matching of multiple se- quence s to source distrib utions and training sequences, ” IEEE T rans. Inf. Theory , v ol. 61, 2015. [3] P . R esnick a nd H. R. V arian, “Re commender systems, ” Commun icatio ns of the ACM , vol. 40, n o. 3, pp. 56 –58, 199 7. [4] A. Narayan an and V . Shmatiko v , “Robust de-anonymiza tion of large sparse datasets, ” in Pr oceedings of IEE E Symposium on Security and Privacy , 200 8. [5] A. K. Elmagarmi d, P . G. Ipei rotis, and V . S. V erykios, “Duplicate record detec tion: A surv ey , ” IEEE T rans. Kn owl. Data Eng. , 2007. [6] D. V . Kalashnik ov , Z. Chen, S. Mehrotra , and R. Nuray-T uran, “W eb people search via connect ion ana lysis, ” IEEE T rans. Knowl . Da ta Eng. , 2008. [7] E. Bengtson and D. Roth, “Understandi ng the va lue of feature s for corefere nce resolutio n, ” in E MNLP Confere nce , 2008. [8] A. Stolerman, R. Overdorf, S. Afroz, and R. Greenstad t, “Brea king the closed-world assumption in stylometric authorship attribut ion, ” in Advances i n Di gital F ore nsics X . Springer , 2014. [9] S. Afroz, A. C. Islam, A. Stole rman, R. Greenstadt, and D. McCoy , “Doppelg¨ anger finder: T aking sty lometry to the undergro und, ” in Secu- rity an d Privac y (SP ), 2014 IEEE Symposium on . IEEE, 2014. [10] O. Peled, M. Fire, L . Rokach, a nd Y . Elovic i, “Enti ty ma tching in onl ine social networks, ” in IEEE SocialCom , 2013. [11] J. Liu, F . Zhang, X. Song, Y .-I. Song, C.-Y . Lin, and H.-W . Hon, “What’ s in a name?: an unsupervised approach to link users across communities, ” in ACM WS DM , 2013. [12] L. Sweeney , “W eav ing technology and polic y together to m aintai n confident ialit y , ” The J ournal of Law , Med icine & Ethics , 199 7. [13] H. Zang and J. Bolot, “ Anonymizati on of l ocatio n data does not work: A large-scal e measurement stu dy , ” in ACM MobiCom , 2011. [14] X. Xiao, Y . Zheng, Q. L uo, and X. Xie, “Finding similar users using cate gory-based location hist ory , ” in ACM SIGSP ATIAL , 2010. [15] C. Y . Ma, D. K. Y au, N. K. Y ip, and N. S. Rao, “Priv acy vulnera bility of pu blished anonymous mobili ty tra ces, ” in Mobi Com , 2010. [16] J. Freudiger , R. Shokri, and J. -P . Hubaux, “Eva luati ng the pri vac y risk of locat ion-based serv ices, ” in Fi nancial Crypto graphy and Data Se curity . Springer , 2012. [17] S. Gambs, M.-O. Killij ian, and M. N ´ u ˜ nez del Prado Cortez, “De- anon ymizatio n atta ck on geoloca ted data, ” Journal of Computer and System S cience s , 2014. [18] Y . De Mu lder , G. Dane zis, L. Bat ina, and B. Preneel, “I dentific ation v ia locat ion-profili ng in gsm netw orks, ” in A CM WPES , 2008. [19] A. Machana v ajjha la, D. Kifer , J. Abowd, J. Gehrke, and L . V ilhuber , “Pri vac y: Theory mee ts pra ctice o n th e map, ” in IEE E ICDE , 20 08. [20] L. Olejnik, C. Castell uccia, and A. Janc, “On the uniqueness of web bro wsing history pattern s, ” annals of telecommunic ations-ann ales des t ´ el ´ ecommunication s , vol. 69, no. 1-2, pp. 63–74, 2014. [21] T .-F . Y en, Y . Xie, F . Y u, R. P . Y u, and M. Abadi, “Host fingerprinti ng and track ing on the web: Pri vac y and securit y implica tions. ” in NDSS , 2012. [22] K. Sharad a nd G. D anezi s, “De-an onymiz ing d4d datasets, ” in HotPE Ts , 2013. [23] M. Sri v atsa and M. Hicks, “Dean onymiz ing mobi lity traces: Using social netw ork as a side-ch annel, ” in AC M CCS , 2012. [24] Y .-A. de Montjoy e, C. A. Hidalgo, M. V erle ysen, and V . D. Blondel, “Unique in the Crowd: The pri vac y bounds of human mobi lity , ” Scien- tific R eports , 2013. [25] R. Shokri, G. T heodorak opoulos, J.-Y . Le Boudec, and J.-P . Hubaux, “Quanti fying lo cation priv acy , ” in Security a nd Privacy (SP), 2 011 IEEE Symposium o n . IEEE, 201 1, pp. 247–262. [26] G. Danezis and C. Troncoso, “V ida: Ho w to use bayesia n inference to de-anonymize persistent communicati ons, ” in Privacy Enhancing T echnolo gies . Springer , 2009, p p. 56–72. [27] C. Troncoso, B. Gierlichs, B. Preneel, and I. V erbauwhe de, “Per- fect m atchin g disclosure atta cks, ” in Privacy Enhancing T echnolo gies . Springer , 2008, p p. 2–23. [28] P . Pedarsani and M. Grossglauser , “On the priv acy of anonymize d netw orks, ” in ACM KDD , 2011. [29] T . Hastie, R. Tibshiran i, and J. Friedman, The elements of statistical learning . Sprin ger , 2009, v ol. 2, no. 1. [30] T . M. Cov er and J. A. T homas, Elements of Information Theory 2nd Edition . Wi ley- Interscie nce, 2006. [31] L. R amshaw and R. E. T arjan, “ A weig ht-scali ng algorithm for mi n-cost imperfect ma tchings in biparti te graphs, ” in IE EE FO CS , 2012. [32] M. L. Fredman and R. E. T arjan, “Fibonacc i heap s and their uses in improv ed network optimization algor ithms, ” J ACM , 1987. [33] W . Cook, W . Cunningha m, W . Pulle yblank, and A. Schrijv er , Combi- natorial Optimization , ser . W iley Series in Discrete Mathematic s and Optimiza tion. W iley , 2011. [34] R. Duan and S. Pettie, “Linear-time approximation for maximum weight matching , ” J . A CM , vol. 61, no. 1, pp. 1:1–1:23, Jan. 2014. [35] V . D. Blondel, M. Esch, C. Chan, F . Clerot , P . De ville, E. Huens, F . Morlot, Z. Smoreda, and C. Ziemlick i, “Data for de velo pment: the d4d challenge on mobi le phone data, ” arXiv preprint , 2012. [36] K. L. Huang, S. S. Kanhere, and W . Hu, “Preserving priv acy in partic ipatory sensing s ystems, ” Computer Communications , 2010. [37] D. Christin, A. Reinha rdt, S. S. Kanhere, and M. Holli ck, “ A surve y on pri vac y in mobile participa tory sensing applicat ions, ” Journal of Systems and Software , 2011. [38] E. Herder , R. Kaw ase, and G. Papada kis, “Experienc es in b uildin g the public web history repository , ” in Pr oc. of Dat atel W orkshop , 2011. [39] Y . Zheng, Q. Li, Y . Chen, X. Xie, and W .-Y . Ma, “Understand ing mobility based on g ps data, ” in ACM Ubicomp , 2008. [40] C. C. Aggarwal and S. Y . Philip, A gene ral surv e y o f pri vacy-pr eserving data mining models and algori thms . S pringer , 2008. [41] L. Sweene y , “k-anon ymity: A model for protecting pri v acy , ” INT J UNCERT A IN FUZ Z , 2002. [42] J. Domingo-Ferrer and J. M. Mateo-Sa nz, “Pract ical data-ori ented mi- croaggre gation for statistica l disclosure control, ” IEE E T rans. Knowl. Data E ng. , 2002. [43] J. Domingo-Ferrer , F . Seb ´ e, and A. Solanas, “ A polynomial-time ap- proximati on to optima l multi variat e microaggre gation, ” Computers & Mathemat ics with A pplicat ions , 2008. [44] C. Panagiot akis and G. Tzirita s, “Successi ve group selection for mi- croaggre gation, ” IEEE T rans. Knowl. Dat a Eng . , 2 013.
Original Paper
Loading high-quality paper...
Comments & Academic Discussion
Loading comments...
Leave a Comment