Social networks, happiness and health: from sentiment analysis to a multidimensional indicator of subjective well-being
This paper applies a novel technique of opinion analysis over social media data with the aim of proposing a new indicator of perceived and subjective well-being. This new index, namely SWBI, examines several dimension of individual and social life. T…
Authors: Stefano Maria Iacus, Giuseppe Porro, Silvia Salini
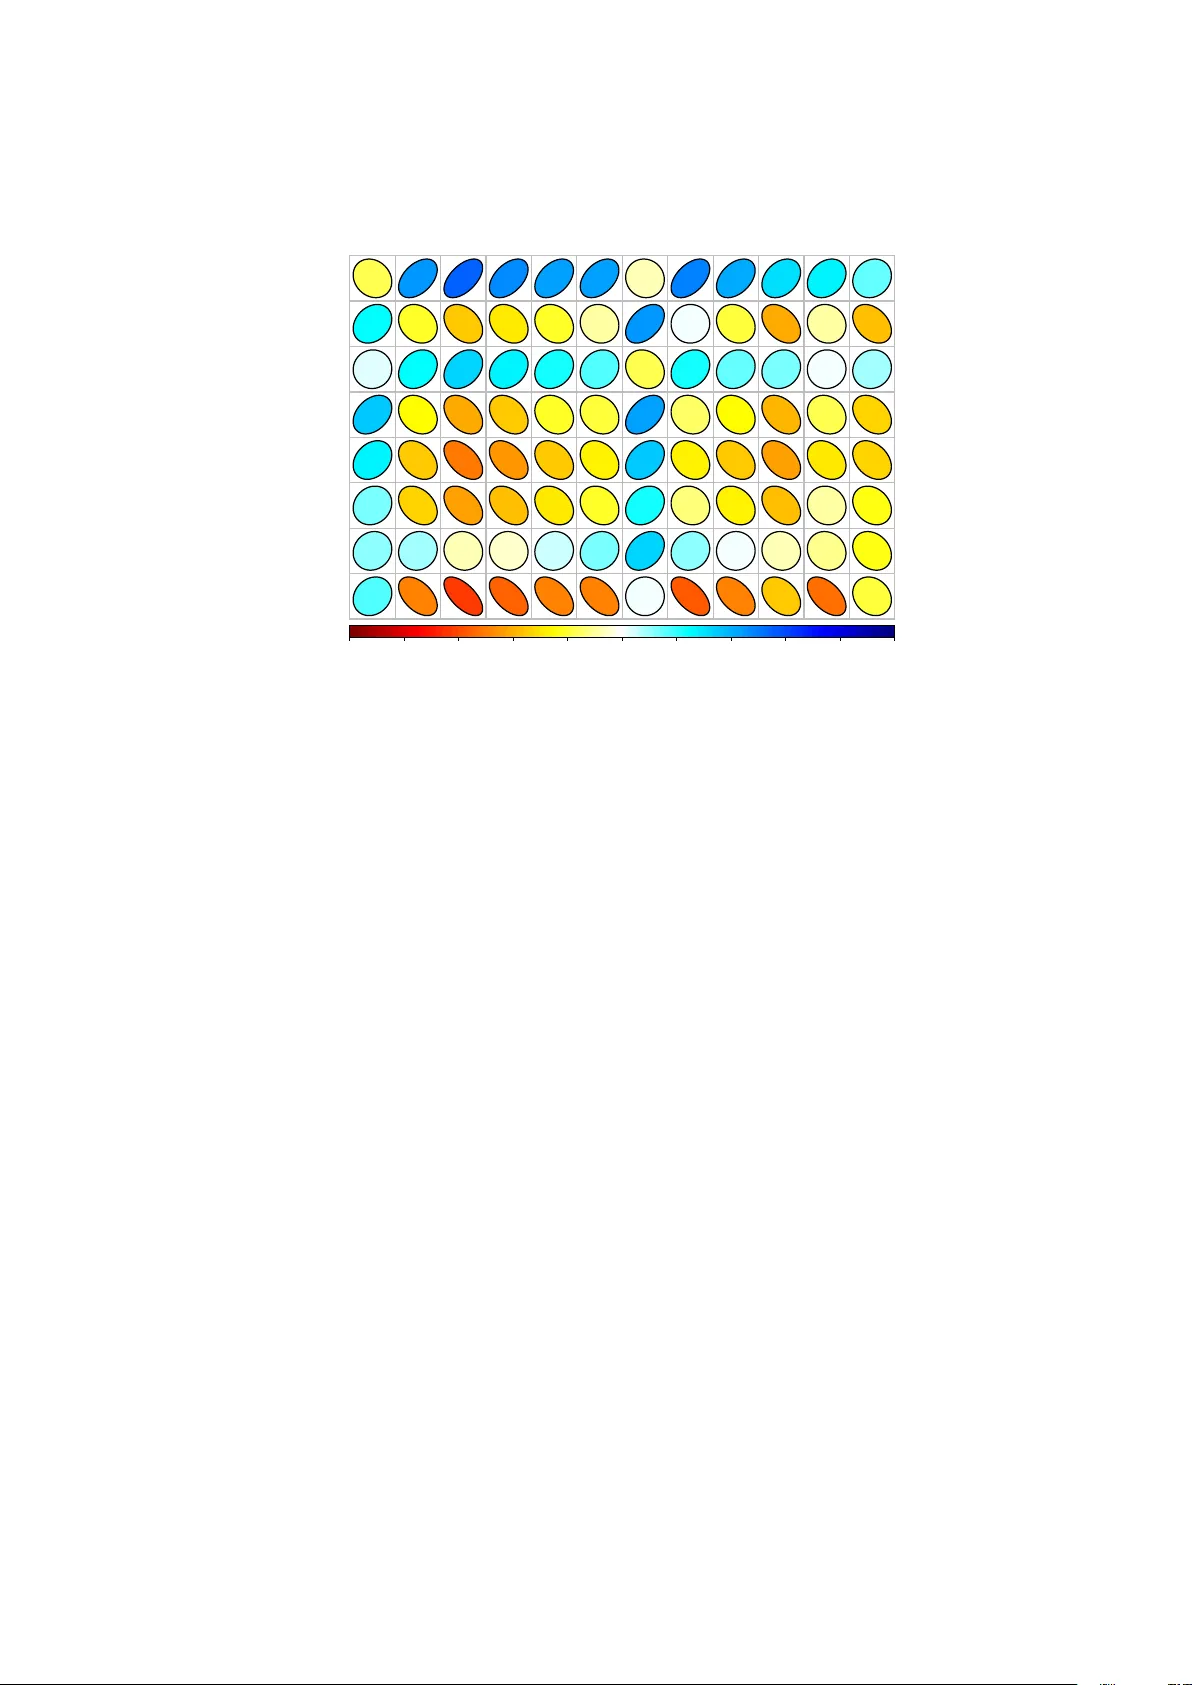
So cial net w orks, happiness and health: from sen timen t analysis to a m ultidimensional indicator of sub jectiv e w ell-b eing Stefano Maria Iacus ∗ Giusepp e P orro † Silvia Salini ∗ Elena Siletti ∗ Abstract: This pap er applies a no v el technique of opinion analysis o v er so cial media d ata with the aim of prop osing a new indicator of p erceiv ed and sub jectiv e w ell-b eing. This new index, namely SWBI, examines several dimension of indi- vidual and so cial life. The indicator has b een compared to some other existing indexes of well-being and health conditions in Italy: the BES (Benessere Equo Sostenibile), the incidence rate of influenza and the abundance of PM10 in urban en vironments. SWBI is a daily measure av ailable at pro vince level. BES data, curren tly av ailable only for 2013 and 2014, are ann ual and a v ailable at regional lev el. Flu data are w eekly and distributed as regional data and PM10 are collected daily for differen t cities. Due to the fact that the time scale and space granularit y of the different indexes v aries, we apply a nov el statistical technique to discov er no wcasting features and the classical latent analysis to study the relationships among them. A preliminary analysis suggest that the en vironmental and health conditions an ticipate several dimensions of the p erception of well-being as mea- sured b y SWBI. Moreo v er, the set of indicators included in the BES represent a laten t dimension of w ell-b eing which shares similarities with the latent dimension represen ted by SWBI. Keyw ords: W ell-b eing, sentimen t analysis, happiness, health J.E.L. Classification: I10; I31 ∗ Departmen t of Economics, Management and Quan titative Metho ds, Universit` a degli Studi di Milano † Departmen t of Law, Economics and Culture, Univ ersit` a degli Studi dell’Insubria 1 1 In tro duction This pap er prop oses a set of w ell-b eing indicators, derived from a new sup ervised tec hnique of web opinion analysis designed to capture several asp ects of sub jective w ell-b eing from on-line discussions and then tries to relate these information with health indicators. The several dimensions of sub jectiv e well-being extracted from w eb con versations are aggregated into a unique index called SWBI (So cial W ell- Being Index). Our main purp ose is to in vestigate whether SWBI and its single comp onen ts - whic h are c haracterized b y a daily frequency and a relatively low cost of acquisition - ma y adequately represen t the reaction of a comm unity to changes in health and en vironmental conditions. Indeed, as Stepto e et al (2015) remarked, sub jectiv e well-being is definitely asso ciated with health conditions. Recen t literature has linked depression and life stress with premature mortalit y , coronary heart disease, diab etes, disabilit y , and other c hronic disorders (Stepto e, 2007). Emotional states are seen as a k ey determinant of the somatization of feelings of stress and anxiety related to life ev ents (Sabatini, 2014). Medicine and psychology studies suggest that emotional reactions to life ev en ts can affect ph ysiology in w ays that are damaging for health (Rozanski et al, 1999; Kuhn et al, 2009). But also the relationship b etw een job loss, depression, and p o or health conditions seems to be well established b y sev eral studies (Clark and Oswald, 1994; Kuhn et al, 2009). Lyub omirsky et al (2005) found that sub jective w ell-b eing is a protective factor for health. Chida and Stepto e (2008) suggested that p ositiv e life ev aluation and happiness predict lo w er future mortalit y and morbidit y . Because of this do c- umen ted relationship b et w een w ell-b eing, health and quality of life, health care systems should b e concerned not only with illness and disability , but also with supp orting metho ds to impro ve psychological states (Stepto e et al, 2015). Unfortunately , indicators of individual and so cial w ell-b eing are usually ob- tained from surveys based on self-ev aluation of the respondents on life quality . Sev eral studies hav e p ointed out that explicitly asking for an ev aluation of well- b eing generates biased estimates of the v ariable of interest. So cial netw orks and w eb forums offer, on the con trary , a v aluable, large and con tin uously up dated source of sp on taneous self-ev aluations of life satisfaction, under man y different as- p ects. Therefore, a new stream of studies is trying to extract reliable information from these media. The SWBI has b een calculated on the 2012-2015 p erio d in Italy and correlated to the av ailable information on public health and other well-being indicators. Be- ing that some of the dimension comp osing the SWBI capture the features of the in terp ersonal relation system, the analysis can shed some light on the recipro cal influence among so cial interactions, health and life qualit y p erception, whic h is a necessary condition to deep en the study of causal relations among these v ariables. 2 The technique of opinion analysis used in this pap er is the iSA (integrated Sen timent Analysis) algorithm (Ceron et al, 2013, 2015) that extracts the sen ti- men t from texts p osted on so cial netw orks and has already been used to capture instan taneous happyness from so cial media data (Curini et al, 2015). An environmen t that is resilien t and in a state of vitalit y is a prerequisite for a health y and therefore happy life. Clean water, fresh air and uncontaminated fo o d are only p ossible in a “health y” en vironment in which the size of naturalness is able to in tegrate with human activities (IST A T, 2014). The SWBI is then compared to some other existing indexes of well-being and health conditions in Italy: the BES (Benessere Equo Sostenibile), the incidence rate of influenza and the abundance of PM10 in urban en vironments. While SWBI is a daily measure a v ailable at pro vince level, the BES data, curren tly av ailable only for 2013 and 2014, are ann ual and av ailable at regional level. Flu data are weekly and distributed as regional data and PM10 are collected daily for differen t cities. Due to the fact that the time scale and space granularit y of the differen t indexes v aries, we apply a no vel statisti cal tec hnique to disco v er “no wcasting” features and some t yp e of latent analysis to study the relationships among them. A preliminary analysis suggest that the en vironmental and health conditions an ticipate sev eral dimensions of the p erception of w ell-b eing as measured by SWBI. Moreov er, the set of indicators included in the BES represent a laten t dimension of well-being whic h shares similarities with the latent dimension represented b y SWBI. The pap er is organized as follo ws: in Section 2 traditional measures of w ell- b eing are reviewed. Section 3 presen ts the new measure for sub jectiv e well-being. Section 4 is dedicated to metho dological asp ects of opinion analysis and no wcast- ing. Finally 5 presen t the applications of the prop osed metho dology analyzing SWBI along with other health and so cial well-being indicators. 2 T raditional measures of w ell-b eing F or a long time Gross Domestic Pro duct (GDP) has b een considered a go o d in- dicator of w ell-b eing. The reasons why GDP had suc h a success are its capacity to connect go o ds and services with differen t nature thanks to monetary v aluation (Stiglitz et al, 2009), its linear metho dology , ob jectivity and clearness and the usefulness in in ternational comparisons. Although its link with man y standard of living indicators, is strong, this link is not univ ersal and differences in income explain only a low prop ortion of the differences in happiness among p eoples (F rey and Stutzer, 2002): in fact, GDP has b een criticized for b eing a w eak indicator of so cial w elfare and therefore a misleading guide for public p olicies (Fleurbaey, 2009). In 2009, the so-called Stiglitz Commission (Stiglitz et al, 2009) observed that 3 GDP should not b e completely dismissed and prop osed to build a complemen- tary statistical system, cen tred on social w ell-b eing and suitable for measuring sustainabilit y , comp osed by a wide set of indicators, quantitativ ely measured and represen ting b oth ob jective and sub jectiv e assessment of w ell-being, including also p eople’s p erception of their qualit y of life. With its work, the Commission made a sort of “paradigmatic” c hoice that ha ve had a strong influence in further w ell-b eing literature and, ab o v e all, practice. F ollowing this path, statisticians and so cial scien tists, go v ernments and in terna- tional organizations (Fleurbaey, 2009) ha v e dev eloped a h uge n um b er of w ell-b eing indicators, with differen t structures, considering a great v ariet y of dimensions and for man y purp oses. Examples of those indices are: the Human Developmen t Index (HDI), the Better Life Index (BLI), the Happy Planet Index (HPI), the F air Sus- tainable W ell-Being Index (Benessere Equo Sostenibile-BES), the Canadian Index of W ell-b eing and the Gross National Happiness Index (GNH). After the Stiglitz Commission work, economists, psychologists and philoso- phers hav e b ecome increasingly interested in self-rep orted measures of w ell-b eing. Among all the surveys used to study sub jectiv e well-being, differen t t yp es can b e highligh ted: surv eys of general nature that are submitted w orldwide (Gallup W orld P oll, W orld Database of Happiness, W orld V alues Survey), surveys of gen- eral nature that hav e lo cal impact (Gallup-Health wa ys W ell-being Index, British Household P anel Survey , Europ ean So cial V alues Survey(ESS), Eurobarometer, Global Health & W ellb eing Surv ey), surv eys that consider only certain groups of p eople, as youth (National Child Dev elopment Survey , Surv ey of W ell-b eing of Y oung Children (SWYC)), students or employ ers (Gallup’s surv eys of w orkers and customers corp orate clients, So cial-Emotional W ell-b eing (SEW) Survey , GA Releases Graduate Studen t Happiness & W ell-Being Rep ort). In the last y ears self-reports are extensiv ely used to study w ell-being, forgetting that they are often a misleading source of information (Sc hw arz, 1999). Rep orts of w ell-b eing are influenced b y manipulations of current mo od and of the immediate con text, including earlier questions on a surv ey that cause particular domains of life to b e temp orarily salient (Sc h warz and Strac k, 1999). Satisfaction with life and with particular domains is also affected by comparisons with other p eople and with past exp eriences (Clark, 2003). T o o v ercome biases of self-rep orted measure of well-being Kahneman et al (2004) prop osed some new pro cedures: the Exp eri- ence Sampling Metho d (ESM), the Daily Reconstruction Metho d (DRM), and the Ev ent Recall Method (ERM). The same scholars admit the limitations of these approac hes: ESM, e.g., is not a practical metho d for national well-being accounts, b ecause it is impractical to implemen t in large samples, the rate of nonresp onse ma y b e unacceptable and infrequen t activities are only rarely sampled. T o solve the problem that individuals may in terpret and use the resp onse cat- 4 egories differen tly , surv ey researchers try to anc hor resp onse categories to w ords that ha v e a common and clear meaning across resp onden ts, but there is no guaran- tee that resp onden ts use the scales comparably . Questions remain ab out whether one should giv e a cardinal interpretation to the numeric v alues attac hed to indi- vidual resp onses ab out their life satisfaction or emotional states b ecause of the p oten tial for p ersonal use of scales (Kahneman and Krueger, 2006). Despite all the efforts made in the literature, and partly presen ted ab o ve, it remains muc h uncertaint y in the use of self-rep orted data. Indeed, for example, in analyzing Gallup data Angus Deaton himself raised concerns on the use of so cial w ell-b eing questionnaire items for cross-national comparisons (Deaton, 2012) as the order in which questions w ere asked may strongly affect the answers: sp ecifically , shifting questions ab out p olitics just b efore the questions on life ev aluation increase the negativ e p erception of the economic crisis. This casts a shadow on the abilit y of the surv eys, regardless of the sophisticated structure that ma y ha v e, to grasp the structural comp onen t of life satisfaction. Since the surveys are instan taneous, they seem mainly suitable to capture the emotional, short-run comp onen t. Summarizing and simplifying the issues ab out surveys that are still op en, the t wo main limitations of the indicators based on self-rep orted information seem to b e related to: a) the influence that the single question (or even the order the questions are put) can hav e on the answ ers quality; b) the limited frequency of the surv eys, that may fail in capturing the trend changes in sub jectiv e well-being o ver time and in distinguishing b et ween the short-run “emotional” comp onen t of w ell-b eing and the structural comp onen t, usually called “life ev aluation” or “life satisfaction”. The tw o comp onen ts are presumably connected to different features of individual and collectiv e life. Economists typically watc h what p eople do, rather than listening to what p eo- ple sa y , as it has b een argued b y Di T ella and MacCullo c h (2008). Nevertheless, the developmen t of Internet and, in particular, of a num b er of widespread so cial net works offers now ada ys a ric h source of information on public opinion, whic h is a v ailable without submitting any questionnaire or carrying out an y systematic surv ey , they simply allow to listen to p eople. So cial netw orks host an op en, enor- mous amoun t of records and digital interactions (Pen tland, 2014), under the form of microblogging, that can b e collected and analyzed for research purp oses, mak- ing it p ossible to study so cial dynamics from an unseen p ersp ectiv e. Analyzing this kind of data allo ws to listen to what p eople say: in well-being researc hes this means to b e able to measure happiness in real-time, mapping its fluctuation due to the o ccurrence of external facts (Curini et al, 2015). 5 3 A new measure for w ell-b eing Sen timent analysis is the core asp ect of a brand new metho d for measurement of happiness and w ell-b eing. This researc h field is largely dedicated to the systematic extraction of w eb users’ emotional state from the texts they p ost autonomously on differen t internet platforms, suc h as blogs, forums, so cial net works (e.g.,Twitter or F aceb o ok) (Kramer, 2010; Ceron et al, 2013). The a v ailabilit y of these large data sets ha v e driv en up the gro wth of theories and metho dologies for sen timen t or opinion analysis. Despite many limitations (Coup er, 2013), if correctly p erformed, sen timent analysis seems to b e a useful framew ork to exploit when the constraints of standard survey metho dology ma y b e to o strong (Iacus, 2014). On one hand, in fact, there is no need for asking questions to the target p opulation: all that the analyst has to do is to listen to the on-line conv ersations and classify the opinions expressed accordingly; on the other hand, the av ailable information is up dated in real time and hence the frequency of the well-being ev aluation can b e as high as desired, theoretically allo wing for separating the v olatile and emotional comp onen t from the p ermanen t and structural one. Here we prop ose to apply iSA (in tegrated Sen timent Analysis) method to de- riv e a set of indicators of sub jectiv e well-being that capture different asp ects and dimensions of individual and collectiv e life. The indicators are summarized in a global index named So cial W ell Being Index (SWBI). The term “so cial” empha- sizes that: • the indicator monitors the sub jective well-being expressed b y the society through the so cial netw orks; • SWBI is not the result of some aggregation of individual w ell-b eing measure- men ts: as it will b e clear in what follo ws, the index directly measures the aggregate comp osition of the sentimen t throughout the so ciet y . The iSA tec hnique (Ceron et al, 2015), that will b e explained in details in Section 4, has b een previously used to build a so cial media happiness indicator kno wn as iHapp y (Curini et al, 2015). 3.1 Asp ects captured b y the SWBI The eight indicators w e ev aluate concern three different w ell-b eing areas: p ersonal w ell-b eing, so cial well-being, w ell-b eing at work. T o b e comparable with a com- p osite w ell-b eing index currently a v ailable through p eriodical surveys for the main Europ ean countries, we adopt the definitions in tro duced b y the think-tank NEF (New Economic F oundation). Eac h well-being area is analyzed by a single com- p onen t and each comp onent is defined through the hypothetic question one might 6 find in a questionnaire (New Economic F oundation, 2012). Let us p oin t out once more that, in our case, these questions are just “h yp othetic”: no explicit question can b e submitted to the target p opulation in our researc h, the sentimen t and an y kind of opinion are extracted from the text through the sup ervised analysis of the language used in the p osts. The data source are tw eets written in Italian language and from Itally and data are accessed through Twitter’s public API. A small part of these data (around 1- to 5% each day) con tain geo-reference information which is used to build the SWBI indicator at province level in Italy . W e hav e stored and analyzed more than 143 millions of tw eets, ab out 100 thousands p er day , of which only 1.2 millions of t weet are geo-lo calized at pro vince level (ab out 1%). Here is the definition of eac h single comp onen ts of SWBI: 1. Personal wel l-b eing : • emotional w ell-b eing : the ov erall balance b et ween the frequency of exp eriencing p ositiv e and negative emotions, with higher scores sho wing that p ositiv e emotions are felt more often than negativ e ones ( emo ); • satisfying life : having p ositiv e ev aluation of one’s life ov erall ( sat ); • vitality : having energy , feeling well-rested and healthy , and b eing ph ys- ically activ e ( vit ); • resilience and self-esteem : a measure of individual psyc hological resources, optimism and abilit y to deal with life difficulties ( res ); • p ositive functioning : feeling free to choose and ha ving the opp ortu- nit y to do it; b eing able to make use of p ersonal abilities and feeling absorb ed and gratified in activities ( fun ); 2. So cial wel l-b eing : • trust and b elonging : trusting other p eople, feeling to b e treated fairly and resp ectfully and feeling sentimen ts of b elonging ( tru ); • relationships : extent and quality of interactions in close relationships with family , friends and others who provide supp ort ( rel ); 3. Wel l-b eing at work : • quality of job : feeling job satisfaction, satisfaction with w ork-life bal- ance, ev aluating the emotional experiences of work and w ork conditions ( wor ). As it is not p ossible to ask questions in so cial media, the comp onents of the SWBI are obtained through the reading of a sample of t w eets (see next Section for details) 7 and trying to classify eac h t weet according to the scale -1, 0, 1, where -1 is for negativ e , 0 is neutral and 1 is p ositiv e feeling. F or example, a text like “I am grateful to my friends and relativ es who sustained me during my hard times”, will b e classified as rel = + 1 . While a text like “you can’t really trust any one no wada ys”, will b e classified as tru = − 1 ; or a text like “ok, let’s go to w ork again to da y” as wor = 0 . These are of course just examples of ho w one deriv es the indicators from qualitativ e text analysis. 4 Ho w to analyze so cial media data In this section w e briefly presen t the iSA algorithm and the lead-lag estimation tec hnique whic h are used in Section 5.2 to, resp ectiv ely , transform texts in to opin- ions and to discov er time-dep endence b et w een the prop osed index and other well- b eing indexes. 4.1 iSA iSA is a human sup ervised statistical metho d, where part of the texts are read by h umans and part is classified b y the machine. The sup ervised part is essen tial in that this is the step where information can b e retrieved from texts without relying on dictionaries of sp ecial seman tic rules. Human just read a text and asso ciate a topic or opinion (for example: D = “satisfied at work”) to it. Then, the computer learn the asso ciation b etw een the whole set of w ords used in a text to express that particular opinion and extends the same rule to the rest of the texts to b e analyzed. More formally , let us denote by D = { D 0 , D 2 , . . . , D M } the set of possibile categories (i.e. sen timents or opinions). The target of in terest is { P ( D ) , D ∈ D } , i.e. the distribution of opinions in a corpus of N texts. Normally , D 0 refers to the texts corresp onding to Off-topic or not relev an t texts with resp ect to the analysis (i.e. the noise in this framework). Let S i , i = 1 , . . . , K , b e a unique v ector of L p ossible stems (i.e. single words, unigrams, bigrams, etc which remain after the stemming phase) which iden tifies one of the texts in a corpus. More than one text in the corpus can b e represented by the same S i and is such that each element of it is either 1 if that stem is contained in a text, or 0 in case of absence. The data set is then formalized as the set { ( s j , d j ) , j = 1 , . . . , N } where s j ∈ ¯ S (the space of p ossible v ectors S j ) and d j can either b e “NA” (not av ailable or missing) or one of the hand co ded categories D ∈ D . The “traditional” approac h includes all machine learning metho ds and statis- tical mo dels that: 8 1. use the individual hand co ding from the training set to construct a mo del P ( D | S ) for P ( D ) as a function of S , e.g. m ultinomial regression, Random F orests (RF), Supp ort V ector Machines (SVM) etc.; 2. predict the outcome of ˆ d j = D for the texts with S = s j b elonging to the test set; 3. when all data hav e b een imputed in this w ay , these estimated categories ˆ d j are aggregated to obtain a final estimate of ˆ P ( D ). In matrix form, w e can write P ( D ) M × 1 = P ( D | S ) M × K P ( S ) K × 1 (1) where P ( D ) is a M × 1 v ector, P ( D | S ) is a M × K matrix of conditional prob- abilities and P ( S ) is a K × 1 v ector whic h represen ts the distribution of S i o ver the corpus of texts. Once P ( D | S ) is estimated from the training set with, say , ˆ P ( D | S ), then for each document in the test set with stem vector s j , the opinion ˆ d j is estimated with the simple Bay es estimator as the maximizer of the conditional probabilit y , i.e. ˆ d j = arg max D ∈D ˆ P ( D | S = s j ). As it is w ell kno wn, the present approac h do es not work if P ( D 0 ) is very large compared to the rest of the D i ’s. iSA (Ceron et al, 2015) follow the idea by Hopkins and King (2010) of c hanging the p oin t of view but go es one step further in terms of computational efficiency and v ariance reduction. Instead of equation (1), one can consider this new equation P ( S ) K × 1 = P ( S | D ) K × M P ( D ) M × 1 (2) where now P ( S | D ) is a K × M matrix of conditional probabilities whose elemen ts P ( S = S k | D = D i ) represen t the frequency of a particular stem S k giv en the set of texts which actually express the opinion D = D i . Then, the solution of the problem is as follo ws (in verse problem) P ( D ) M × 1 = [ P ( S | D ) T P ( S | D )] M × M − 1 P ( S | D ) M × K T P ( S ) K × 1 (3) Equation (3) is such that the direct estimation of the distribution of opinion P ( D ) is obtained but individual classification is no longer p ossible. In fact, this is not a limitation as the accuracy of (3) with resp ect to (1) is v astly b etter (v ariance of estimates decreases from 15-20% to 3-5%). Moreov er, researchers are compre- hensibly more in terested in the aggregate distribution of opinions throughout a p opulation than in the estimation of individual opinion. F or details see Ceron et al (2015). 9 4.2 Lead-lag estimation When w orking with t wo or more time series, the usual need is to study their correlation but also p oten tial causation effects: who leads who? This technique is called lead-lag estimation. The lead-lag effect is a concept of common practice that has some history in financial econometrics and that we bring to so cial media analysis. In time series, for instance, this notion can be link ed to the concept of Granger causality , and w e refer to Comte and Renaut (1996) for a general approac h. F rom a phenomenological p ersp ectiv e, the lead-lag effect is supp orted b y empirical evidence rep orted in Chiao et al (2004); de Jong and Nijman (1997) and Kang et al (2006), together with Rob ert and Rosenbaum (2011) and the references therein. The usual Granger-lik e approac h has sev eral limitations: 1) the time series m ust b e of the same frequency (daily data, w eekly date, etc); 2) testing for causalit y often leads to discov er a bidirectional effect; 3) linear time series are used (V AR or similar) to mo del the data. An additional problem is that, if the frequency of time series increases, i.e. the lag b et ween the data diminishes, the empirical correlation v anishes artificially due to the so-called Epps effect (Zhang, 2011). In our applications of Section 5, the data hav e usually different frequencies, con tain missing data and hence are also asynchronous, and there is no reason to assume a linear b eha viour (in man y cases seasonalities do exist). T o tak e in to accoun t all the men tioned features of the data, recently Hoffmann et al (2013) prop osed a lead-lag estimator based on the Hay ashi-Y oshida asynchronous cov ari- ance estimator (Ha yashi and Y oshida, 2008, 2005). This estimator also o vercome the Epps effect. Let θ ∈ ( − δ, δ ) b e the time lag b et ween the tw o nonlinear pro cesses X and Y . Roughly sp eaking, the idea is to construct a con trast function U n ( θ ) whic h ev aluates the Hay ashi-Y oshida estimator for the times series X t and Y t + θ and then to maximize it as a function of θ . The lead-lag estimator ˆ θ n of θ is defined as ˆ θ n = arg max − δ <θ< + δ | U n ( θ ) | . When the v alue of ˆ θ n is p ositiv e it means that X t and Y t + ˆ θ n (or X t − ˆ θ n and Y t ) are strongly correlated, so we say “ X leads Y by an amount of time ˆ θ n ”, so X is the le ader and Y is the lagger . Vicev ersa for negative ˆ θ n . 5 Applications: linking SWBI to other w ell-b eing measures In this section we presen t a few exp erimen ts that try to explain the relationship b et w een the SWBI and other w ell-b eing indexes and differen t t yp es of health- 10 related data. In particular, w e will analyse the relationship b etw een PM10 daily data in the pro vince of Milano and the health components of SWBI; then w e relate SWBI to the the weekly data ab out the incidence of influenza in Italy . The third analysis consists of the study of the correlation among the comp onen ts of the BES index and those included in SWBI for differen t Italian regions, with annual data. 5.1 The SWBI index The SWBI index is the simple arithmetic mean 1 of the eight indicators emo , fun , rel , res , sat , tru , vit and wor in tro duced in Section 3. T able 1 rep orts the y early v alues of SWBI and its eight comp onen ts. Data are av ailable from F ebruary 2012 till Nov em b er 2015 at the time of this writing. The analysis is based on a total of 143 millions of t weets p osted in Italian and from Italy . SWBI emo fun rel res sat tru vit w or 2012 48.87 60.55 67.76 34.10 55.10 43.88 59.22 53.91 16.44 2013 52.22 57.32 73.31 37.35 57.19 55.03 64.04 58.04 15.50 2014 49.69 48.24 68.26 39.73 56.11 52.37 62.59 55.15 15.10 2015 48.50 49.50 54.57 55.35 54.30 36.72 40.40 57.81 39.33 T able 1: Average v alues of SWBI and its comp onen ts. It is in teresting to notice that, if w e lo ok at the p er capita GDP in Italy in 2012- 2014 (data for 2015 are not a v ailable y et) and the v alue of the corresp onding SWBI indicator w e cannot find a clear common path, meaning that there is not necessarily a direct relationship b etw een the level of economic activity of the coun try and the p erceiv ed well-being. The w ell-b eing indicator, in other terms, do es not seem to simply reflect the conditions of the economic system, even in a p erio d of serious economic crisis. Y ear 2012 2013 2014 SWBI 48.87 52.22 49.69 GDP p er capita (in euros, curr. prices) 26760.0 26496.1 26545.8 Figure 2 represen ts the same data as T able 1. It is easy to note that the v alues of the indicator in 2015 sho w remark able differences (b oth p ositiv e and negative) compared to the trend of the previous y ears: see, in particular, the increase in wor and rel , or tru , fun and sat for the opp osite v ariation. In addition to that, Figure 1 con tains the plot of the daily v alues of SWBI (b ottom panel) and its mon thly in tegrated v alue (upp er panel). The integrated v alue of SWBI represents 1 W e use simple mean here for sake of simplicit y: any reasonable and justified weigh ted mean of the eigh t indicators can b e theoretically prop osed as a synthetic w ell-b eing measure. 11 monthly data integrated SWBI 800 1000 1200 1400 1600 1800 2013 2014 2015 daily data SWBI 0 20 40 60 2012 2013 2014 2015 Figure 1: daily v alues of SWBI (b ottom panel) and its monthly in tegrated v alue (upp er panel). The in tegrated v alue of SWBI represen ts the gross balance of well-being during eac h p erio d. the gross balance of well-being during eac h p eriod. This represen tation dumps do wn the irregularity and high v ariability of daily estimates, which is typical in so cial media data. The ab o ve descriptive statistics need an in depth ev aluation. It is only the case to note that the indicator registers b oth structural and volatile comp onen ts of well-being and what w e are showing is a preliminary and rough separation of the tw o, which is one of the discussion topic in the literature on w ell- b eing measurement. What follows represen ts a few examples of analyses related to health and other w ell-b eing measures. 12 sat tru vit wor swbi emo fun rel res ● ● ● ● ● ● ● ● ● ● ● ● ● ● ● ● ● ● ● ● ● ● ● ● ● ● ● ● ● ● ● ● ● ● ● ● ● ● ● ● 50 100 0 Y ear ● ● ● ● 2012 2013 2014 2015 Figure 2: Y early av erage v alues of SWBI and its comp onen ts. Data from T able 1. 5.2 The effect of PM10 p ollutan t abundance on well-being W e consider data ab out the presence of PM10 in Milano. Data were do wnloaded from the regional agency for environmen tal protection (ARP A). W e treated daily data from F ebruary 1st, 2012 to September 30th, 2015 which amoun ts to 2 millions t weets from Milan area in our data base, i.e. ab out 1.5 thousands p er da y . Figure 3 represents the time series of PM10, SWBI and its comp onen ts. W e run the lead-lag analysis of Section 4.2 using a windo w of ± 5 days to verify whether there is any leader among the dimensions of SWBI and the abundance of p ollutan t. It is not unlikely to exp ect that p ollution may affect w ell-b eing, p ossibly with some lag. emo fun rel res sat tru vit wor ˆ θ n (PM10, · ) -4.1 4.0 5.0 -4.1 1.0 -1.1 5.0 3.0 corr(PM10, · ) -0.054 -0.043 0.031 -0.059 -0.068 -0.037 -0.051 0.092 T able 2: Lead-lag analysis: a p ositiv e v alue of ˆ θ n (v alue in days) means the time series of PM10 anticipates the time series in the column and viceversa. The second row of table rep orts the v alue of the Hay ashi-Y oshida correlation estimator which is corrected for the Epps effect. The lead-lag analysis in T able 2 shows the estimated lead-lag parameters in 13 0 50 150 pm10 30 50 70 swbi 20 40 60 80 emo 20 40 60 80 fun 2012 2013 2014 2015 20 40 60 80 rel 0 20 40 60 80 res 0 20 40 60 80 sat 0 20 60 tru 20 40 60 80 vit 2012 2013 2014 2015 0 20 40 60 80 wor PM10 vs SWBI Figure 3: Daily v alues of PM10, SWBI and its comp onen ts for the city of Milan, from F ebruary 1st, 2012 to September 30th, 2015. Is there a leader among these time series? da ys. F rom this analysis, it seems lik e the comp onen ts satisfying life ( sat ), vitality ( vit ), working satisfaction ( wor ), p ositive functioning ( fun ), r elationship ( rel ) are an ticipated b y the amount of p ollutant PM10 at differen t lags. In some cases, these indicators are negatively correlated with PM10. This ma y indicate, for example, that increasing v alues of PM10 may cause a dela yed effect on the p erception of w ell-b eing in terms of o verall satisfaction ( sat ) and vitality ( vit ). On the other hand, also the relationships b et ween p ollution and p ositiv e functioning ( fun ) or job satisfaction ( wor ) hav e an in tuitive time direction, but they are likely a medium or long-run matter. Again, this is far from estimating a causal effect, as p ollution dep ends on man y other aspects lik e temperature, h umidity and traffic, but it seems that some evidence exists from these SWBI comp onen ts, whic h deserves a more articulated and in-depth examination. 5.3 Influenza and w ell-b eing The Inter-univ ersitary Researc h Centre on Influenza and other T ransmissible In- fections (CIRI-IT) is an Italian go vernmen t institution whose task is researc h and scien tific co op eration in the field of influenza and acute respiratory infections with particular regard to etiology , epidemiology , preven tion and control. Among other activities, CIRI-IT publishes official data on the incidence of influenza in Italy . 14 W eekly data from Octob er 15, 2012 and Ma y 23, 2015 are analyzed. This cor- resp onds to 103 millions of t w eets in our data base. Similarly to the previous case of PM10 p ollutan t, w e will mak e use of lead-lag estimation for daily data of SWBI against weekly data for influenza, therefore the t wo time series ha ve differen t frequencies. It turns out that the ˆ θ n ( flu , SWBI ) = 4 with a negativ e correlation of cor r ( flu , SWBI ) = − 0 . 062 and the emotional comp onen t emo has a similar pattern, i.e. ˆ θ n ( flu , emo ) = 1 with cor r ( flu , emo ) = − 0 . 057; similarly for wor : ˆ θ n ( flu , wor ) = 3 with cor r ( flu , wor ) = − 0 . 066. In tuitively , the num b er of flu cases increases the negative short-run feelings registered b y the indicators, th us w orsening the emotional comp onen t of w ell-b eing; at the same time, the sickness induced b y flu affects job p erformance and reduces the p erception of job satisfac- tion, also creating temp orary difficulties in the w ork-life balance. On the whole, this yields a decrease in w ell-b eing (after 1 to 3 da ys), which shows its negative effect also on the aggregate SWBI indicator. 5.4 BES v ersus SWBI BES is the w ell-b eing index elab orated by the Italian Institute of Statistics (IS- T A T) setting up from a dashboard of tw elv e dimensions: En vironmen t ( env ), Health ( hea ), Economic w ell-b eing ( ewb ), Education ( edu ), W ork and lifetime ( wlt ), So cial relations ( sre ), Safety ( saf ), Sub jective w ell-being ( swb ), Landscap e and culture ( lac ), Research and innov ation ( rin ), Service quality ( squ ), P olitics and institutions ( poi ). Although it is clear conceptually and statistically similar to the Better Life In- dex (BLI), BES do es differ from it and other similar indexes presented in Section 2 in av oiding any form of aggregation: in the p erio dical rep ort, for each dimen- sion, the entire set of proxies is presen ted and discussed. Ev en if IST A T do es not pro vide any form of aggregation inside and b et w een dimensions comp osing BES, it is p ossible to find them on an on-line platform 2 dev elop ed b y IRES Piemonte (the Regional Institute for Economic and So cial Researc h of Piemon te). IRES elab orates general and domain-sp ecific comp osite indicators for all the Italian re- gions, presen ting them with a format similar to BLI b y OECD: a voiding any form of w eigh ting but giving to the citizen the p ossibilit y of creating the index that reflects his/her o wn preferences. F or our application we consider all the single dimensions of BES and SWBI, without summing them up in any weigh ted mean. Ann ual data from 2013 and 2014 are examined and the unit of analysis are the Italian regions. F or the SWBI comp onen ts w e use data aggregated at regional lev el for a total of ab out 75 millions of t weets. 2 http://www.irespiemonte.it/iresinforma/index.php?option=com_content&view= article&id=37:qualita- della- vita- rapporto- bes&catid=5:societa&Itemid=3 15 −1 −0.8 −0.6 −0.4 −0.2 0 0.2 0.4 0.6 0.8 1 env hea ewb edu wlt sre saf swb lac rin squ poi emo fun rel res sat tru vit wor Figure 4: Cross-Correlation matrix for: SWBI comp onen ts vs BES v ariables. Increas- ing v alues are translated in to colors from red (negativ e correlation) to blu (p ositive correlation). Our main aim is to understand whether a relationship exists b et w een the BES indicators and the SWBI comp onen ts. In other w ords: is the latent dimensions of w ell-b eing common to the tw o sets of information? The preliminary plot in Figure 4 suggests that some correlations b et w een the tw o set of v ariables exist. W e apply a tec hnique called c anonic al c orr elation analysis (CCA) to extract, if an y , the common latent dimension. Giv en tw o sets of v ariables X and Y , CCA (Hotelling, 1936) seeks for linear combinations of the v ariables of Y that are max- imally correlated to linear com binations of the v ariables of X . The analysis esti- mates the relationships and constructs new laten t v ariables called canonical v ari- ables (Legendre, 2005). The canonical v ariates generated b y CCA are orthogonal linear com binations of the original v ariables within eac h set X and Y that b etter explain the v ariabilit y b oth within and b etw een sets. The Wilks’s Lam b da test suggests that only the first canonical dimension is significan t. W e use also the second in order to pro duce some dimension maps. T able 3 rep orts the canonical co efficien ts (loadings). The basic hypothesis we do is that there exists a laten t dimension of well-being that is not observ able and measurable, and that all di- mensions that w e observ e are its pro xy and therefore are related to it. In general, when extracting a latent dimension, we exp ect a canonical dimension with the 16 same relationship (p ositiv e or negative) with all the observed v ariables, in suc h a w ay that the latent dimension extracted is easy in terpretable b y a single p olarit y alb eit b y attributing differen t w eigh ts to the v ariables that comp ose it. If the p olarit y is p ositive, high v alues of the laten t comp onen t indicate high well-being in the region and lo w v alues of the latent comp onen t indicate a lo w well-being in the region. T able 3: Normalized Canonical Co efficients CanAxis1 CanAxis2 BES env 0.43 0.14 hea -0.32 -0.20 ewb -0.49 -0.16 edu -0.43 -0.16 wlt -0.49 -0.19 sre -0.28 -0.06 saf 0.36 -0.12 swb -0.29 0.11 lac -0.46 -0.26 rin -0.69 -0.28 squ -0.73 0.01 poi -0.58 -0.16 SWBI emo -0.23 0.10 fun 0.26 0.19 rel -0.03 0.16 res 0.30 -0.05 sat 0.39 -0.04 tru 0.15 0.29 vit 0.24 -0.23 wor 0.47 -0.23 The canonical co efficien ts in the T able 3 ha ve not all the same sign, even if it seems that the BES comp onen ts are p ositiv ely correlated with the laten t dimension and the social well-being comp onen ts are in general negativ e correlated. This means that the interpretation of the w ell-b eing laten t dimension is not simple: there is no p ositiv e p olarity of the indicators. This is clear also from Figure 4, where blue and red ellipses are sho wn. It is imp ortan t to remem b er that the statistical units are the Italian regions and not the individuals; the so cial well b eing indicators ha ve in fact b een aggregated. The w ell-b eing in the differen t regions is characterized b y sev eral asp ects. It can not b e considered a unique one-dimensional that capture all asp ects. Figure 5 shows the so-called biplot. The upp er plots represent the scores for the first and the second canonical dimensions. In order to obtain the t w o sets of scores, the linear combination is calculated for eac h region using the loadings of the BES indicators and the loadings of the so cial w ell-b eing comp onen ts. The represen tation of the Italian regions in the canonical axis (upp er) is consistent either the indicators set is the BES (left) or the SWBI (righ t). This highligh ts 17 that the latent v ariable actually depicts the same situation in b oth cases, i.e. that - conditional to the canonical co efficien ts - the tw o sets of indicators share the same piece of information. The loadings maps (b ottom) highligh t that, at regional level, the BES dimen- sions can assume differen t directions and these directions corresp ond to differen t so cial dimension of w ell-b eing. This may imply that in some cases, despite the apparen t similar conten t, the single BES or SWBI comp onents measure different dimensions of well-being: this may b e due, for example, to a difference b et w een ob jective and p erceiv ed well-being ev aluations. −2 −1 0 1 2 −2 −1 0 1 2 CanAxis1 CanAxis2 ● ● ● ● ● ● ● ● ● ● ● ● ● ● ● ● ● ● ● ● PIEMONTE V ALLE D'AOST A LOMBARDIA TRENTINO VENETO FRIULI LIGURIA EMILIA TOSCANA UMBRIA MARCHE LAZIO ABRUZZO MOLISE CAMP ANIA PUGLIA BASILICA T A CALABRIA SICILIA SARDEGNA First data table (Y) −2 −1 0 1 2 −2 −1 0 1 2 CanAxis1 CanAxis2 ● ● ● ● ● ● ● ● ● ● ● ● ● ● ● ● ● ● ● ● PIEMONTE V ALLE D'AOST A LOMBARDIA TRENTINO VENETO FRIULI LIGURIA EMILIA TOSCANA UMBRIA MARCHE LAZIO ABRUZZO MOLISE CAMP ANIA PUGLIA BASILICA T A CALABRIA SICILIA SARDEGNA Second data table (X) −1.0 −0.5 0.0 0.5 1.0 −1.0 −0.5 0.0 0.5 1.0 CanAxis1 CanAxis2 emo fun rel res sat tru vit wor −1.0 −0.5 0.0 0.5 1.0 −1.0 −0.5 0.0 0.5 1.0 CanAxis1 CanAxis2 env hea ewb edu wlt sre saf swb lac rin squ poi Figure 5: Biplots of the Canonical loadings and co efficien ts 18 F ollowing this suggestion, we try to explain each SWBI dimension with the BES indicators. W e run linear regression mo dels of SWBI (as a simple mean of its comp onen ts) and eac h of its comp onen ts against the t welv e dimensions of BES. T able 4 rep orts the regression co efficien ts for eac h explanatory v ariable and their significance lev el. 19 SWBI emo fun rel res sat tru vit wor (Intercept) 50 . 523 ∗∗∗ 60 . 970 ∗∗∗ 68 . 443 ∗∗∗ 44 . 374 ∗∗∗ 53 . 869 ∗∗∗ 47 . 444 ∗∗∗ 58 . 896 ∗∗∗ 55 . 284 ∗∗∗ 14 . 907 ∗∗∗ (1 . 270) (3 . 314) (2 . 941) (1 . 835) (1 . 347) (3 . 184) (1 . 571) (1 . 890) (0 . 786) env − 0 . 107 − 1 . 452 ∗∗∗ − 0 . 326 − 0 . 037 0 . 294 0 . 527 0 . 104 − 0 . 100 0 . 136 (0 . 145) (0 . 379) (0 . 336) (0 . 210) (0 . 154) (0 . 364) (0 . 180) (0 . 216) (0 . 090) hea 0 . 003 0 . 159 0 . 115 − 0 . 112 0 . 007 − 0 . 108 0 . 091 0 . 103 − 0 . 231 (0 . 216) (0 . 563) (0 . 499) (0 . 312) (0 . 229) (0 . 541) (0 . 267) (0 . 321) (0 . 134) ewb − 0 . 668 ∗ − 1 . 206 − 1 . 622 ∗ 0 . 901 ∗ − 0 . 472 − 1 . 318 − 0 . 790 ∗ − 0 . 859 ∗ 0 . 022 (0 . 261) (0 . 680) (0 . 604) (0 . 377) (0 . 276) (0 . 654) (0 . 323) (0 . 388) (0 . 161) edu 0 . 049 1 . 044 0 . 807 − 0 . 582 0 . 002 − 0 . 339 0 . 071 − 0 . 450 − 0 . 164 (0 . 327) (0 . 853) (0 . 757) (0 . 473) (0 . 347) (0 . 820) (0 . 405) (0 . 487) (0 . 202) wlt 0 . 705 ∗∗∗ 1 . 140 ∗ 1 . 644 ∗∗∗ − 0 . 949 ∗∗ 0 . 360 1 . 492 ∗∗ 0 . 902 ∗∗∗ 0 . 816 ∗∗ 0 . 233 (0 . 184) (0 . 481) (0 . 427) (0 . 266) (0 . 195) (0 . 462) (0 . 228) (0 . 274) (0 . 114) sre 0 . 458 − 1 . 807 0 . 188 0 . 022 0 . 746 2 . 274 ∗ 0 . 382 1 . 138 ∗ 0 . 724 ∗∗ (0 . 358) (0 . 934) (0 . 829) (0 . 517) (0 . 379) (0 . 897) (0 . 443) (0 . 533) (0 . 222) saf − 0 . 199 0 . 116 − 0 . 171 − 0 . 107 − 0 . 182 − 0 . 632 − 0 . 158 − 0 . 407 − 0 . 053 (0 . 185) (0 . 483) (0 . 429) (0 . 268) (0 . 196) (0 . 464) (0 . 229) (0 . 276) (0 . 115) swb 0 . 204 1 . 862 ∗∗∗ 0 . 707 − 0 . 337 − 0 . 220 − 0 . 390 0 . 134 0 . 239 − 0 . 360 ∗∗ (0 . 187) (0 . 487) (0 . 432) (0 . 270) (0 . 198) (0 . 468) (0 . 231) (0 . 278) (0 . 116) lac − 0 . 363 − 1 . 829 ∗ − 0 . 984 0 . 418 0 . 152 − 0 . 034 − 0 . 199 − 0 . 404 − 0 . 021 (0 . 278) (0 . 726) (0 . 644) (0 . 402) (0 . 295) (0 . 697) (0 . 344) (0 . 414) (0 . 172) rin − 0 . 231 0 . 146 − 0 . 316 − 0 . 045 − 0 . 429 ∗ − 0 . 699 − 0 . 168 − 0 . 153 − 0 . 182 (0 . 158) (0 . 411) (0 . 365) (0 . 228) (0 . 167) (0 . 395) (0 . 195) (0 . 235) (0 . 098) squ 0 . 206 0 . 307 0 . 192 0 . 135 0 . 216 0 . 366 0 . 034 0 . 312 0 . 091 (0 . 114) (0 . 298) (0 . 264) (0 . 165) (0 . 121) (0 . 286) (0 . 141) (0 . 170) (0 . 071) R-squared 0 . 504 0 . 615 0 . 455 0 . 517 0 . 629 0 . 600 0 . 499 0 . 519 0 . 672 adj. R-squared 0 . 309 0 . 464 0 . 241 0 . 327 0 . 483 0 . 443 0 . 303 0 . 330 0 . 543 sigma 1 . 164 3 . 036 2 . 695 1 . 681 1 . 234 2 . 917 1 . 439 1 . 732 0 . 721 F 2 . 583 4 . 070 2 . 125 2 . 723 4 . 313 3 . 818 2 . 540 2 . 746 5 . 205 p 0 . 021 0 . 001 0 . 053 0 . 016 0 . 001 0 . 002 0 . 023 0 . 015 0 . 000 Log-likelihood − 55 . 690 − 94 . 048 − 89 . 276 − 70 . 407 − 58 . 030 − 92 . 451 − 64 . 191 − 71 . 594 − 36 . 514 Deviance 37 . 920 258 . 116 203 . 321 79 . 152 42 . 627 238 . 306 58 . 007 83 . 990 14 . 537 AIC 137 . 379 214 . 096 204 . 551 166 . 815 142 . 059 210 . 902 154 . 382 169 . 188 99 . 028 BIC 159 . 335 236 . 052 226 . 507 188 . 770 164 . 015 232 . 857 176 . 338 191 . 143 120 . 984 N 40 40 40 40 40 40 40 40 40 T able 4: Comp onents of BES regressed against SWBI and its comp onents. 20 It is worth noting, first of all, that the SWBI has a negativ e relationship with the Economic well-being ( ewb ) comp onen t of BES: as w e previously p oin ted out, the SWBI do es not sistematically reflects the economic conditions of the coun- try . Moreov er, the BES comp onent whic h is most frequen tly related to SWBI and its sub-indicators is W ork and lifetime ( wlt ). The relationship with SWBI comp onen ts is mostly p ositiv e (with the exception of ( rel ), that may suggest a trade-off b et ween satisfaction from w ork and the qualit y of friendship and family relations); it is quite disturbing, in this case, that the BES ( wlt ) v ariable has a non-significan t relationship with the SWBI ( wor ), that is supp osed to measure the same w ell-b eing dimension. It is encouraging that the Sub jectiv e well-being BES comp onen t ( swb ) is pos- itiv ely correlated to the emotional dimension of SWBI ( emo ); at the same time the BES ( swb ) is negatively related to the SWBI ( wor ), again suggesting a sort of trade-off b et w een quality of working time and ov erall p erceiv ed qualit y of life. On the other hand, it is quite con vincing the p ositiv e and significan t co efficien t that connects the BES So cial relations indicator ( rse ) and the SWBI job satisfaction v ariable ( wor ): maybe an absorbing job can worsen the p erception of life quality , but al least it impro ves so cial relations. Not easy to in terpret the negative co efficien t linking BES En vironment ( env ) v ariable to SWBI emotional comp onen t ( emo ), and disapp oin ting - to our current aims - that the co efficien ts of the BES indicator of Healt ( hea ), though mostly p ositiv e, are nev er significant. 6 Conclusion The eigh t-dimensional So cial W ell Being Indicator (SWBI) has b een correlated to public health data with differen t frequency , exploiting the adv an tages of the lead- lag estimation pro cedure. Many comp onents of the indicator sho w the exp ected b eha vior when correlated to the highest-frequency time series: PM10 p ollutan t abundance anticipates (i.e. has an impact on) several asp ects of p erceiv ed well- b eing, in particular life satisfaction, vitality , job satisfaction and p ositive function- ing. The same happ ens when SWBIU is correlated to weekly data on influenza: the n umber of flu cases increases the negative short-run feelings registered b y the indicators, th us w orsening the emotional comp onen t of w ell-b eing and negatively affecting job satisfaction. The impact is correctly registered, with a 4-da ys lag, by the o verall SWBI indicator. More fuzzy is the relationship b et w een the components of SWBI and of the ann ual indicator BES: in fact, con vincing correlation v alues can b e found b etw een the emotional comp onent in SWBI and the sub jectiv e well-being dimension of BES, and significan t correlation is also sho wn b y the work and lifetime asp ects, as 21 measured by BES, and large part of SWBI sub-indicator. On the other hand, less clear results come from the canonical correlation analysis: SWBI and BES seem to share a significan t laten t v ariable, i.e. they carry , to some exten t, the same piece of information ab out w ell-b eing. Nevertheless, the canonical co efficien ts of the tw o sets of indicators often sho w opp osite signs, th us suggesting that the comp onen ts of SWBI and BES, despite their apparent similar conten t, measure differen t dimensions or definitions of well-being. 22 References Ceron A, Curini L, Iacus SM (2013) So cial Media e Sentimen t Analysis: L’ev oluzione dei fenomeni so ciali attra verso la Rete. Sxl - Springer for Inno- v ation, Springer Ceron A, Curini L, Iacus SM (2015) isa: a fast, scalable and accurate algorithm for sen timent analysis of so cial media con tent. submitted pp 1–30 Chiao C, Hung K, Lee C (2004) The price adjustment and lead-lag relations b e- t ween sto c k returns: Microstructure evidence from the taiw an stock mark et. Empirical Finance 11:709–731 Chida Y, Stepto e A (2008) P ositive psychological w ell-b eing and mortalit y: a quan- titativ e review of prosp ective observ ational studies. Psychosomatic medicine 70(7):741–756, DOI 0.1097/psy .0b013e31818105ba Clark A (2003) Inequalit y-av ersion and income mobility: A direct test. DEL T A W orking Papers 2003-11, DEL T A (Ecole normale sup ´ erieure), URL https:// ideas.repec.org/p/del/abcdef/2003- 11.html Clark AE, Oswald AJ (1994) Unhappiness and unemploymen t. Economic Journal 104(424):648–59, URL http://EconPapers.repec.org/RePEc:ecj:econjl: v:104:y:1994:i:424:p:648- 59 Com te F, Renaut E (1996) Non-causality in contin uous time mo dels. Econometric Theory 12:215–256 Coup er M (2013) Is the sky falling? new technology , c hanging media, and the future of surv erys. Survey Research Metho ds 7(3):145–156 Curini L, Iacus SM, Cano v a L (2015) Measuring idiosyncratic happiness through the analysis of t witter: An application to the italian case. So cial Indicators Researc h 121(2):525–542, URL http://EconPapers.repec.org/RePEc:spr: soinre:v:121:y:2015:i:2:p:525- 542 Deaton A (2012) The Financial Crisis and the W ell-Being of America, Univ ersity of Chicago Press, Chicago, IL, c hap 10. Pp. 343-368 Di T ella R, MacCullo c h R (2008) Gross national happiness as an answer to the east- erlin paradox? Journal of Developmen t Economics 86(1):22–42, DOI h ttp://dx. doi.org/10.1016/j.jdev eco.2007.06.008, URL http://www.sciencedirect.com/ science/article/pii/S0304387807000600 23 Fleurbaey M (2009) Bey ond gdp: The quest for a measure of so cial w elfare. Journal of Economic Literature 47(4):1029–75, DOI 10.1257/jel.47.4.1029, URL http: //www.aeaweb.org/articles.php?doi=10.1257/jel.47.4.1029 F rey BS, Stutzer A (2002) What can economists learn from happiness re- searc h? Journal of Economic Literature 40(2):402–435, DOI 10.1257/ 002205102320161320, URL http://www.aeaweb.org/articles.php?doi=10. 1257/002205102320161320 Ha yashi T, Y oshida N (2005) On cov ariance estimation of non-synchronously ob- serv ed diffusion pro cesses. Bernoulli 11:359–379 Ha yashi T, Y oshida N (2008) Asymptotic normality of a cov ariance estimator for nonsynchronously observ ed diffusion processes. Annals of the Institute of Statistical Mathematics 60:367–406 Hoffmann M, Rosen baum M, Y oshida N (2013) Estimation of the lead-lag param- eter from non-sync hronous data. Bernoulli 19(2):426–461 Hopkins D, King G (2010) A method of automated nonparametric con tent analysis for so cial science. American Journal of Political Science 54(1):229–247 Hotelling H (1936) Relations b et ween t wo sets of v ariates. Biometrik a 28:321–377 Iacus SM (2014) Big data or big fail? the go o d, the bad and the ugly and the miss- ing role of statistics. Electronic Journal of Applied Statistical Analysis: Decision Supp ort Systems and Services Ev aluation 5(1):4–11 IST A T (2014) Rapp orto b es 2014: il b enessere equo e sostenibile in italia. URL h ttp://www.istat.it/it/archivio/126613 de Jong F, Nijman T (1997) High frequency analysis of lead-lag relationships b et w een financial markets. Journal of Empirical Finance 4:259–277 Kahneman D, Krueger AB (2006) Dev elopments in the measurement of sub jec- tiv e well-being. Journal of Economic Perspectives 20(1):3–24, DOI 10.1257/ 089533006776526030, URL http://www.aeaweb.org/articles.php?doi=10. 1257/089533006776526030 Kahneman D, Krueger AB, Sc hk ade D, Sch w arz N, Stone A (2004) T ow ard na- tional well-being accoun ts. American Economic Review 94(2):429–434, DOI 10. 1257/0002828041301713, URL http://www.aeaweb.org/articles.php?doi= 10.1257/0002828041301713 24 Kang J, Lee C, Lee S (2006) Empirical inv estigation of the lead-lag relations of returns and volatilities among the k ospi200 sp ot, futures and options mark ets and their explanations. Journal of Emerging Mark et Finance 5:235–261 Kramer AD (2010) An unobtrusive b ehavioral mo del of ”gross national happiness”. In: Pro ceedings of the SIGCHI Conference on Human F actors in Computing Sys- tems, ACM, New Y ork, NY, USA, CHI ’10, pp 287–290, DOI 10.1145/1753326. 1753369, URL http://doi.acm.org/10.1145/1753326.1753369 Kuhn A, Laliv e R, Zw eim ¨ uller J (2009) The public health costs of job loss. Journal of Health Economics 28(6):1099–1115, URL http://EconPapers.repec.org/ RePEc:eee:jhecon:v:28:y:2009:i:6:p:1099- 1115 Legendre P (2005) Sp ecies asso ciations: the kendall co efficien t of concordance re- visited. Journal of Agricultural, Biological, and Environmen tal Statistics 10:226– 245 Lyub omirsky S, King L, Diener E (2005) The b enefits of frequen t p ositiv e affect: do es happiness lead to success? Psychological bulletin 131(6):803–855 New Economic F oundation N (2012) The happy planet index: 2012 rep ort. a global index of sustainable well-being. URL h ttp://www.happyplanetindex.org/assets/happ y-planet-index-report.p df P entland A (2014) So cial Ph ysics: How Go od Ideas Spread-the Lessons from a New Science. Penguin Publishing Group, URL https://books.google.it/books? id=d3IenQEACAAJ Rob ert C, Rosenbaum M (2011) A new approach for the dynamics of ultra high frequency data: The mo del with uncertaint y zones. Journal of Financial Econo- metrics 9:344–366 Rozanski A, Blumenthal JA, Kaplan J (1999) Impact of psychological factors on the pathogenesis of cardio v ascular disease and implications for therapy . Circulation 99(16):2192–2217, DOI 10.1161/01.CIR.99.16.2192, URL http://circ.ahajournals.org/content/99/16/2192.abstract , http: //circ.ahajournals.org/content/99/16/2192.full.pdf+html Sabatini F (2014) The relationship b et ween happiness and health: Evi- dence from italy . Social Science & Medicine 114:178–187, DOI http://dx.doi. org/10.1016/j.so cscimed.2014.05.024, URL http://www.sciencedirect.com/ science/article/pii/S0277953614003189 25 Sc hw arz N (1999) Self-rep orts: how the questions shap e the answers. American psyc hologist 54(2):93–105 Sc hw arz N, Strac k F (1999) Rep orts of sub jectiv e w ell-b eing: Judgmen tal pro cesses and their metho dological implications. W ell-b eing: The foundations of hedonic psyc hology 7:61–84 Stepto e A (ed) (2007) Depression and ph ysical illness. Cam bridge Univ ersity Press Stepto e A, Deaton A, Stone AA (2015) Sub jectiv e wellbeing, health, and ageing. The Lancet 385(9968):640–648 Stiglitz J, Sen A, Fitoussi JP (2009) Rep ort by the commission on the measuremen t of economic p erformance and so cial progress. URL h ttp://www.insee.fr/fr/publications-et-services/dossiers web/stiglitz/doc- commission/RAPPOR T anglais.p df Zhang L (2011) Estimating cov ariation: Epps effect, microstructure noise. Journal of Econometrics 160:33–47 26
Original Paper
Loading high-quality paper...
Comments & Academic Discussion
Loading comments...
Leave a Comment