A survey on measuring indirect discrimination in machine learning
Nowadays, many decisions are made using predictive models built on historical data.Predictive models may systematically discriminate groups of people even if the computing process is fair and well-intentioned. Discrimination-aware data mining studies…
Authors: Indre Zliobaite
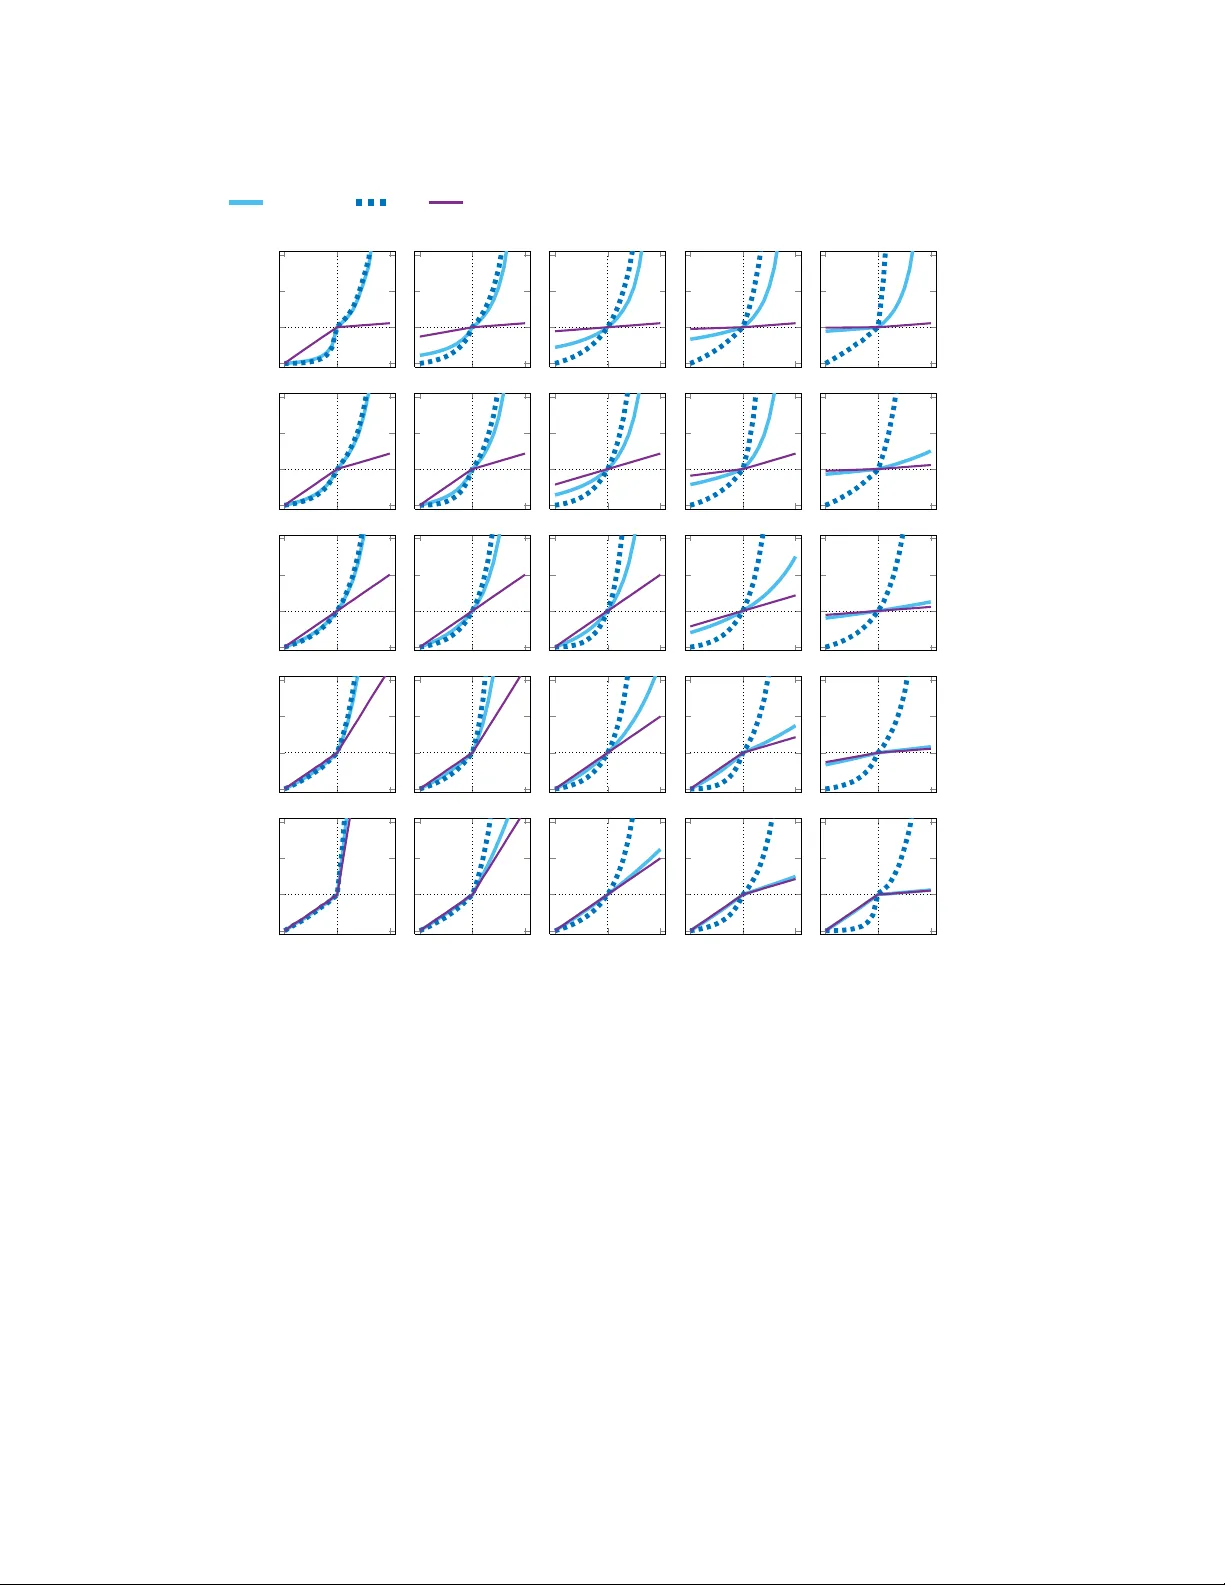
0 A survey on measuring indirect discrimination in mac hine learning INDR ˙ E ˇ ZLIOBAIT ˙ E , Aalto University and Helsinki Ins titute for Information T ec hnology HIIT Nowadays , many decisions ar e made usin g predictive models built on historical data. Predictive models may systematically discriminate groups of people even if the computing process is fair an d well-in tentioned. Discrimination-aware data mining studies how to make predictive models free from discrimination, wh en historical data, on w hich they are built, may be bias ed, incomplete, or even contain past discriminatory decisions. Discrimination refers to disadvantageous treatment of a person based on belonging to a category rather than on individu al merit. In this survey we review and organize v arious discrimination measures th at have been used for measuring discrimination in data, as well as in evaluatin g performance of discrimination- aware predictive models. W e a l so discuss related measures from other disciplines, wh ich have not been u sed for measu ring discrimination, but poten t ially could be suitabl e for this pu rpose. W e computationally ana l y ze properties of selected measures. W e also review and discuss meas u ring procedures , and present recommen- dations for practitioners . The primary target audien ce is dat a mining, machine learning, pattern recogni- tion, statistical modeling researc hers developing new methods for non-discriminatory predictive modeling. In a dditi on , practitioners and policy makers would use t he su rvey for diagnosin g potential discrimination by predictive models . General T erms: fairness in machine learning, predictive modeling, non-discrimination, discrimination- aware data minin g ACM Journal Name, Vol . 0, No. 0, Art icle 0, Publication date: October 2015. 0:2 I. ˇ Zlioba it ˙ e Contents 1 Introduction 3 2 Background 4 2.1 Discrimination and law . . . . . . . . . . . . . . . . . . . . . . . . . . . . . 4 2.2 Discrimination-aware machine le arning and data mining . . . . . . . . . 5 3 Machine learni ng s ettings, definitions and scenarios 6 3.1 Definition of fairness for machine learning . . . . . . . . . . . . . . . . . 6 3.2 Mac hine learning task settings . . . . . . . . . . . . . . . . . . . . . . . . 6 3.3 Principles f or making machine learning non-discriminatory . . . . . . . 7 4 Discrimination measure s 8 4.1 Statis tical tests . . . . . . . . . . . . . . . . . . . . . . . . . . . . . . . . . 9 4.1.1 Regression slope test . . . . . . . . . . . . . . . . . . . . . . . . . . 9 4.1.2 Differen ce of means test . . . . . . . . . . . . . . . . . . . . . . . . 10 4.1.3 Differen ce in propo rtions for two gro u ps . . . . . . . . . . . . . . . 10 4.1.4 Differen ce in propo rtions for many gro ups . . . . . . . . . . . . . . 10 4.1.5 Other tests and related fields . . . . . . . . . . . . . . . . . . . . . 10 4.2 Absolute measures . . . . . . . . . . . . . . . . . . . . . . . . . . . . . . . 10 4.2.1 Mean differe nce . . . . . . . . . . . . . . . . . . . . . . . . . . . . . 10 4.2.2 Normalized difference . . . . . . . . . . . . . . . . . . . . . . . . . 11 4.2.3 Area under curve (AUC) . . . . . . . . . . . . . . . . . . . . . . . . 11 4.2.4 Impact ratio . . . . . . . . . . . . . . . . . . . . . . . . . . . . . . . 11 4.2.5 Elift ratio . . . . . . . . . . . . . . . . . . . . . . . . . . . . . . . . . 11 4.2.6 Odds ratio . . . . . . . . . . . . . . . . . . . . . . . . . . . . . . . . 11 4.2.7 Mutual information . . . . . . . . . . . . . . . . . . . . . . . . . . . 12 4.2.8 Balanced residuals . . . . . . . . . . . . . . . . . . . . . . . . . . . 12 4.2.9 Other possible measures . . . . . . . . . . . . . . . . . . . . . . . . 12 4.2.10 Measuring fo r m o re than two groups . . . . . . . . . . . . . . . . . 12 4.3 Conditional m e asures . . . . . . . . . . . . . . . . . . . . . . . . . . . . . . 13 4.3.1 Unexplaine d differe nce . . . . . . . . . . . . . . . . . . . . . . . . . 13 4.3.2 Propensity measure . . . . . . . . . . . . . . . . . . . . . . . . . . . 13 4.3.3 Belift ratio . . . . . . . . . . . . . . . . . . . . . . . . . . . . . . . . 14 4.4 Structural measures . . . . . . . . . . . . . . . . . . . . . . . . . . . . . . 14 4.4.1 Situation testing . . . . . . . . . . . . . . . . . . . . . . . . . . . . 14 4.4.2 Consistency . . . . . . . . . . . . . . . . . . . . . . . . . . . . . . . 15 5 Analysis of core measures 15 6 Recommendations for re searchers and practitioners 19 ACM Journal Name, Vol . 0, No. 0, Art icle 0, Pu blication date: October 2015. Discrimina tion measures 0:3 1. INTRODUCTION Nowadays , many decisions are made using p redictive models built on historical data, for instance, personalized pricing and reco mmendations, cred it scoring, automated CV screening o f jo b applicants , profiling of potential suspects by the police, and many more. P en e tration of mac h ine learning technologies , and decisions informed by big data has raised public aw areness that automated decision making may lead to discrimination [House 2014; Miller 2015; Burn-Murdoch 2013]. Pred ictive models may discriminate pe ople, e v en if the co mputing process is fair and well-inten tioned [Barocas an d Selbst 2016; Citron and III 2014; Calders and Zliobaite 2013]. This is be - cause m o st machine learning m e thods are based upon assumptions that the historical data is correct, and represents the population well, which is o ften far f rom reality . Discrimination-aware machine learning and d ata mining is an e merging discipline, which studies how to prev ent discrimination in predictive mo deling. I t is assumed that non-discrimination regulations, such as w hich characteristics, o r which groups of peo - ple are considered as protected , are extern ally defin ed by national an d inter national legislation. The goal is to mathematically f ormulate non- discrimination constraints , and de v elop machine learning alg o rithms that wou ld be able to take into account tho se constraints , and still be as accurate as possible. In the last few years researchers h ave develope d a number of discrimination-aware machine learn ing algorithms, using a variety of perfor mance me asure s . Neverthe le ss , there is a lack o f consensus how to define fairn e ss of pre dictive m odels, and ho w to measure the p erformanc e in terms of discrimination. Qu ite ofte n research papers pro- pose a ne w wa y to quantify discrimination, and a new algorithm that would optimize that me asure. The variety of approaches to evaluation makes it difficult to compare the re sults and assess the progress in the discipline, and eve n more imp ortantly , it makes it difficult to recommen d com p utational strategies for practitioners and policy makers. The g oal of this survey is to p resent a un ifying vie w towards discrimination mea- sures in machine learning, and unde r stand the implications of choosing to o ptimize one or anothe r me asure, because measuring is ce ntral in for m ulating o ptimization cri- teria f or algorithmic discrimination discovery and preven tion . Hence, it is imp ortant to have a structured survey at an early stage of develop m ent o f this r e search fie ld, in order to present task settings in a systematic way fo r f ollow up r e search, and to e nable systematic co m parison of approaches. Thus, we review and categorize measures that have be en used in machine le arn ing and data mining, and also discuss ex isting mea- sures f rom o ther fields, such as f e ature selec tio n , w hich in principle could be used for measuring discrimination. There are seve ral related surv e ys that can be viewed as complemen tary to this sur - vey . A rec e nt rev iew [Romei and Ruggieri 2014] p resents a m ulti-disciplinary context for d iscrimination-aware data mining. This survey contains a brief o verview of dis- crimination measures with do e s not go into analysis and comp arison o f the me asures , since the focus is on approaches to solutions across different d iscipline s (la w , ec o - nomics, statistics , computer science ). Anothe r rece nt revie w [Baroc as and Selbst 2016] discusses legal aspec ts of pote ntial d iscrimination by machine learning, m ainly focus- ing on American anti-discrimination law . A matured han d book o n measuring racial discrimination [Blank et al. 2004] foc uses o n surv eying and collecting evid e nce for dis- crimination discovery . The book is not considering discrimination by algorithms, only by h uman decision makers. The remaind er of the article is organized as follow s . Section 2 presents le- gal context, termino logy , and provides an o verview o f research in de v eloping non- discriminatory pre d ictive modeling appro aches . Our intention is to keep this section ACM Journal Name, Vol . 0, No. 0, Art icle 0, Publication date: Oct ober 2015. 0:4 I. ˇ Zlioba it ˙ e brief . An intere sted reader is referr e d to focused surveys [Ro mei and Ru g gieri 2014; Barocas and Selbst 2016] fo r more information. Section 4 re views and organizes d is- crimination me asures u sed in d iscrimination- aware machine learning and data min- ing, as well as potentially useful me asures from o ther fields. Section 5 analy z e s and compares a set of mo st popu lar measures, and discusses implications o f using one or the other . Finally , Section 6 pre sents recomm endations fo r re searchers , and con clude s the survey . 2. BA CKGROUND 2.1. Discri mination and law Discrimination translates f r om latin as a di stinguishi ng . While distinguishing is not wrong as such, discrimination has a negative conno tation re ferring to adversary treat- ment of people based o n belonging to some gro u p rather than individual merits. Pub- lic attention to discrimination pr evention has been increasing in the last few years. National and international anti-discrimination legislation are e xtending the scope of protection against discrimination, and expanding discrimination ground s . Adversary discrimination is undesired f r om the perspective of basic human rights , and in many areas of life no n-discrimination is enf orced by international and national legislation, to allow all individuals an equal prospect to acc e ss oppor tun ities available in a society [f or Fundamental R ig hts 2011]. Enforcing non- discrimination is not only for benefiting individuals. Considering individual merits rather than group character- istics is expected to bene fit de cision makers as w ell lead in g to mo re m ore informed , and thus likely more accurate decisions. Discrimination can be characterized by thre e main conce pts: (1) what actions (2) in which situations (3) towards who m are considered discriminatory . Actions are f orms of discrimination, situations are areas of discrimination, and gro unds of discrimination describe characteristics o f to wards w hom discrimination may occu r . F or e xample, the main grounds for discrimination defi ned in Europe an Council di- rectives [Commission 2011] (2000/43/EC , 2000/78/EC) are: race and e thn ic origin, dis- ability , age, religion o r belief, sexu al orientation, ge n der , nationality . Multiple discrimi- nation occu rs wh en a person is discriminated on a combination o f seve ral groun ds . The main areas of discrimination are: access to employme nt, access to education, employ- ment and w o rking con ditions, social pro tection, access to supply of goo ds and services. Discriminatory actions may take diffe rent f o rms, the two m ain o f which are kno wn as direct discrimination and indire ct discrimination. A dire c t discrimination occur s when a pe r son is treated less favorably than anothe r is, has been or would be treated in a co mparable situation on pro tected ground s . F or example, pro perty o wners are not renting to a minority racial tenant. An indirect discrimination (also know n as struc- tural d iscrimination) oc c u rs where an app are ntly ne utral pr o vision, criterio n or prac- tice would put persons of a protec ted gro und at a particular disadvantage comp are d with othe r person s . F or ex ample, a requireme nt to prod uce an I D in a fo r m of drive r’s license for entering a club may discriminate visually impaired peo ple, who cannot have a d river’s license. A related term statistical discri m ination [Arrow 1973] is of ten used in eco nomic mode lling. It refer s to ine quality betwee n demog r aphic groups occurring even when econom ic agents are rational and non-pre judiced. Indirect discrimination applies to machine learning and data mining, since algo- rithms produce decision rules or decision models. While hum an dec ision make r s may make biased decisions on case by case basis , rules produced by algorithms are ap- plied consistently , and may d iscriminate more systematically and at a large r scale. Discrimination due to algorithms is some times r e ferred to as digital discrim ination (e.g. [Wihbey 2015]) . ACM Journal Name, Vol . 0, No. 0, Art icle 0, Pu blication date: October 2015. Discrimina tion measures 0:5 General population, and even many data scientists may think that algorithms are based o n data, and, ther efore, models produced by algo r ithms are always objective. Howeve r , mode ls are as obje ctive as the data on which the y are app lied, and as long as the assumptions behind the mo dels perfec tly match the reality . In pr actice, this is rarely the case. Historical data may be biased, incom plete, or reco rd past discrimina- tory decisions that can easily be transferre d to predictive models, and re inforced in new decision making [Calders and Zliobaite 2013]. Lately , awareness of policy mak- ers and public attention to potential discrimination has been increasing [House 2014 ; Miller 2015; Burn-Murdo ch 2013], but there is a long way ahead before we c an fully understand h o w such discrimination h ap pens and how to preve nt it. 2.2. Discri mination-aware machine learning and data mining Non-discriminatory machine learning an d data mining, a discipline at an intersec- tion of computer science, law and social sciences, f o cuses on tw o main re search dire c- tions: discrimina tion di scovery , an d discriminati on preve n tion . Discrimination d iscov- ery aims at finding discriminatory patterns in data using data mining metho ds. D ata mining approach for discrimination discovery typically mines association and classifi- cation rules from the d ata, and then assesses those ru les in terms o f potential discrim- ination [Rug g ieri et al. 2010; Romei et al. 2012; Hajian and Do mingo-F errer 2013 ; P ed r eschi et al. 2012; Luon g et al. 2011; Mancuhan and Clifton 2014]. A mo re tradi- tional statistical app roach to discrimination discove ry typically fits a regression mode l to the data including the protected features ( such as race, gende r ), and then analyzes the magnitude and statistical sign ificance of the regression coefficie n ts at the p r otected attributes (e.g. [Ede lman and Luca 2014] ). If those coeffic ients appe ar to be signifi c ant, then discrimination is flagged. Discrimination prevention develop s machine learning algo rithms that would pro- duce p redictive models, ensuring that those models are free from discrimination, while, standard p redictive mod els , ind uced by m achine learning and data mining algorithms, may discriminate gro u ps of people due to training data be in g biased, inco mplete, or recording past discriminatory decisions. The goal is to have a mode l (de cision rules) that wo uld obey non-discrimination constraints , typically the constraints d irectly re - late to the selecte d d iscrimination measure. Solutions for discrimination preven tion in predictive models fall into thre e categorie s: data pre processing, m o del postproce ssing , and mo del regularization. Data preproce ssing modifies the historical data such that the data no lon ger con tains discrimination, and then uses re gular machine learning algorithms for mod el indu c tio n . Data prepr o cessing may m o dify the target variable [Kamiran and Calde rs 2009; Mancuhan an d Clifton 2014; Kamiran e t al. 2013a], or modify inp u t data [F eldman et al. 2015; Zemel et al. 2013]. Model postprocessing p ro- duces a regular mode l and then modifies it (e.g. by changing the labels of some leaves in a d ecision tree) [ Kamiran et al. 2010; Calders and V erwer 2010]. Model regu larisa- tion adds optimization constraints in the mo d el learning phase (e.g. by modifying the splitting criteria in decision tre e learning) [ Kamiran et al. 2010; Calde rs et al. 2013 ; Kamishima et al. 2012]. An interested reade r is invited to consult an edited book [Custers e t al. 2013], a spe c ial issue in a journal [Mascetti et al. 2014], and proceed - ings of three workshops in discrimination-aware data minin g and m achine learning [Calders and Zliobaite 2012 ; Barocas and Hardt 2014; Barocas et al. 2015] fo r more details . Defining coheren t discrimination me asures is cen tral fo r both lines of research: d is- crimination discovery and d iscrimination preven tion. Discrimination discovery needs a measure in o rder to jud ge whether there is discrimination in data. Discrimination preven tio n needs a measure as an o ptimization criteria in order to sanitize p redictive models. Hence, ou r main focus in this survey is to review discrimination measures, ACM Journal Name, Vol . 0, No. 0, Art icle 0, Publication date: Oct ober 2015. 0:6 I. ˇ Zlioba it ˙ e and analyze the ir p roperties, and un d erstand implications of using one or another measure. 3. MA CHINE LEARNING SETTINGS, DEFINIT IONS AND SCENARIOS 3.1. Defini tion of fairness f or machine learning In the con text of machine learning non-discrimination c an be defin e d as fo llows: (1) people that are similar in terms non-protected characteristics should receive similar predictions, and (2) differences in predictions acros s g roups of people can only be as large as justifie d by non-protected characteris tics. The first condition relates to direct discrimination, and can be illustrated by so called twin test : if g ender is the protected attribute and we have two identical twins that share all characteristics , but g ender , the y sho uld re c eive identical p redictions. The first part is n e cessary but n ot sufficie nt condition to make sure that there is no dis- crimination in decision making. The second condition ensures that ther e is no indirect discrimination, also re ferred to as red l ining . F or example, banks used to deny loans fo r residents of selec te d neigh- borhoods. Eve n though race was n ot formally used as a d ecision criterion, it appeared that the e x cluded neighborhoo ds had m uch higher popu lation of non-w h ite pe ople than average. Ev en though people fro m the same neighbo rhood (”twins”) are treated the same way no matter w h at the race is, artificial lo wering of positive decision rates in the non-white- dominated neighbo rhoods wo u ld harm the non-w hite population more than white. The r efore, diffe r ent de c ision rate s acro ss n eighborho ods can only be as large as justified by non-p rotected characteristics , and this is what the seco n d part of the definition controls. More formally , let X be a set o f variables describing non-protected characteristics of a person, S be a set of variables de scribing the p rotected characteristics , and ˆ y be the model output. A p r edictive model can be con sidered f air if: (1) the ex p ected value for mode l output doe s no t depe nd on the p r otected characteristics E ( ˆ y | X , S ) = E ( ˆ y | X ) for all X and S , that is, the re is no direct discrimination; and (2) if non-pro tected characteristics and pro te cted characteristics are not indepen dent, then the e xpected value for model ou tput de penden c e on tho se no n-protected characteristics should be justified, that is if E ( X | S ) 6 = E ( X ) , then E ( ˆ y | X ) = e ⋆ ( ˆ y | X ) , where e ⋆ is a constraint. Finding and justifying e ⋆ is n on-trivial and very challenging, and that is where a lot of ongoing effort in discrimination-aware machine learning concentrate. 3.2. Machine learning task setting s Machine learnin g settings for decision support, wh ere discrimination may poten tially occur , can take many diffe rent fo rms . The v ariable that is to be predicted – target vari- able – may be binary , ordinal, or numeric, corresponding to binary classi fication, mul- ticlass classification or regression tasks. As an example of a binary class ification task in the banking domain could be deciding whethe r to accept o r de cline loan app lication of a person. Multiclas s classificati on task could be to determin e to w hich customer ben- efit program a person should be assigned (e.g. ”golden clients”, ”silver clients”, ”bronze clients”). Re gression task could be to de termine the interest rate for a particular lo an for a particular person. Discrimination can occur o nly when target variable is polar . That is, e ach task set- ting some o utcomes should be considered superior to others. F or ex ample, getting a loan is better than not g e tting a loan, or the ”golden client” package is better than the ”silver”, and ”silver” is better than ”bronze ”, o r assigned interest rate 3% is better than 5% . If the target v ariable is not p olar , the re is no d iscrimination, becau se no treatment is superior or inferior to other treatment. ACM Journal Name, Vol . 0, No. 0, Art icle 0, Pu blication date: October 2015. Discrimina tion measures 0:7 Fig. 1 . A typical machine learning setting. The protected characteristic, in machine le arn ing settings referre d to as the pro- tected variable or sensitive attribute, may as well be binary , categorical or n u meric, and it does no t need to be polar . F or ex ample, gender can be encod ed with a binary protected v ariable, ethnicity can be enco ded with a catego rical v ariable, and age can be encoded w ith a nu merical variable. In principle, any combination one or mo re per - sonal characteristics may be required to be protected. Discrimination on mor e than one ground is known as multipl e discrim ination , and it m ay be required to e nsure preven- tion of m u ltiple discrimination in pre dictive mode ls . Thus, id e ally , machine learning methods and discrimination measures should be able to handle any type or a co mbi- nation of pr otected variables . F or instance, the authorities may want to e nforce non- discrimination with respect to e thnicity in dete rmining interest rate, or n o n discrimi- nation with respect to g ender and age in d e ciding w h ether to accept loan app lications . In discrimination pre vention it is assumed that the protec te d ground is extern ally given, f or example, by law . 3.3. Princi ples f or making machine learning non-discriminat ory A typical machine learn ing pro cess is illustrated in Figure 1. A m achine le arn ing al- gorithm is a p rocedure used for producin g a pred ictive model f r om historical data. A model is the resulting decision rule (o r a collectio n of rules). The resulting model is used for decision making fo r new incoming data. The mode l would take personal characteristics as inputs (f or ex ample, income, credit history , e m ployment status), and output a prediction ( for example, cred it risk leve l) . Algorithms themselves d o not discriminate, because they are not used for decision making. Models (d ecision rules) that are used f o r de cision making may po tentially discriminate pe ople with re spect to certain characteristics . Algorithms, on the other hand, may be discrimination-aware by employing specific pr o cedure s du ring mo del construction to en f orce non-discriminatory constraints into the models. Hence, on e of the main go als of discrimination-aware machine learning and data mining is to de- velop discrimination-aware algor ithms , that wo uld guarantee that no n-discriminatory models are p roduced . There is an ongoing debate in the d iscrimination-aware data mining and machine learning community whether models should or should not u se p rotected characteris- tics as inputs. F or e x ample, a cre dit risk assessment mode l may use ge nder as input, or may leave the gender variable ou t. O u r position on the matter is as follows. Using the pro tected characteristic as model input may h elp to ensure that there is no ind irect discrimination (for e xample, as demonstrated in the e xperimen tal sec tion of []) . How- ever , if a mode l uses the protected characteristic as inp ut, the mo del is no t treating two persons that share identical characteristics except f o r the pro tected characteristic the same way , a direct discrimination would be prop agated. There fore, such a mo d el ACM Journal Name, Vol . 0, No. 0, Art icle 0, Publication date: Oct ober 2015. 0:8 I. ˇ Zlioba it ˙ e T able I. Discrimination measure types Measures Indicate what? Type of discrimination Statistical tests presence/absence of discrimination indirect Absolute measures magnitude of discrimination indirect Conditional measures magnitude of discrimination indirect Structural measures spread of discrimination direct or indirect would be discriminatory d iscriminatory due to violation of condition #1 in the defi n i- tion in Section ?? . Hence, the mode l should no t u se the protecte d characteristic for decision making. Howeve r , we see no proble m in using the p rotected characteristic in the mode l learn - ing pro cess , which of ten may he lp to enforce non -discrimination constraints. Thus , ma- chine learning algorithms can use the protected characteristic in the learning phase, as long as the resulting pred ictive m odel doe s not require the protecte d characteristic when used for decision making. Ensuring that the re is no indirect discrimination is much more tricky . In order to verify to what extent non-discriminatory constraints are obeyed , and enf o rce fair allo- cation of predictions across gro ups o f pe ople, machine learning algorithms mu st have access to the protecte d characteristics in the historical d ata. W e argue that if pro - tected information (e.g. gend e r or race ) is not available during the mod el learning building pr ocess, the learning algorithm cannot be discrimination-aware, because it cannot actively control no n-discrimination. The resulting mod els produ c es without ac- cess to sensitive infor mation may be discriminatory , m ay be not, but that is by chance rather than discrimination-awareness prope rty of the algorithm. Non-discrimination can p otentially be me asured on data (historical data), on pre - dictions made by models, o r on mod els themselves. Diffe rent task settings and appli- cation goals may require diff erent measurement techniques . In order to select appro- priate measures, which also typically ser v e as optimisation constraints in the non- discriminatory model learn in g pro cess , it is impo rtant to unde rstand und erlying as- sumptions and basic p rinciples behind differ e nt discrimination measures. The ne x t section presents a cate g orized survey o f measures used in the discrimination-aware data min in g and machine learning literature, and discusses other e xisting m easures that could in principle be used for m easuring fairness o f algorithms . The go al is to present arguments for selecting relevant measures for differe nt learning settings. 4. DISCRIMINA TION MEASURES Discrimination measures can be catego rized into (1) statistical tests, (2) absolute m e a- sures, ( 3) conditional measures, and (4) structural measures. W e survey measures in this order due to historical reasons, which is more or less how they came into use. First statistics tests w ere used which wo uld answer yes or no, then absolute mea- sures came into p lay that allow quantifying the extent of discrimination, then con- ditional measures app eared that take into acco unt po ssible legitimate ex planations of diffe rences be tween different group s of pe ople. Statistical te sts, absolute measures and co nditional m e asures are designe d for indicating indirect discrimination. Struc- tural me asures have been intro d uced mainly in accord to mining classification ru les, aiming at discov ering direct discrimination, but in principle they c an also addre ss in d i- rect discrimination. All these types are not intended as alternatives, but rather reflect differen t aspects of the problem, as summarized in T able I. Statisti cal tests indicate presence or absence of discrimination at a dataset leve l, they do not measure the magnitude of discrimination, ne ither the spread of discrimi- nation within the dataset. Absolute me asures capture the magnitude o f discrimination over a d ataset taking into acco unt the protected characteristic, and the pred ictio n deci- ACM Journal Name, Vol . 0, No. 0, Art icle 0, Pu blication date: October 2015. Discrimina tion measures 0:9 T able I I. Solutions Symbol Explanation y target variable, y i denotes the i th observation y i a value of a binary target variable, y ∈ { y + , y − } s pro tected variable s i a value of a discreet/binary protected variable, s ∈ { s 1 , . . . , s m } typically index 1 denotes a protected group, e.g . s 1 - black, s 0 - white race X a set of input variables (predictors), X = { x (1) , . . . , x ( l ) } z ex planatory variable or stratum z i a value of explanatory variable z ∈ { z 1 , . . . , z k } N n umber of individuals in the dataset n i number of individuals in group s i sion; no other characteristics of individuals are consider ed. It is assumed that all indi- viduals are alike, and there should be no differen ces in decisions for the protected and the ge neral gro up of peo ple, disregarding any possible explanation. Absolute measures generally are no t fo r u sing stand alone on a dataset, but rather provid e core principle s for cond itional measures, or statistical te sts . Co nditional measures capture the mag- nitude of discrimination, which canno t be explaine d by any non- protected characteris- tics of indiv id uals . Statisti cal tests, absolute and conditional me asure s are de sign e d to capture indirect discrimination at a dataset level. Structural me asures do no t measure the magn itude of discrimination, but the spread of d iscrimination, that is , a share o f people in the dataset that are affected by direct discrimination. Our survey of measures will use mathematical notation as summarized in T able II. F or simplicity we will use the fo llowing sho rt p robability no tation: p ( s = 1) will be encode d as p ( s 1 ) , and p ( y = +) will be enco ded as p ( y + ) . Let s 1 denote the prote c ted community , and y + denote the desired decision (e.g. positive de c ision to g rant a loan). Upper indices will denote values, lower indices will deno te counte r s of variables. 4.1. Statis tical tests Statisti cal tests are the earliest me asures for indire ct discrimination discove ry in data. Statisti cal tests are formal proced ures to acce pt o r re ject statistical hypo theses, which check how likely the result is to have occurred by chance. In discrimination analysis typically the null hypo thesis , o r the default p osition, is t hat there i s no differ ence between the treatment of the gen eral group and the p r otected gro up. The test checks, how likely the observed differenc e between gro ups has occurred by chance. If chance is u nlikely then the null hypothesis is rejecte d and discrimination is declared. Two limitations of statistical tests need to be kept in min d whe n using them for measuring discrimination. (1) Statistical significance does not mean practical sign ificance; statistical tests do not show the mag nitude of the the diff e rences betwee n the groups, which can be hug e, or can be minor . (2) If the nu ll hypothe sis is rej e cted then discrimination is present, but if null hypothe- sis cann o t be rejected , this does not prove that there is no discrimination. It maybe that the data sample is too small to de clare discrimination. Standard statistical tests are typically applied for me asuring discrimination. The same tests are used in clinical trials, marketing, and scientific research. 4.1.1. Regression slope test. The test fits an ordinary least squares ( OLS) reg ression to the data including the protected variable, and tests whether the regr e ssion coef fi- cient of the protected variable is significantly differ ent from ze r o. A basic version for discrimination discover y co nsiders o nly the pr o tected characteristic s and the target variable y [Yinger 1986]. In principle s and y can be binary or nu m eric, but typically ACM Journal Name, Vol . 0, No. 0, Art icle 0, Publication date: Oct ober 2015. 0:10 I. ˇ Zlioba it ˙ e in discrimination testing s is binary . The regression may include o nly the protec te d variable s as a p r e dictor , but it may also include variables f rom X that may e x plain some of the observed differenc e in decisions. The test statist ic is t = b/σ , whe re b is the estimated reg ression coeffic ie nt of s , and σ is the standard error , comp u ted as σ = √ P n i =1 ( y i − f ( y i )) 2 √ ( n − 2) √ P n i =1 ( s i − ¯ s ) 2 , wh ere n is the n umber of observations, f ( . ) is the regr ession model, ¯ . indicates the mean. The t-test with n − 2 degree s of freedo m is applied. 4.1.2. Dif ference of mean s test. The null hypothe sis is that the means of the two g roups are equal. The test statistic is t = E ( y | s 0 ) − E ( y | s 1 ) σ √ 1 /n 0 +1 /n 1 , w here n 0 is the numbe r of indi- viduals in the regular group, n 1 is the number of individuals in the pro tected group, σ = p (( n 0 − 1) δ 2 0 + ( n 1 − 1) δ 2 1 ) / ( n 0 + n 1 − 2) , where δ 2 0 and δ 2 1 are the sample target variances in the respective grou ps . The t-test with n 0 − n 1 − 2 degre es of freedo m is applied. The test assumes indepen dent samples, normality and equal variance s . 4.1.3. Dif ference in prop or tio ns for two group s. The null hypothesis is that the rates o f positive outcomes within the two groups are equal. The test statisti c is z = p ( y + | s 0 ) − p ( y + | s 0 ) σ , where σ = q p ( y + | s 0 ) p ( y − | s 0 ) n 0 + p ( y + | s 1 ) p ( y − | s 1 ) n 1 . The z-test is used. 4.1.4. Dif ference in propo r tion s for many groups. The null hy pothesis is that the probabil- ities or proportions are equal for all the group s . This can be used fo r te sting many groups at once. F or examp le, equality o f decisions f o r diffe r ent ethnic grou p s , o r age groups. If the null hypo thesis is re jected that means at least o n e of the g roups has statisti cally significantly different proportion. The tex t statist ic is χ 2 = P k i =1 ( n i − np ( y + | s i )) 2 p ( y + | s i ) , where k is the n umber o f g roups. The Chi-Square test is used with k − 1 de grees o f f reedom. 4.1.5. Othe r te sts an d re lated fields. Relation to clinical trials where protected attribute is the treatment, and outcome is recov ery . Prove that the re is an effe ct (there is a discrimination). Does no t pr ove that there is no discrimination. Neither say anything about the magn itude. F or example, redu ce the flue recove ry by 10 min. ( p ractically irrelevant). It m ay be still relev ant for discrimination. Also marketing (measuring the effects of intervention) . Rank test MannWhitney U test is applied fo r comparing two groups when the nor- mality and equal variances assumptions are not satisfied. The n u ll hy pothesis is that the distributions o f the two po pulations are ide ntical. The proce dure is to rank all the observations from the largest y to the smallest. The te st statistic is the sum of ranks of the protected group. 4.2. Absol ute measures Absolute measures are designed to capture the m agnitude o f the differe n ces betwe e n (typically two) groups o f people. The groups are determined by the pr o tected charac- teristic (e.g. one gro up is males, another gro up is females). I f more than o ne protected group is analyzed (e.g. d ifferent nationalities), typically e ach group is compared sepa- rately to the most favored gro up. 4.2.1. Mea n diff erence. Mean differe n ce measures the diffe rence between the means of the targets of the protecte d group and the g eneral g roup, d = E ( y + | s 0 ) − E ( y + | s 1 ) . If ther e is no t diffe rence then it is considere d that there is n o discrimination. The ACM Journal Name, Vol . 0, No. 0, Art icle 0, Pu blication date: October 2015. Discrimina tion measures 0:11 measure relates to the d ifferenc e of means, and differe n ce in pro p ortions test statistics , except that there is no correction for the standard deviation. The mean difference for binary classification with binary protecte d fea- ture, d = p ( y + | s 0 ) − p ( y + | s 1 ) , is also known as the discrimination score [Calders and V e rwer 2010], or sliftd [Pedreschi et al. 2009]. Mean differen ce h as been the most popular measure in early work on non-discriminatory machine learning and data mining [Pedreschi et al. 2009; Calders and V erw er 2010; Kamiran and Calders 2009; Kamiran e t al. 2010; Calders e t al. 2013; Zemel et al. 2013]. 4.2.2. Nor malized di fference. Normalized difference [Zliobaite 2015 ] is the mean dif- ference for binary classification norm alized by the rate of positive outcomes, δ = p ( y + | s 0 ) − p ( y + | s 1 ) d max , wh ere d max = min p ( y + ) p ( s 0 ) , p ( y − ) p ( s 1 ) . This measure takes into account maximum possible discrimination at a giv en po sitive outco m e rate, such that with maximum possible discrimination at this rate δ = 1 , while δ = 0 indicates no d iscrimi- nation. 4.2.3. Area un der cur ve (A UC). This measure relates to rank tests. It has be en used in [Calders et al. 2013 ] fo r measuring discrimination be tween two groups when the tar - get variable is num e ric (re gression task), AU C = P ( s i ,y i ) ∈ D 0 P ( s j ,y j ) ∈ D 1 I ( y i >y j ) n 0 n 1 , where I ( true ) = 1 and 0 otherwise. F or large datasets compu tation becomes time and memo ry intensive, since a quadratic numbe r of comparisons to the nu mber o f observations is require d. The au- thors did not mention , but there is an alternative way to c o mpute based on ranking, which, de pending o n the speed ranking algorithm, may be faster . Assign nu meric ranks to all the observ ations , beginning with 1 f o r the smallest v alue. Let R 0 be the sum o f the ranks for the favored gro up. Then AU C = R 0 − n 0 ( n 0 +1) 2 . W e observ e that if the target v ariable is binary , and in case o f equality half of a point is ad ded to the sum, then AUC linearly relates to mean diffe rence as AU C = p ( y + | s 0 ) p ( y − | s 1 ) + 0 . 5 p ( y + | s 0 ) p ( y + | s 1 ) + 0 . 5 p ( y − | s 0 ) p ( y − | s 0 ) = 0 . 5 d + 0 . 5 , whe r e d denotes discrimination measured by the mean differe nce measure. 4.2.4. Impact ratio. Imp act ratio, also know n as slift [P ed reschi et al. 2009], is the ratio of positive outco mes for the pro tected group o ver the general gr o up, r = p ( y + | s 1 ) /p ( y + | s 0 ) . This measure is used in the US courts for quantifying discrimina- tion, the decisions are deemed to be discriminatory if the ratio of po sitive outcome s for the pro tected gr o up is below 80 % of that o f the gen eral g roup. Also this is the form stated in the Sex Discrimination Act of U .K. r = 1 indicates that the re is n o discrimi- nation. 4.2.5. Elift ratio . Elift ratio [ P edr eschi et al. 2008] is similar to impact ratio, but in- stead of dividing by the g eneral group, the de n ominator is the overall rate of positive outcomes r = p ( y + | s 0 ) /p ( y + ) . The same measure, exp ressed as p p ( y ,s ) p ( y ) p ( s ) < 1 + η for all values o f y and s , is later refe rred to as η - n eutrality [ Fukuchi e t al. 2013 ]. 4.2.6. Odds ratio. Odds ratio o f two p roportions is o ften u sed in natural, social and biomedical sciences to measure the association between exposure and outcome. The popularity is due to conv e nient relation with the logistic re gression. The expo nential function of the logistic regression coefficien t translates one unit increase in the od ds ratio. Odds ratio has been used fo r measuring discrimination [P edreschi e t al. 2009 ] as r = p ( y + | s 0 ) p ( y − | s 1 ) p ( y + | s 1 ) p ( y − | s 0 ) . ACM Journal Name, Vol . 0, No. 0, Art icle 0, Publication date: Oct ober 2015. 0:12 I. ˇ Zlioba it ˙ e 4.2.7. Mutu al inf o r mation. Mutual in f ormation (MI) is po p ular in infor mation the ory for measuring mutual de penden c e between variables. In discrimination literature this measure has be en ref erred to as no rmalized preju d ice inde x [Fukuchi et al. 2013 ], and used for measuring the magnitude of discrimination. Mutual info rmation is measured in bits , but it can be normalized such that the re sult falls into the range betwe en 0 and 1 . F or categ orical variables M I = I ( y,s ) √ H ( y ) ,H ( s ) , w here I ( s, y ) = P ( s,y ) p ( s, y ) log p ( s,y ) p ( s ) p ( y ) , and H ( y ) = − P y p ( y ) lo g p ( y ) . F or nume rical variables the summation is replaces by integral. 4.2.8. Bal anced resid uals. While o ther measures work on datasets , balanced resid- uals is for machine learning model outputs. This measure characterizes the dif- ference between the actual outcomes recorded in the dataset, and the mode l ou t- puts . The requireme nt is t hat underp redictions and o verpre d ictions should be bal- anced within the protected and regu lar groups . [Calders et al. 2013] propo sed bal- anced residuals as a criteria, not a measure. That is , the average residuals should be equal, but in pr in c iple the d ifference could be u sed as a me asure of discrimination d = P i ∈ D 1 y i − ˆ y i n 1 − P j ∈ D 0 y j − ˆ y j n 0 , where y is the true target value, ˆ y is the prediction. P ositive value s of d would indicate discrimination towards the protected group. One should; ho wever , use and interpret this measure with caution . If the le arning d ataset is discriminatory , but the pre dictive model m akes ideal pr e dictions such that all the residuals are zero, this measure wo uld show no discrimination, eve n though the pre- dictions wo u ld be discriminatory , since the original data is discriminatory . Suppose, another predictive mode l makes a c o nstant prediction for eve rybody , and the constant prediction is equal to the mean of the regular gr oup. If the learning dataset con tains discrimination, then the residuals for the regular grou p would be smaller than fo r the protected group, and the measure would ind icate discrimination, however , a constant prediction to everybo dy means tat every body is treated equ ally , and ther e should be no discrimination detected. 4.2.9. Othe r possible measure s. The re are man y est ablished m easures in feature se- lection literature [Guyon and Elisseeff 2003] fo r measuring the re lation between two variables , which, in principle, can be u sed as absolute discrimination me asures . The stronger the relation betwe en the protected variable s and the target variable y , the larger the absolute discrimination. There are three main grou ps o f measures for relation between v ariables: corre lation based, in f ormation the oretic, and one-class classifiers . Co r relation based measure s , such as the P erson correlation c o efficient, are typically used for numeric variables. Information theoretic measures , such as mutual information mentio n ed earlier , are typically used for categorical variables. One-class classifiers pre sent an inte r esting option. In discrimination the setting would be to predict the target y sole ly on the protected variable s , and measure the pre diction accur acy . W e are not aware of such attempts in the no n-discriminatory machine le arning literature, but it would be a valid option to explore. 4.2.10 . Measur ing for more th an two groups. Most of the absolute discrimination measures are for two groups (protecte d gro up vs. regu lar g roup). Ideas, how to apply tho se f or more than two groups, can be borrow e d fro m multi-class classification [Bishop 2006], multi-label classification [Tsoumakas and Katakis 2007], and one -class classification [T ax 2001] literature. Basically , the re are three op tions how to obtain sub-me asures: measure pairwise for e ach p air of gro ups ( k ( k − 1) / 2 comparisons), measure one against the rest for each gr oup ( k comparisons), measure each group against the r e gular group ( k − 1 comp arisons). The re maining question is how to agg r e gate the sub-me asures . ACM Journal Name, Vol . 0, No. 0, Art icle 0, Pu blication date: October 2015. Discrimina tion measures 0:13 T able III. Summary of absolute measures . Checkmark ( X ) indicates that it is di rectly applicable in a given machine lear ning setting. Tilde ( ∼ ) indicates that a straightf orward extension e xists (for instance , measur ing pairwise). Protected variabl e T arget varia ble Measure Binary Categoric Numeric Binary Ordinal Numeric Mean difference X ∼ X X Normalized difference X ∼ X Area under curve X ∼ X X X Impact ratio X ∼ X Elift ratio X ∼ X Odds ratio X ∼ X Mutual information X X X X X X Balanced residua ls X ∼ ∼ X X Correlation X X X X Based on personal conve rsations with legal ex perts, w e advocate for reporting the max- imum from all the comparisons as the final discrimination score. Alternatively , all the scores could be summed weighing by the grou p sizes to o btain an o verall discrimina- tion sco r e. Even though absolute me asure s do not take into accoun t any e xplanations of pos- sible dif f erence s of decisions across g r oups, the y can be considered as co r e building blocks for develo ping con ditional measures. Conditional measures do take into accou nt explanations in differen ces, and measure only discrimination that canno t be ex plained by n on-prote c ted characteristics . T able I I I summarize s applicability of absolute measures in different machine learn- ing settings . 4.3. Condit ional measures Absolute measures take into acco unt only the target v ariable y and the protected vari- able s . Absolute measures co nsider all the differenc es in treatment be tween the pro- tected g roup and the reg ular grou p to be discriminatory . Conditional measure, on the other hand, try to capture ho w much of the differe nce betwee n the g roups is explain- able by othe r characteristics of individuals, recorded in X , and o nly the remainin g differen ces are deem e d to be discriminator y . F or example, part of the d ifference in acceptance rates for natives and immigrants may be ex plained by the diffe rence in education level. Only the re maining unexplained differe nce should be considered as discrimination. Let z = f ( X ) be an explanatory variable. F or ex ample, if z i denotes a certain ed ucation lev el. Then all the individu als with the same level of edu cation will form a strata i . Within each strata the acceptance rates are required to be equal. 4.3.1. Unexplained difference. Unex plained differ e nce [Kamiran et al. 2013b] is me a- sured, as the nam e sugge sts , as the ove rall mean differe nce minus the differ e nces that can be explaine d by other legitimate variable . Rec all that mean difference is d = p ( y + | s 0 ) − p ( y + | s 1 ) . Then the unex plained differe nce d u = d − d e , wher e d e = P m i =1 p ⋆ ( y + | z i )( p ( z i | s 0 ) − p ( z i | s 1 )) , where p ⋆ ( y + | z i ) is the desired acceptance rate within the strata i . The authors recom mend using p ⋆ ( y + | z i ) = p ( y + | s 0 ,z i )+ p ( y + | s 1 ,z i ) 2 . In the simplest c ase z bay be e qual o ne of the variables in X . The authors also use clus- tering on X to take into account more than one exp lanator y variable at the same time. Then z denotes a cluster , one strata is o ne cluster . 4.3.2. Propen sity mea sure. Prop ensity models [Ro senbaum and Rubin 1983] are typi- cally used in clinical trials o r marketing for estimating the probability that an indi- ACM Journal Name, Vol . 0, No. 0, Art icle 0, Publication date: Oct ober 2015. 0:14 I. ˇ Zlioba it ˙ e vidual would receiv e a treatment. Given the e stimated probabilities , individuals can be stratified according to similar probabilities of receiving a treatment, and the e ffects of treatment can be measured w ithin each strata separately . Propensity models have been used for measuring discrimination [Calders et al. 2013], in this case a fun ction was learned to mo d el the p rotected characteristic based on input variables X , that is s 1 = f ( X ) . A logistic regr e ssion was used for mod eling f ( . ) . Then the estimated propensity score s ˆ s 1 were split into five ranges, where each rang e fo rmed on e strata. Discrimination was measured within each strata, treating each strata as a separate dataset, and u sing absolute discrimination measures discussed in the p revious sec- tion. The authors did no t aggregate the resulting discrimination into one measure, but in principle the re sults can be aggreg ated into o ne measure, for instance, using the unexplained differen ce formulas, reporte d above. In such a case each strata w o uld correspond to one value of an explanatory variable z . 4.3.3. Bel ift rati o. Be lif t ratio [Mancuhan and Clifton 2014] is similar to E lif t r atio in absolute measures, but her e the probabilities of positive outcom e are also conditioned on input attributes, bel if t = p ( y + | s 1 ,X r ,X a ) p ( y + | X a ) , whe r e X = X r ∪ X 6 r is a set of input vari- ables , X r denotes so caller redlining attributes, the variables which are co rrelated with the prote cted variable s . The authors propo se d e stimating the probabilities via bayesian networks. A possible difficu lty f or applying this measure in practice may be that not eve r ybody , espe cially n o n-machine learning users, are familiar enoug h with the Bayesian ne tworks to an ex tent nee ded fo r e stimating the pro babilities . Mor e- over , construction of a Bayesian networ k may be diffe r ent even f or the same pro blem depend ing on assumptions m ade about inte r actio n s between the variables. Thus , d if- ferent users may ge t differen t discrimination scores f or the same application case. A simplified approx imation of belift could be to treat all the attributes as r edlining attributes , and instead o f con ditioning o n all the inpu t variables, condition o n a sum- mary o f inp ut variables z , wh ere z = f ( X ) . Then the measure for strata i wo uld be p ( y + | s 1 ,z i ) p ( y + ) . The me asure has a limitation that ne ither the original version, nor the simplified version allow differen c es to be explaine d by variables that are co rrelated w ith the protected variable. That is, if a university has two progr ammes, say me d icine and computer scienc e, and the protected g roup, e.g . females, are more likely to apply for a more competitive p rogramme, then the progr ammes cann ot have differe nt accep tance rates . That is , if the accep tance rates are diffe rent, all the differen ce is considered to discriminatory . 4.4. Structu ral measures Structural measures are targe ted at quantifying direct discrimination. The main ide a behind structural measures is f o r each ind ividual in the dataset to identify whe ther s/he is discriminated, and the n analyze ho w many individu als in the dataset are af - fected. C u rrently 4.4.1. Sit uation testing. Situation testing [Luo ng et al. 2011] measures wh ich frac- tion of in d ividuals in the pr o tected g r oup are considered discriminated , as f = P y i ∈ D ( y 0 | s 1 ) I ( diff ( y i ) ≥ t ) | D ( y 0 | s 1 ) | , where t is a user define d thresho ld , I is the indicator fun ction that takes 1 if true, 0 otherwise. The situation testing fo r an individual i is computed as diff ( y i ) = P y j ∈ D 0 κ − ne arest − neighbours κ − P y j ∈ D 1 κ − ne arest − neighbours κ . Positive and negative discrimi- nation is handled separately . ACM Journal Name, Vol . 0, No. 0, Art icle 0, Pu blication date: October 2015. Discrimina tion measures 0:15 The idea is to co mpare e ach individ ual to the op posite gro up and see if the decision would be diff erent. I n that sense, the measure relates to prop ensity scoring (Section 4.3), used for identifying gro ups o f people similar according to the no n-protec ted char - acteristics , and requiring f or decisions within those grou ps to be balanced. The main differen ce is that pro pensity measures would signal indirect discrimination within a group, and situation testing aims at signalling direct discrimination for each individ- ual in question. 4.4.2. Consisten cy. Con sistency measure [Ze mel et al. 2013 ] comp are s the pre - dictions for each individual with his/her nearest neighbo rs . C = 1 − 1 κN P N i =1 P y j ∈ D κ − ne arest − neighbours | y i − y j | . Co nsistency measure is closely related to sit- uation testing, but considers nearest ne ighbors fro m any group (not fro m the oppo- site group ). Due to this choice, consistency measure should be used with caution in situations where there is a high c orrelation betwe e n the protected variable and the legitimate input variables. F or example, suppose we have only one p r edictor v ariable - location of an apartment, and the target variable is to grant a loan o r no t. Suppose all n on-white peop le live in one neighborho od (as in the re d lining e xample), and all the wh ite peo ple in the o ther ne ighborhoo d. Unless the n umber o f ne arest ne ighbors to consider is v ery large, this measure will show no d iscrimination, since all the neigh- bors w ill ge t the same decision, e ven though all black residents will be rejected , and all white will be accep ted (maximum discrimination). P erf ect consistency , but maximum discrimination. In their experimental evaluation the authors have used this me asure in co mbination with the mean differen c e measure. 5. ANAL YSIS OF CORE MEASURES Even though absolute me asures are naive in a sense that they do not take any po ssi- ble explanations of differe nt tre atment into acco unt, and du e to that may show more discrimination that there actually is , these measure s pro vide core mechanisms and a basis for me asuring indirect discrimination. Conditional measures are typically built upon absolute measures. In addition , statist ical tests o ften directly relate to absolute measures. Thus , to pro vide a better u nderstanding o f pr operties and implications of choosing on e measure over another , in this section we compu tationally analyze a set of absolute measures, and discuss their prope r tie s. W e analyze the following measures, introduced in Section 4.2: mean dif ference, normalized differe nce, mutual info r mation, impact ratio, elift and o dds ratio. From the measures analyzed in this section, mean diffe rence and area unde r curve can be d irectly used in regression task s . W e focus o n the classification scenario, since this scenario has been studied more e xtensively in the discrimination-aw are data mining and machine learn ing literature, and there are mor e me asures available for classi fication than f o r regression; the regre ssion s etting, except for a recent work [Calders et al. 2013 ], remains a subject of futur e re search, and theref ore is out of the scope of a survey paper . T able IV summarizes boundary condition s of the selecte d measure s . In the differe n ce based measures 0 indicates no discrimination, in the ratio based me asures 1 in dicates no discrimination, in AUC 0 . 5 means no discrimination. The boun dary conditions are reached wh en one group gets all the positive decisions, and the other group gets all the negative decisions. Next w e experime ntally analyze the perfo rmance of the selecte d measures. W e leave out AUC from the experimen ts , since in classification it is equivalent to the mean dif- ference measure. The g o al of the experiments is to demonstrate how the perf ormance depend s on v ariations in the o verall rate of positive de c ision s, balance betwee n classes and balance between the regular and p r otected groups of people in data. ACM Journal Name, Vol . 0, No. 0, Art icle 0, Publication date: Oct ober 2015. 0:16 I. ˇ Zlioba it ˙ e T able I V . Li mits Measure Maximum No Reverse discrimination discrimination discrimination Differences Mean difference 1 0 − 1 Normalized difference 1 0 − 1 Mutual information 1 0 1 Ratios Impact ratio 0 1 + ∞ Elift 0 1 + ∞ Odds ratio 0 1 + ∞ AU C Area under curve (AUC) 1 0 . 5 0 F or this analysis we use synthe tically generated data which allows to re present dif - ferent task settings and con trol the levels of underlying discrimination. Given fou r parameters: the proportion of indiv id uals in the prote cted gr o up p ( s 1 ) , the propor tion of positive outputs p ( y + ) , the underlyin g discrimination d ∈ [ − 100 % , 100 %] , and the number of data points n , data is g enerated as follows. First n data po ints are gener- ated assigning a score in [0 , 1] u niformly at random , and assigning gro up membership at random according to the probability p ( s 1 ) . This d ata contains no discrimination, because the scores are assigned at random. If would contain full discrimination if we ranked the observations according to the assigned scores and all the members of the regular group would appear before all the mem be rs o f the protected group. F ollowing this reasoning, half-discrimination wo uld be if in a half of the data the members of the regular group appe ar be f ore all the me mbers of the pro te cted group in the ranking, and the other half of the data w ould show a rand om mix of both gro ups in the ranking. F or the exp erimental analysis purp oses we de fine this as 50% discrimination. It is difficult to m easure discrimination in data this way , but it is easy to generate such a data. F or a given level of desired discrimination d w e select dn o bservations at random, sort them according to their scor es, and then permu te g roup assignmen ts w ithin this subsample in such a wa y that the highest scores g et assigned to the reg u lar gr oup, and the lowest scores get assigned to the p rotected group. Finally , since the e xperimen t is about clas- sification, we ro und the score s to zero-o ne in such a way that the proportion of o nes is as desired by p ( y + ) . The n we apply diff erent measures of discrimination to data ge n- erated this way , and investigate, how these m e asures can reconstruct the und erlying discrimination. F or each parame te r setting we g enerate n = 10000 data points, an d average the re sults over 100 such ru ns 1 Figure 2 d epicts the perform ance of mean differe n ce, normalized dif f erence and mu - tual information. Ideally , the perfo rmance should be invariant to balance o f the groups ( p ( s 1 0) ) and the pro portion of po sitive o utputs ( p ( y + ) ), and thus run along the diago nal line in as many p lo ts , as possible. W e c an see that the normalized difference capture s that. The mean dif f erence cap tures the trends, but the indicated discrimination highly depend s on the balance of the classes and balance of the group s, therefore, this mea- sure to be interpreted with care when data is hig hly imbalanced. The same holds fo r mutual in f ormation. F or instance, at p ( s 1 ) = 90% and p ( y + ) = 90% the tru e discrimina- tion in data may be ne ar 100% , i.e. nearly the worst p o ssible, but both measures would indicate that discrimination is nearly zero. The normalized differen ce would capture the situation as de sired. In add ition to that, w e see that the mean differen ce and nor- malized d ifferenc e are linear measures, while mutual information is no n-linear , and would show less d iscrimination that actually in the medium range s. Moreove r , mutual 1 The code for our experiments is made available at https://github.com/zliobaite/p aper - fairml- su rvey . ACM Journal Name, Vol . 0, No. 0, Art icle 0, Pu blication date: October 2015. Discrimina tion measures 0:17 mean difference normalized difference mutual information − 1 0 1 − 1 0 1 measured discrim. p ( y + ) = 10 % − 1 0 1 − 1 0 1 30% − 1 0 1 − 1 0 1 50% − 1 0 1 − 1 0 1 70% − 1 0 1 − 1 0 1 p ( s 1 ) = 10 % 90% − 1 0 1 − 1 0 1 measured discrim. − 1 0 1 − 1 0 1 − 1 0 1 − 1 0 1 − 1 0 1 − 1 0 1 − 1 0 1 − 1 0 1 30% − 1 0 1 − 1 0 1 measured discrim. − 1 0 1 − 1 0 1 − 1 0 1 − 1 0 1 − 1 0 1 − 1 0 1 − 1 0 1 − 1 0 1 50% − 1 0 1 − 1 0 1 measured discrim. − 1 0 1 − 1 0 1 − 1 0 1 − 1 0 1 − 1 0 1 − 1 0 1 − 1 0 1 − 1 0 1 70% − 1 0 1 − 1 0 1 discrim. in data measured discrim. − 1 0 1 − 1 0 1 discrim. in data − 1 0 1 − 1 0 1 discrim. in data − 1 0 1 − 1 0 1 discrim. in data − 1 0 1 − 1 0 1 90% discrim. in data Fig. 2 . An alysis of the measures based on differences: discrimination in data vs. measu red discrimination. information dos n ot indicate the sign of discrimination, that is, the o utcome does not indicate whe ther discrimination is reve rsed or n ot. F or these reasons, we do not recom- mend using mutual inform ation for the pu rpose of quantify ing discrimination. There- fore, fro m the diffe r ence based measures we adv ocate normalized differe nce, which was designe d to be ro bust to imbalance s in d ata. The normalized d ifferenc e is some- what mor e comple x to comp ute than the mean dif f erence, which m ay be a limitation for p ractical applications o utside research. The refore, if data is closed to balanced in terms o f groups and positive-neg ative outputs, then the mean diffe rence can be used. Figure 3 presents similar analysis o f the me asures based on ratios: impact ratio, elift and odds ratio. W e can see that the od ds ratio, and the imp act ratio are very sen- sitive to im balance s in gr oups and p ositive outputs. The elift is more stable in that respect, but still has some variations, particularly at hig h imbalance of positive out- puts ( p ( y + ) = 90% or 10 % ), w hen discrimination may be high ly exaggerated ( f ar f rom ACM Journal Name, Vol . 0, No. 0, Art icle 0, Publication date: Oct ober 2015. 0:18 I. ˇ Zlioba it ˙ e impact ratio elift od ds ratio − 1 0 1 0 1 2 3 measured discrim. p ( y + ) = 10 % − 1 0 1 0 1 2 3 30% − 1 0 1 0 1 2 3 50% − 1 0 1 0 1 2 3 70% − 1 0 1 0 1 2 3 p ( s 1 ) = 10 % 90% − 1 0 1 0 1 2 3 measured discrim. − 1 0 1 0 1 2 3 − 1 0 1 0 1 2 3 − 1 0 1 0 1 2 3 − 1 0 1 0 1 2 3 30% − 1 0 1 0 1 2 3 measured discrim. − 1 0 1 0 1 2 3 − 1 0 1 0 1 2 3 − 1 0 1 0 1 2 3 − 1 0 1 0 1 2 3 50% − 1 0 1 0 1 2 3 measured discrim. − 1 0 1 0 1 2 3 − 1 0 1 0 1 2 3 − 1 0 1 0 1 2 3 − 1 0 1 0 1 2 3 70% − 1 0 1 0 1 2 3 discrim. in data measured discrim. − 1 0 1 0 1 2 3 discrim. in data − 1 0 1 0 1 2 3 discrim. in data − 1 0 1 0 1 2 3 discrim. in data − 1 0 1 0 1 2 3 90% discrim. in data Fig. 3 . An alysis of the measures based on ratios: discrimination in data vs. measu red discrimination. the diago nal line). I n addition, measure d discrimination by all r atios grow s very fast at low rates of positive o u tcome (e.g. see the plot p ( y + ) = 10% and p ( s 1 ) = 90% ), while there is almost no discrimination in the data, measures ind icate high discrimination. W e also can see that all the ratios are asymm etric in terms of rev erse discrimination. One unit of measured discrimination is not the same as on e unit of rever se d iscrim- ination. This makes ratios a bit more difficult to interpr e t than diffe rences, analyzed earlier , e spe cially at large scale ex plorations and comparisons of, for instance, differ- ent computational methods for pr e vention. Due to these reasons, we do no t recommen d using ratio based discrimination measure s , since they are much more difficu lt to inter- pret correctly , and may easily be misleading. Instead recomm end using and building upon differe nce based measures, discussed in Figure 2. The core measures that we have analyzed form a basis for assessing fairness of predictive models, but it is not enough to use the m direc tly , since they do not take ACM Journal Name, Vol . 0, No. 0, Art icle 0, Pu blication date: October 2015. Discrimina tion measures 0:19 into account p ossible legitimate explanations o f differe nces betwe en the groups, and instead consider any d ifferenc e s betwee n the groups of p eople undesirable. The basic principle is to try to stratify the popu lation in such a way that in each stratum contains people that are similar in terms of their leg itimate characteristics , for instance, have similar qualifications if the task is candid ate selection fo r job interview s . propen sity score matching, reported in Section 4.3, is one possible way to stratification, but it is not the o nly one, and outcomes may vary d epending on internal parameter choice s. Thus , the principle to measuring is available, but the re are still o pen challeng e s ahe ad to make the approach more ro bust to differe nt users, and mo r e unif o rm across d if ferent task setting , such that one c o uld diagnose potential discrimination o r declare f airness with mo re confiden c e. 6. RECOMMENDA TIONS FOR RESEARCH ERS AND PRA CTITIONERS As attention o f re searchers, media and general public to p o tential discrimination is growing, it is important to be able to measure fairness of predictive models in a sys- tematic and accountable way . W e have surveye d measures used (and potentially us- able) for me asuring indirect discrimination in machine learning, and experime ntally analyzed the perf ormance of the core me asures in classification tasks . Based on ou r analysis we generally recomm e nd using the normalized diffe rence, and in case the classes an d gro ups of peo ple in the data are w ell balance d, it may be sufficient to use the simple (unno r malized) mean d ifferenc e. W e do not reco mmend using ratio based measures challenges associated with their interp retation in different situation. The core me asures stand alone are no t enoug h for measuring f airness corr ectly . These measures c an only be applied to uniform po pulations considering that every- body w ithin the p opulation is e qually qu alifie d to g et a po sitive d ecision. In reality this is rare ly the case, fo r example, diff erent salary leve ls may be exp lained by differe n t education lev els . The refore, the main principle of ap plying the co re m e asures sho uld be by first segmen ting the population into more o r le ss un iform segm ents acco rding to their qualifications, and then apply ing core measures w ithin each segment. Some of such measuring techniques have been surve yed in Section 4.3 (Conditional measures), but gene rally there is no one easy way to ap p roach it, an d presen ting sound arg uments to j ustify the methods of allocating peo ple into segments is ve ry important in research and practice. W e h ope that this survey can establis h a basis for f urther research develo p ments in this important topic. So far m ost of the research h as con centrated on binary classi- fication with binary protected characteristic. While this is a base scen ario, relatively easy to deal w ith in research, m any technical challenges for future research lie in ad - dressing more co mplex learning scenario s with diffe rent types and multiple protected characteristics , in multi-class , multi-target classificati on and regression settings , with differen t type s of legitimate variables , noisy input data, po tentially missing pro tected characteristics , and many m ore. REFERENCES Kenneth . J . Arrow. 1973 . The Th eory of Discrimination. In Discrimination in Labor Market s , O. Ashenfelter and A. Rees (Eds.). Princeton University Press , 3–33. Solon Barocas, Sorelle Friedler , Moritz Hardt, Josh Kroll, S u resh V enkatasu bramanian, and Hanna W allach (Eds. ). 2015. 2nd International Wor kshop on F airness , Accountability , and T ransparency in Machine Learning (FA TML) . h ttp://www .fatml.org Solon Barocas and Moritz Hardt (Eds.). 2014. International W orkshop on F airness , Accountability , and T ransparency in M achine Learning (FA TML) . http://www .fatml.org/2014 Solon Barocas an d Andrew D. Selbst. 2016. Big Data’s Disparate Impact. California Law Review 104 (2016). ACM Journal Name, Vol . 0, No. 0, Art icle 0, Publication date: Oct ober 2015. 0:20 I. ˇ Zlioba it ˙ e Christopher M. Bi s hop. 2006. P attern Recognition and Machine Learning (Information Science and Statis- tics) . Springer -V erlag New Y ork, Inc. Rebecca M. Blan k, Marilyn D a b a dy , Constance F orbes Citro, an d National Research Coun cil (U .S.) Panel on M ethods for Assessin g Discrimination. 2004. Measuring racial d iscriminatio n . National Academies Press . Jo hn Burn-M urdoch. 2013. The problem with algorithms: magnifying misbehaviour . T h e Guardian (2013). http://www .theguardian.com/news/datablog/2013/aug/14/problem- with- algorithms- magn ifying- misbehaviour T oon Ca l ders, Asim K arim, F aisal Kamiran, W asif Ali, an d Xian gliang Z hang. 2013. Controlling Attribu t e Effect in Linear Regression. In Proc . of the 13th In t. Con f . on Data Mining (ICDM) . 71–80. T oon Ca l ders and Sicco V erwer. 2010. Three Naive Bayes Approaches for Discrimination-free Cla s sification. Data Min. Knowl. Discov . 21, 2 (2010), 277–292. T oon Calders and Indre Zliobaite (Eds.). 2012. IEEE ICD M 201 2 In ternational Wor kshop on D iscriminatio n and Privac y-Aware D ata Minin g (DP AD M) . https://sites.google .com/site/dpadm2012/ T oon Ca l ders and Indre Z l i obait e. 2 013. Why Unbias ed Computational Processes Can Lead to Discrimina- tive Decision Procedures . In Discrimination and Privacy in the Information Society - Data Mining and Profiling in Large Databases . 43–57. Danielle K. Citron an d Frank A. Pasqualle III. 2014. The Scored Society: Due Process for Automated Pre- dictions. W ashington Law Review 89 (2014). European Commiss i on . 2011. How to present a discrimination claim: Handb ook on seeking remedies u nder the EU Non-discrimination Directive s . EU Publications O ffice. Bart Custers, T oon Calders, Bart Schermer, and T al Z arsky (Eds .). 2013. Discrimination and Privacy in the Informati on Society . Springer . Benjamin G. Edelman an d Michael Luca. 2014. Digital Discrimination: The C ase of Airbnb .com . W orking P aper 14-054. Harvard Business School NOM Unit. Michael F eldman, Sorelle A. Friedler, John Moeller, Carlos Scheidegger, and Suresh V enkatasubramanian. 2015. Certifying and Removing D isparate Impact. In Proc . of the 21th ACM SIGKDD Int. Conf . on Knowledge Discove ry and Data Minin g . 259–268. European Union Agency for Fundamen t al Rig hts. 2011. EU Publications Office. Kazuto Fukuchi, Jun Sakuma, and T oshihiro K amishima. 2013. Prediction with Model-Based Neutrality . In Proc . of E u ropean conference on Machine Learning and Knowledge Discovery in Databases . 499–514. Isabelle Guyon and Andr ´ e Elis seeff. 2 0 0 3 . An Introduction to V ariable and F eature Selection. Journal of Machine Learning Research 3 (2003), 115 7 – 1 1 8 2 . Sara Hajian and Josep Domingo-F errer. 2013. A Methodology for D i rect a n d Indirect Discrimination Pre- vention in Data Mining. IEEE T rans . Knowl. Data Eng. 25, 7 (2013), 144 5 – 1 4 5 9 . The White House. 201 4. B ig Data: Seizing Opportunities , Preserving V alues . Executive Offi ce of the Presi- dent. F aisal K amiran and T oon Calders. 2009. Clas s ification without Discrimination. In Proc . nd IC4 conf . on Computer , Control and Communication . 1–6. F aisal Kamiran, T oon Calders, and Mykola Pechenizkiy . 2010. Dis crimination Aware Decision Tree Learn- ing. In Proc . of the 2010 IEEE International Conference on Data Min in g (ICD M) . 869–874. F aisal Kamiran, Indre Z liobaite, and T oon Calders. 2013a. Quantifyi n g explainable discrimination and re- moving illegal discrimination in automated decision making. Knowl. Inf . Syst. 35, 3 (2013), 613 –644. F aisal Kamiran, Indre Zliobaite, and T oon Calders. 2013b. Qu antifying explainable discrimination and re- moving illegal discrimination in automated decision making. Knowl. Inf . Syst. 35, 3 (2013), 613 –644. T oshihiro Kamishima, Shotaro Akaho, Hideki Asoh, and Jun Sakuma. 2012. F airness-Awar e Class ifier with Prejudice Remover Regularizer . In Proc . of European Conference on Machine Learning and Knowledge Discover y in Databases (ECMLPKDD) . 35–50. Binh Thanh Luong, Salv atore Ruggieri, an d Franco Turini. 2011. k-NN As an Implementation of Situ ation T esting for Discrimination Discovery and Prevention. In Proc . of the 17th ACM SIGKDD Int. Conf . on Knowledge Discove ry and Data Minin g (KDD) . 502–5 1 0 . Koray Mancuhan and Chris Clifton. 2 0 14. Combating D iscrimination Using B ayesian Networks. Artif . Intell. Law 22, 2 (2014), 211–238. Sergio Mascetti, An narita Ricci, an d Salva t ore Rug gieri (Eds.). 2014. Special issue: Computational Methods for Enforcing Privacy and F airness in the Knowledge Society . V ol. 22. Artificial Intelligence and Law . Issue 2. Claire Cain Miller. 2015. When Algorithms Discriminate. New Y ork T imes (2015). http://www .nytimes.c om/2015/07/10/upshot/when- algorithms- discriminate.html ACM Journal Name, Vol . 0, No. 0, Art icle 0, Pu blication date: October 2015. Discrimina tion measures 0:21 Dino Pedresc hi, Salvatore Rug gieri, and Franco Turini. 2008. Discrimination-aware data mining. In Proc . of the 14th ACM SIGKDD Int. Conf . on Knowledge Discovery and Data Mining (KDD) . 560–568. Dino Pedre schi, Salvatore Rugg ieri, and F ranco Turini. 2009. Measuring Discrimination in Soc ially- Sensitive Decision Records . In Proc . of the SIAM Int. Conf . on Data Mining (SDM ) . 581 – 5 9 2 . Dino Pedresc hi, Salv atore Ruggi eri, and Franco Turini. 2012. A Study of T op-k Measures for Discrimination Discovery . In Proc . of the 27th Annu al ACM Symposium on Applied Computing (SAC) . 126–131. Andrea Romei an d Salv atore Ru ggieri. 2014. A mu ltidisciplinary s urvey on dis crimination ana l y sis. Kn owl- edge Eng. Review 29, 5 (2014), 582– 6 3 8 . Andrea Romei, Salvatore Rugg ieri, and Franco Turini. 2012. Di scovering Gender Discrimination in Project Funding. In Proc . of the 201 2 IEEE 12th Int. Conf . on Data M ining W orkshops (ICDMW) . 394–401. P aul R. Rosenbaum and Donald B. Rubin. 1983. The central role of the propensity score in observation al studies for causal effects. Biometr ika 1 (1983), 41–55. Issue 70. Salvatore Ru ggieri, Dino P edreschi, an d Franco Turini. 2010. Data Mining for Discrimination Discovery . ACM T rans . Kn ow l. Discov . Data 4, 2, Article 9 (May 2010), 40 pages. David T ax. 2001. One-class classificatio n . Ph.D. D issertation. Delft University of T echnology . Grigorios Tsoumakas and Ioannis Katakis. 2 0 0 7. M ulti-label classification : an overview . International Jour - nal of Data W arehousing & Mining 3, 3 (2007), 1–13. Jo hn Wihbey. 2015. The possibilities of digital discrimination: Research on e-commerce, algorithms and big data. Journalist ’s resource (2015). http://journalistsresource. org/ Jo hn Ying er. 1986. Measuring Racial Discrimination with F air Housing Au dits: Cau ght in the Act. The American Economic Review 76, 5 (1986), 881–893. Richard S . Z emel, Y u W u, Kevin Swersky , T onian n Pitassi, and Cynthia Dwork. 2013. Learning F air Repre- sentations. In Proc . of the 3 0 th In t. Conf . on Machine Learning . 325–333. Indre Zli obait e. 2015. O n the relation between accuracy and fairness in binary classifi cation. In The 2nd workshop on F airness , Accountability , and T ransparency in Machine Learning (F AT ML) at ICML ’15 . ACM Journal Name, Vol . 0, No. 0, Art icle 0, Publication date: Oct ober 2015.
Original Paper
Loading high-quality paper...
Comments & Academic Discussion
Loading comments...
Leave a Comment