A Study of the Spatio-Temporal Correlations in Mobile Calls Networks
For the last few years, the amount of data has significantly increased in the companies. It is the reason why data analysis methods have to evolve to meet new demands. In this article, we introduce a practical analysis of a large database from a tele…
Authors: Romain Guigour`es (SAMM), Marc Boulle, Fabrice Rossi (SAMM)
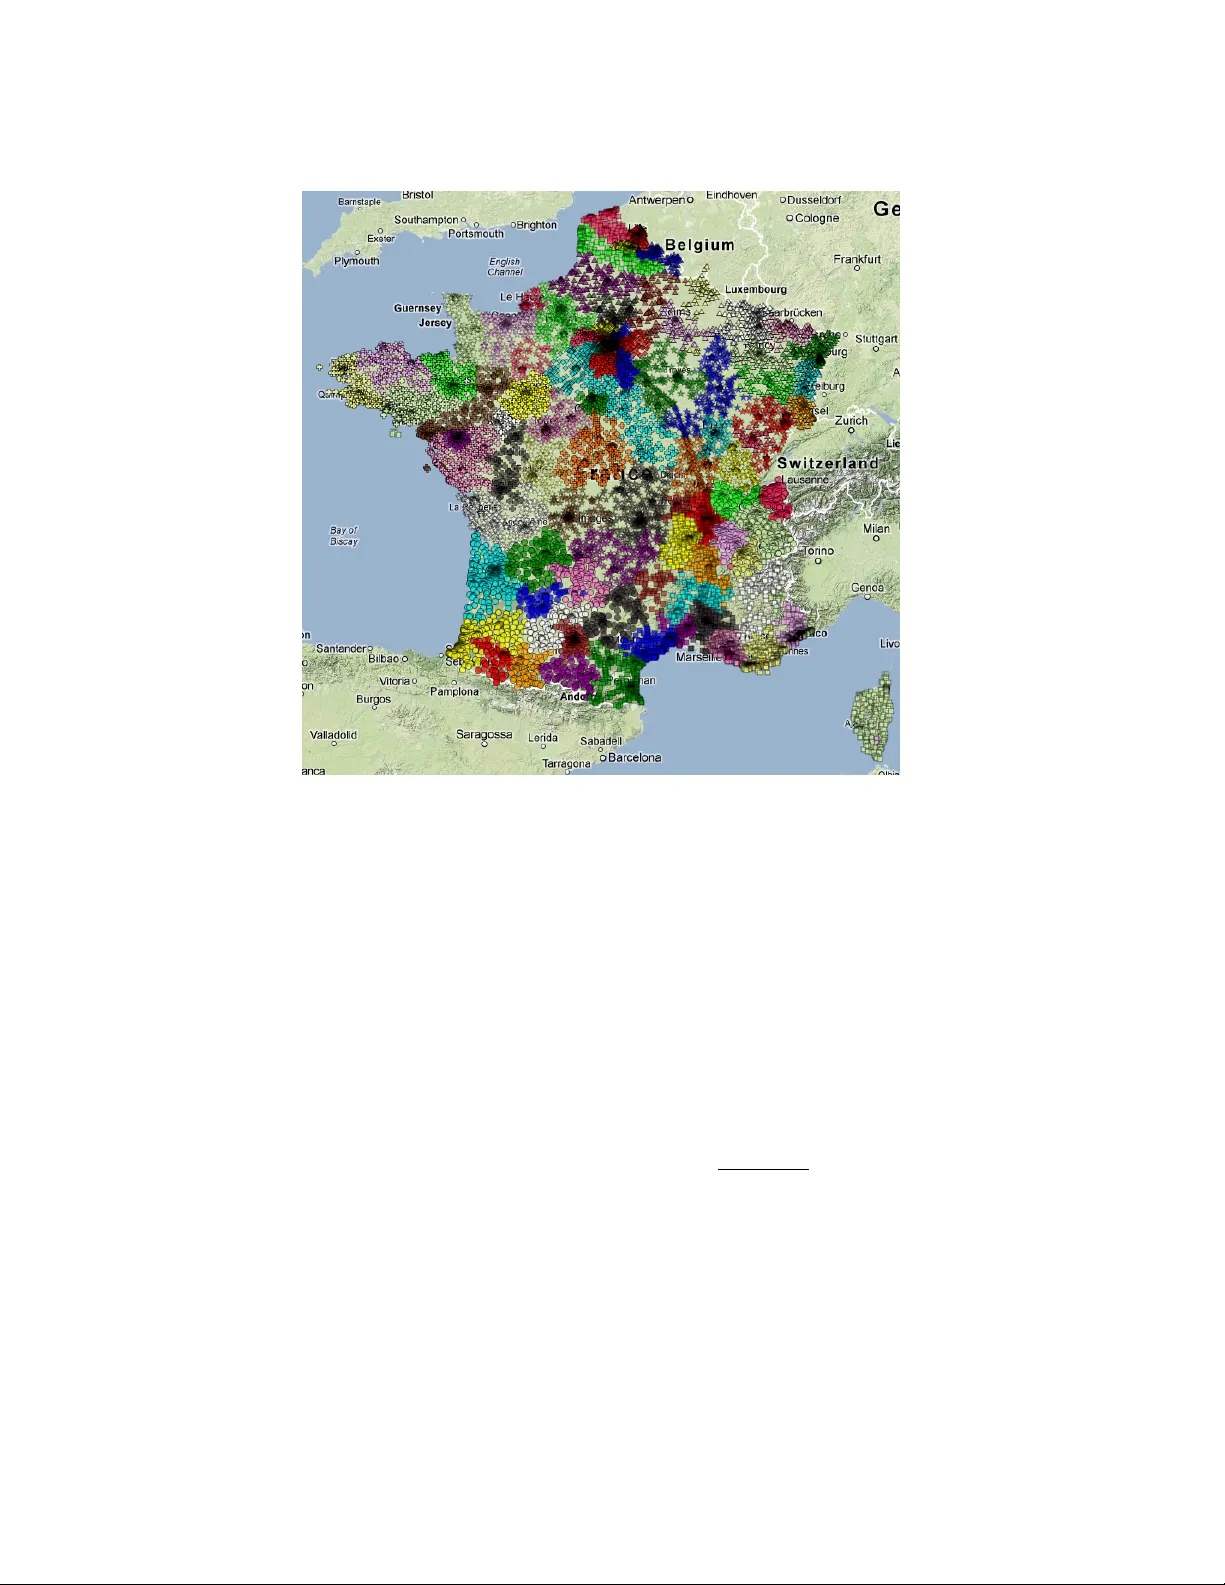
A Study of the Spatio-T emporal Corr elations in Mobile Calls Networks Romain Guigour ` es, Marc Boull ´ e and Fabrice Rossi Abstract For the last fe w years, the amount of data has significantly increased in the companies. It is the reason wh y data analysis methods ha ve to ev olv e to meet ne w demands. In this article, we introduce a practical analysis of a large database from a telecommunication operator . The problem is to se gment a territory and characterize the retrie ved areas o wing to their inhabitant behavior in terms of mobile telephony . W e hav e call detail records collected during fi v e months in France. W e propose a two stages analysis. The first one aims at grouping source antennas which originating calls are similarly distributed on target antennas and con v ersely for target antenna w .r .t. source antenna. A geographic projection of the data is used to display the results on a map of France. The second stage discretizes the time into periods between which we note changes in distributions of calls emer ging from the clusters of source antennas. This enables an analysis of temporal changes of inhabitants behavior in e v ery area of the country . Guigour ` es, Boull ´ e Orange Labs 2 av . Pierre Marzin 22300 Lannion - France e-mail: romain.guigoures@orange.com, marc.boulle@orange.com Guigour ` es, Rossi SAMM EA 4543 - Univ ersit ´ e Paris 1 90 rue de T olbiac 75013 Paris - France e-mail: romain.guigoures@malix.univ- paris1.fr, fabrice.rossi@ univ- paris1.fr 1 2 Romain Guigour ` es, Marc Boull ´ e and Fabrice Rossi 1 Introduction The telecommunication operators interest in in vestigating the behavior of the cus- tomers using the call detail records has continuously grown in recent years. Se v eral studies has been performed, some of them focusing on clustering antennas using the call flows [Blondel et al., 2010], [Guigour ` es and Boull ´ e, 2011]. They high- light a strong correlation between the retrie v ed clusters and the co vered territories characteristics like the spoken languages, the metropolitan areas in country-wide studies ; or the socio-economic profile of the neighborhoods (e.g. student, upper- or working-class) in local focuses. Such analysis are interesting for the telecommu- nication operators, particularly in dev eloping countries where the needs in access to telecom services are becoming increasingly important while their usage are still unknown. T o go ev en further in the study of call detail records, clustering antennas from which the traffic similarly occurs o ver a studied time period could be in vestig ated. A temporal analysis of the calls giv es the means for understanding where excesses and lacks of traffic are located over the territory in function of the time period. Such a study provides information as well on the structure of the day , the week, the month or the year , as on the areas where the temporal phenomena are observ ed. One major issue in the analysis of call detail records is the lar ge amount of data. The data set we in v estigate in this article is a daily record of inter-antennas calls made in France from May 13, 2007 to October 13, 2007. The number of antennas throughout the French territory is 17 , 895 between which 1 . 12 billions calls hav e transited. The calls originating from (resp. terminating) outside the french mobile network are not included in the data. In Section 2, we introduce methods dealing with this kind of analysis and justify the choice of them for our problem. Then in Section 3, results on the spatial correlations are in vestig ated while in Section 4 the temporal correlations are explored. Finally , the last section provides an assessment of the analysis results. 2 Antenna Clustering based on Mobile Calls The first concern is the data representation. Indeed, a call is described by the source antenna, the destination antenna and the day it has been made. In a previous w ork [Blondel et al., 2010], an undirected graph is used to model a netw ork of antennas linked by edges weighted by the calls frequency . In this paper, we choose to keep the matrix representation to exploit the natural direction of the calls. A Study of the Spatio-T emporal Correlations in Mobile Calls Networks 3 2.1 Related W orks In [Blondel et al., 2010], the authors build a partition of the graph by modularity maximization. This criterion [Newman, 2006] measures the quality of the segmenta- tion of the graph into cliques (or community in the graph-theory terminology) that are groups of strongly connected v ertices. The clusters of antennas obtained using this technique can be ef ficiently retrieved by emplo ying algorithms that exploit the sparsity of the network [Blondel et al., 2008] and thus modularity maximization is suitable for problems with a large amount of data, like clustering antennas. Numerous other graph clustering approaches ha ve been proposed, see for instance [Schaef fer , 2007, Fortunato, 2010] for surve ys. Howe ver , most of those approaches are based on some modularity or clustering assumptions: in terms of our context, those as- sumptions mean that the calls between antennas mostly occur within the groups of antennas. If it is the case, using e.g. modularity maximization or other fast graph clustering technique is very effecti ve. If this is not the case, some patterns might be missed and the actual structure of the graph not retriev ed. In our problem, we hav e no a priori knowledge that would justify a restriction to modular patterns. In fact we ha ve ev en reasons to belie ve that non symmetric and non modular patterns might be present in the data: for instance, some antennas might be associated to specific locations (uni versities, popular touristic destinations) that lead to a significant amount of calls outside the area, while other antennas might exhibit more localized call destinations. W e thus must find an alternativ e approach that enables the discovery of any kinds of patterns. The concept of blockmodeling originates in the pioneering works on quantitati ve graph structure analysis conducted by sociologists in the 1950s in the context of social network analysis [Nadel, 1957]. T o track the underlying structure of the netw ork, a matrix representation of a graph is usually exploited, generally its adjacenc y matrix. Rows and columns represent the source and destination antennas, and the values of the matrix indicate the number of calls made between the antennas. Early sociological approaches suggested to rearrange the rows and the columns in order to partition the matrix in homogeneous blocks, a technique called bloc kmodeling . Once the blocks are e xtracted, a partition of the antennas of both source and destination subsets can be deduced. This type of simultaneous grouping is named co-clustering . Notice that the only way to produce non symmetric patterns (between source and target antennas) is to allow for two different clusterings (one for the source antennas and one for the destination antennas), thus leading to a co-clustering. Using this technique, we are able to track more sophisticated patterns than approaches based on a single clustering whose quality is judged by a density based measure such as the modularity . In fact such approaches can be considered as looking for a diagonal blockmodel in which off diagonal terms should be zeros. Numerous methods hav e been proposed to extract satisfactory clusters of ver - tices. Some of them [Doreian et al., 2004] are based on the optimization of criteria that fa vor partitions with homogeneous blocks, especially with pure zero-blocks as recommended in [White et al., 1976]. More recent deterministic approaches have focused on optimizing criteria that quantify how well the co-clustering summarizes 4 Romain Guigour ` es, Marc Boull ´ e and Fabrice Rossi the input data [Reichardt and White, 2007] (see e.g. [W asserman and Faust, 1994] for details on such criteria). Other approaches include stochastic blockmodeling. In those generati ve models, a latent cluster indicator v ariable is associated to each verte x. Conditionally to the latent variables, the probability of observing an edge between tw o actors follows some standard distribution (a Bernoulli distrib ution in the simplest case) whose parameters only depend on the pair of clusters designated by the latent variables. In early approaches, the number of clusters is chosen by the user [Nowicki and Snijders, 2001]. More recent techniques automatically determine the number of clusters using a Dirichlet Process [Kemp and T enenbaum, 2006]. Finally , some recent approaches consider non-boolean latent v ariables: cluster assignments are not strong and a verte x has an af filiation degree to each cluster [Airoldi et al., 2008]. In addition to the di versity of structures that can be inferred from the network, co-clustering approaches are also able to deal with continuous variables [Nadif and Gov aert, 2010],[Boull ´ e, 2012]. Blocks are extracted from the data that yields a discretization of the continuous variables. For a further analysis, we are able to track temporal patterns: the source antennas are still the rows in the data matrix while the columns now model the time. In the case of an analysis of a call detail record, the technique we emplo y must hav e some properties: • Scalability : with nearly 18 , 000 antennas and 1 . 12 billion calls, we cannot afford to use methods with a too high algorithmic complexity , that is often an issue with co-clustering/blockmodeling techniques. • Genericity : the processed data are either nominal or continuous. This point is really important in our study because we focus on nominal attrib utes (the antennas label) and continuous (the time). • User -parametrization free : data are complex and their underlying structure is a priori unkno wn, giving parametrization of the co-clustering scheme (e.g number of clusters, etc.) might be an issue for the user with such a data set. • Reliability : the chosen approach must not yield spurious patterns, be resilient to noise and av oid overfitting. • Fineness and interpretability : the approach must exploit all the relev ant data information in order to extract fine patterns. In addition, exploratory analysis tools must allow users to w ork with the results effecti vely . Giv en the large amount of data, the majority of the co-clustering approaches is not applicable to the problem of antennas clustering. Sampling the data set might be possible. Ho wev er with 17 , 895 antennas and 1 . 12 billion calls, the av erage frequency of calls between two antennas is approximately 3 . 5 and sampling the data w ould lead to a significant loss of information. Among the co-clustering approaches, we decide to use the MODL approach [Boull ´ e, 2011] 1 . 1 Software a vailable on www.khiops.com A Study of the Spatio-T emporal Correlations in Mobile Calls Networks 5 2.2 Applying the MODL Approach Before detailing the chosen approach, the problem must be formalized. The data set under study consists of calls which are the statistical units. Each call is described by three v ariables: the source antenna of the call, an element of V S (see T able 1); the destination antenna of the calls, an element of V D ; and the time at which the call started a real number (the observ ed call times form the set V T ⊂ R ). Notice that while physical antennas are handling both incoming and outgoing calls, those two roles are separated in our model: V S and V D are completely distinct sets. This allows to build a directed model of the phone calls and therefore limits information loss. The T able 1 lists the data features and the modelization parameters we want to infer . The analysis we perform can be di vided into two steps. In the first one, we focus on the correlations between source and destination antennas while in the second, we concentrate on studying the time dimension of the calls. That is wh y , we introduce two distinct models: one is spatial M S and the other one is temporal M T . In both case, the MODL approach infers the parameters of the model M S (resp. M T ) from the data D . In a first step, the model is based only on the antenna variables (source and destination). The co-clustering approach is applied to the call detail record to extract clusters of source antennas (in rows of the data matrix) and destination antennas (in columns of the data matrix). The objective is to group source antennas for which the calls are similarly distributed ov er the destination antennas and con versely for target antenna w .r .t. source antenna. In a second step, the model is based again on two variables: the source antenna and the starting time of the call. As the time v ariable is continuous, the clustering has been constrained to respect the time ordering. This corresponds to a time quantization. The aim of the co-clustering in this case is to simultaneously group antennas and discretize the studied time period into segments during which the network is stationary . A higher order co-clustering (e.g. a tri-clustering approach like in [Guigour ` es et al., 2012]) could be applied in order to keep the three original variables. Ho wever , as will be become clear in Section 3, the source/destination coupling is very strong in this data set, up to a point where it hides the temporal patterns. By removing the destination variable, one can hope finding temporal structures. MODL optimizes a criterion to find the co-clustering structure. The detailed formulation of the criterion as well as the optimization algorithms and the asymptotic properties are detailed in [Boull ´ e, 2011] for a co-clustering with nominal variables and in [Boull ´ e, 2012] for a co-clustering with heterogeneous v ariables, i.e nominal and continuous. The criterion is formulated follo wing a MAP (Maximum a Posteriori) approach and is made up of a prior probability on the parameters of the co-clustering model and of the likelihood: • The prior : denoted P ( M S ) (resp. P ( M T ) ), it penalizes the model by specifying the a priori distrib ution of its parameters. It is hierarchically and uniformly b uilt in order to be the most weakly informativ e [Jaynes, 2003]. 6 Romain Guigour ` es, Marc Boull ´ e and Fabrice Rossi D : Data M S : spatial co-clustering model M T : temporal co-clustering model V S : source antennas V M S : partition of V S into clusters of source antennas V M S : partition of V S into clusters of source antennas V D : destination antennas V M D : partition of V D into clusters of destination antennas V T : time V M T : discretization of V T into time segments k S : number of clusters V M S k S : number of clusters of V M S k D : number of clusters of V M D k T : number of time segments of V M T k = k S k D : number of biclusters k = k S k T : number of biclusters n S : number of source antennas n M i . : number of source antennas in the i t h cluster from the parti- tion V M S n M i . : number of source antennas in the i t h cluster from the parti- tion V M S n C : number of destination anten- nas n M . j : number of destination an- tennas in the j t h cluster from the partition V M D m : total number of calls m i .. : number of calls originating from the source antenna v i m M i .. : number of calls originating from the i t h cluster from the par- tition V M S m M i .. : number of calls originating from the i t h cluster from the par- tition V M S m . j . : number of calls terminat- ing in the destination antenna v j m M . j . : number of calls terminat- ing in the j e cluster from the partition V M D m M .. t : number of calls made dur - ing the t t h time segments m i jt : number of calls made from the antenna v i to the antenna v j at time v t m M i j . : number of calls made from the i t h cluster of source antennas to the j t h cluster of destination antennas m M i . t : number of calls made from the i t h cluster of source antennas during the t t h time segment T able 1: Notations. • The likelihood : Once the model parameters are specified, the likelihood P ( D | M S ) (resp. P ( D | M T ) ) is defined as the probability to observe the data A Study of the Spatio-T emporal Correlations in Mobile Calls Networks 7 giv en the parameters. The product of the prior and the likelihood results in the posterior probability of the model. Its negati ve logarithm is the optimized criterion. Definition 1. The spatial model M S , summarized representation of the data D , is optimal if it minimizes the following criterion: c ( M S ) = − log [ P ( M S )] − log [ P ( D | M S )] = log n S + log n C + log B ( n S , k S ) + log B ( n C , k D ) + log m + k − 1 k − 1 + ∑ c i ∈ V M S log m M i .. + n M i . − 1 n M i . − 1 + ∑ c j ∈ V M D log m M . j . + n M . j − 1 n c . j − 1 (1) + log m ! − ∑ c i ∈ V M S c j ∈ V M D log m M i j . ! + ∑ c j ∈ V M D log m M . j . ! − ∑ v j ∈ V D log m . j . ! + ∑ c i ∈ V M S log m M i .. ! − ∑ v i ∈ V S log m i .. ! Definition 2. The temporal model M T , summarized representation of the data D , is optimal if it minimizes the following criterion: c ( M T ) = − log [ P ( M T )] − log [ P ( D | M T )] = log n S + log m + log B ( n S , k S ) + log m + k − 1 k − 1 + ∑ c i ∈ V M S log m M i .. + n M i . − 1 n M i . − 1 (2) + log m ! − ∑ c i ∈ V M S V M D ∈ V M T log m M i . t ! + ∑ V M D ∈ V M T log m M .. t ! + ∑ c i ∈ V M S log m M i .. ! − ∑ v i ∈ V S log m i .. ! B ( | V S | , K S ) is the number of possible partitions of V S into K S potentially empty subsets. The two first lines of the equation 1 and the equation 2 are the prior terms while the two last lines are the likelihood terms. In an information-theoretic point of view , a negativ e logarithm of a probability amounts to a Shannon-Fano coding length [Shannon, 1948]. Thus, the negati ve log of the prior probability − log ( P ( M )) is the description length of the model. As for the negati ve log lik elihood − log ( P ( D | M )) , it is the description length of the data when modeled by the co-clustering. Minimizing the sum of these two terms therefore has a natural interpretation in terms of a crude MDL (minimum description length) principle [Gr ¨ unwald, 2007]. The criterion c ( M ) 8 Romain Guigour ` es, Marc Boull ´ e and Fabrice Rossi provides an exact analytical formula for the posterior probability of a model M . That is why the design of sophisticated optimization algorithms is both necessary and meaningful. Such algorithms are described by [Boull ´ e, 2011]. The criterion is minimized using a greedy bottom-up merge heuristic. It starts from the finest model, i.e with one antenna per cluster and/or one timestamp per time segment. The merges of source and destination clusters or the merges of source clusters and time segments are e valuated and performed so that the criterion decreases. A post-optimization step improve this heuristic by making permutation between the clusters of antennas. This algorithm, that has a time complexity of O ( m √ m log m ) , is detailed in [Boull ´ e, 2011]. 3 Analysis of the Spatial Correlations First, we focus on the analysis of the calls between source and destination anten- nas. W e obtain 2 , 141 clusters of source antennas and 2 , 107 clusters of destination antennas. The av erage number of antennas per cluster is between 8 and 9 , which is very fine. The challenge lies in exploiting the results. The number of clusters is too important for a countrywide analysis of the antennas grouping but is suitable for local studies. W e thus propose analysis at different geographic scales. 3.1 A Countrywide Analysis First, we propose a countrywide analysis of the results and a projection on a map of France. The finest results do not provide a summarized enough view of the co- clustering structure for such an analysis. That is why , we process an agglomerati ve hierarchical clustering of the clusters to reduce their number . Clusters are merged so that the criterion is the least decreased in order to obtain the most probable co-clustering model for a given number of clusters. This post-treatment allows a simplification of the model while handling its quality loss. In order to quantify this loss, we introduce a quality measure we call informativity rate . Definition 3. The null model M / 0 S is the parametrization of the model, such that there is one single cluster of source and destination vertices or one single cluster of source and one time segment. The null model is the best representation of a data set with no underlying structure. Giv en the best model M ∗ S obtained by optimizing the criterion defined in Definitions 1 and 2, the informativity rate of a model M S is: τ ( M S ) = c ( M S ) − c ( M / 0 S ) c ( M ∗ S ) − c ( M / 0 S ) By definition, τ ( M S ) ≤ 1 ; note that τ ( M S ) < 0 is possible when M S is an irrelev ant modelization of the data D (e.g. M S 6 = M / 0 S when D are random data). A Study of the Spatio-T emporal Correlations in Mobile Calls Networks 9 Fig. 1: Informativity rate function of the number of clusters The informati vity rate allo ws the construction of a curv e of the informati vity of the model in function of the number of clusters. This aims at helping the user in finding a good trade off between a simple and an informati ve co-clustering. The Figure 1 shows that the first mer ges have a weak impact on the model informativity . Hence, the number of clusters of both source and destination antennas can be significantly reduce from more than 2 , 000 to 85 while keeping 75% of the model informati vity . This simplified model is used for the countrywide study: it is simple enough to be interpreted and informativ e enough to make a reliable analysis. Results are displayed in Figure 2. The correlation between the clusters of antennas and their locations is strong despite the antennas positions are not taken in account in the optimized criterion. W e can thus deduce that the people living in the same areas use to call the same destination and vice-versa. The map of the Figure 2 sho ws that the french territory can be segmented into sev eral geographic areas that do not necessarily correspond to the regional administrati ve boundaries. 3.2 A local analysis In a second step, we focus on a local analysis. T o that end, we exploit the finest model ( M ∗ S ) and only consider a subset of antennas corresponding to the area of a french city . The antennas in T oulouse are segmented into sev en clusters, displayed in Figure 3. The first cluster groups the antennas of the inner city (pale yellow circles), another cluster (neon green circles) groups antennas located in the west bank of the Garonne riv er, that corresponds to a lar gely residential area. The cluster of antennas pictured as pale pink circles takes place over the Univ ersity of T oulouse campus and a disadv antaged neighborhood. As for the cluster grouping antennas displayed using pale green circles, it covers an area with the same characteristics than the previous one. The orange circles are located in the residential periphery of the city with different socio-economic profiles: upper -class toward South and w orking-class 10 Romain Guigour ` es, Marc Boull ´ e and Fabrice Rossi Fig. 2: Projection of the clusters of source antennas on a map of France. There is one color and shape per cluster . tow ard North. Finally the red squares are antennas located in the industrial areas adjacent to the international airport. In order to understand why antennas ha ve been grouped together , we focus now on the distribution of calls originating from the clusters. T o that end, we study the contribution to the mutual information of each couple of source/destination stations. Definition 4. This measure quantifies the dependence of two variables, here the partitions of the source and destination antennas. Let us denote it M I ( V M S , V M D ) , defined as follows [Co ver and Thomas, 2006]: M I ( V M S , V S D ) = ∑ c S i ∈ V M S ∑ c D j ∈ V M D p ( c S i , c D j ) log p ( c S i , c D j ) p ( c S i ) p ( c D j ) (3) Mutual information is necessarily positiv e and its normalized version is com- monly used as a quality measure in the coclustering problems [Strehl and Ghosh, A Study of the Spatio-T emporal Correlations in Mobile Calls Networks 11 Fig. 3: Projection of the clusters of source antennas on a map of T oulouse, there is one shape and color per cluster . 2003]. Here, we only focus on the inv olvement to mutual information of a couple of source/destination clusters stations. This value can be positiv e or negati ve according to whether the observed joint probability of journeys p ( c S i , c D j ) is abov e or below the expected probability p ( c S i ) p ( c D j ) in case of independence. Displaying such a measure allows to quantify whether there is a lack or an e xcess of calls between two groups of antennas in comparison to the expected traf fic. This is illustrated in the Figure 4. W e focus on the traf fic of calls originating from the pale pink cluster of the Figure 3. Antennas that are pictures as red circles are the ones to which an excess of traf fic from the studied cluster is observed ( p ( V M S , V M D ) > p ( V M S ) p ( V M D ) ) while the antennas corresponding to the white circles are the ones to which the traffic is null or expected ( p ( V M S , V M D ) ≈ 0 or p ( V M S , V M D ) ≈ p ( V M S ) p ( V M D ) ). For this cluster of source antennas, there are no antennas to which we observe a significant lack of traffic. If an y , their location would hav e been identified by a blue circle on the map. Note that the colors in the map represent the contrib ution to the mutual information, not the frequency of calls which logarithm is proportional to the diameter of the circles. Hence, we observe that the excess of traf fic mainly occurs within the cluster we focus on, and slightly to the rest of the city . 12 Romain Guigour ` es, Marc Boull ´ e and Fabrice Rossi Fig. 4: Contribution to the Mutual Information between the cluster of the uni versity campus and the clusters of the plotted antennas. 4 Spatio-T emporal Analysis In this second study , we propose to process a co-clustering on the source antennas and the time. In this study , we could ha ve en visaged to apply a tri-clustering approach like in [Guigour ` es et al., 2012]. Ho we ver , the previous analysis showed us a strong correlation between the partitions of source and destination antennas. Hence, we consider that both source and destination antennas bring the same information and we consequently use only one of them. The data are call detail records with 17 , 895 source antennas and 1 . 12 billion calls made over fi ve month. The timestamps are the dates. The antennas grouping is different from the one we obtained in the Section 3. Here the antennas are grouped if the emerging calls are similarly distributed o ver the days. W e obtain 6 , 129 clusters of source antennas and 117 time segments. Contrary to the source/destination antennas analysis, there is no correlations between the clusters of antennas and their locations: they are scattered over the entire french territory . As a consequence, a projection of the clusters on a map of France would not be interpretable, e ven for a reduced number of clusters. In order to in vestigate the phenomena that lead to such a result, we also study the contribution to the mutual information between the clusters of antennas and the time segments. T o visualize this measure, we hav e simplified the co-clustering model in the same way as for the previous study and we ha ve plotted a calendar of the excesses and lacks of traffic in Figure 5. A Study of the Spatio-T emporal Correlations in Mobile Calls Networks 13 Fig. 5: Calendar of the excesses and lacks of calls from three clusters and 42 time segments. From May 13 to July 5 and from September 1 to October 13, the discretization is periodic, highlighting the working days and the week-ends. During the working days at both these periods, the calls originate in excess from the antennas of the middle cluster and in deficit from the bottom cluster . The contrast between the clusters is reducing as summer approaches. As for the weekends, the in verse phenomenon is observed, but not to the same degree. These phenomena can be explained by the agglomeration of the economic activity on concentrated geographical areas, usually urban. Note that there is always a lack of calls originating from the top cluster at this period. During the summer vacations, the periodicity working days/weekends is not observed an ymore. The calls originating from the middle cluster are no w in deficit while the ones made from the top cluster are significantly in excess compared to the usual traffic of the areas cov ered by the antennas and the traffic in the time segments. It is during this period that the contrast is the sharpest. That is the reason why , we focus on the segment from August 5 to August 15 and dra w a map where the antennas are displayed and colored in function of the excess or deficit of calls made during this segment (see Figure 6). During the summer vacations, there is a significant excess of calls made from the Atlantic and Mediterranean coasts. This means that during this period, the number of calls originating from these areas are more important than usually . These areas can truly be regarded as seasonal regions since the y are characterized by an unbalanced distribution of calls ov er the year . Actually the population of the areas covered by this cluster have also an unbalanced population over the year: during the summer v acations, the population can be multiplied by more than ten, this has a direct impact on the calls distribution. Con versely , the cities are colored in blue on the map of the Figure 6. This can be explained by the diminution of the economic activity due to the v acations. It 14 Romain Guigour ` es, Marc Boull ´ e and Fabrice Rossi Fig. 6: Contribution to the mutual information between the clusters of source antennas and the time segment from August 5 to August 15. In red, the antennas from which there is an excess of calls, in blue a deficit and in white the expected number of calls. is thus assumed that the populations mov e from the urban centers to the holidays resorts located on the seashore. W e note howe ver that the color only indicates the contribution to the mutual information, not the frequency: during this period, the antenna from which the most calls have been made is colored in blue and located in Paris. 5 Conclusion In this article, we ha ve proposed an analysis of a fiv e month call detail record between 17 , 895 mobile phone antennas spread throughout the French territory . That represents a total of 1 . 12 billion calls. After having listed similar studies and introduced methods suitable for such analysis, we hav e discussed on the choices that conducted us to use the MODL approach. T wo different types of analysis have been conducted while using one single approach, being generic and scalable enough to thoroughly in vestigate the data. A Study of the Spatio-T emporal Correlations in Mobile Calls Networks 15 In a first study , the antennas hav e been grouped together if the calls originating from (resp. terminating to) them are distributed on the same groups of antennas. An analysis of a projection of the clusters on a map reveals a strong correlation between the geographic position of the antennas and the clusters the y belong to, at the national or local le vels. In a second study , we hav e lead a study in which the time is taken into account. Despite, the antennas belonging to a same cluster are not located in a well- defined area anymore, the y cover ne vertheless areas with common features: urban, rural or touristic. As for the time segmentation, this highlights different beha viors in terms of mobile phone usage during the summer vacations and the w orking periods, during which we observe a periodicity between the working days and the weekends. For e xample in August, there is an excess of calls in the touristic areas while there is a deficit of calls in the urban areas, where most economic activity is concentrated. In future works, it might be interesting to lead a study in which several time features are embedded in order to characterize the beha vior in terms of mobile phone usage, in function of the date, the day of the week and the time of the day . References Airoldi et al., 2008. Airoldi, E., Blei, D. M., Fienberg, S. E., and Xing, E. P . (2008). Mixed Membership Stochastic Blockmodels. JMLR , 9:1981–2014. Blondel et al., 2008. Blondel, V . D., Guillaume, J.-L., Lambiotte, R., and Lefeb vre, E. (2008). Fast unfolding of communities in large networks. J. Stat. Mec h. , 2008(10):P10008+. Blondel et al., 2010. Blondel, V . D., Krings, G., and Thomas, I. (2010). Regions and borders of mobile telephony in belgium and in the brussels metropolitan zone. the e-journal for academic r esear ch on Brussels , 42:1–12. Boull ´ e, 2011. Boull ´ e, M. (2011). Data grid models for preparation and modeling in supervised learning. In Hands-On P attern Recognition: Challenges in Machine Learning, vol. 1 , pages 99–130. Microtome. Boull ´ e, 2011. Boull ´ e, M. (2011). Estimation de la densit ´ e d’arcs dans les graphes de grande taille : une alternativ e ` a la d ´ etection de clusters. In EGC , pages 353–364. Boull ´ e, 2012. Boull ´ e, M. (2012). Functional data clustering via piecewise constant nonparametric density estimation. P attern Recognition , 45(12):4389–4401. Cov er and Thomas, 2006. Cov er , T . M. and Thomas, J. A. (2006). Elements of information theory (2. ed.) . W iley . Doreian et al., 2004. Doreian, P ., Batagelj, V ., and Ferligoj, A. (2004). Generalized blockmodeling of two-mode network data. Social networks , 26(1):29–53. Fortunato, 2010. Fortunato, S. (2010). Community detection in graphs. Physics Reports , 486(3- 5):75 – 174. Gr ¨ unwald, 2007. Gr ¨ unwald, P . (2007). The Minimum Description Length Principle . Mit Press. Guigour ` es and Boull ´ e, 2011. Guigour ` es, R. and Boull ´ e, M. (2011). Segmentation of towns using call detail records. NetMob W orkshop at IEEE SocialCom. Guigour ` es et al., 2012. Guigour ` es, R., Boull ´ e, M., and Rossi, F . (2012). A triclustering approach for time ev olving graphs. In IEEE 12th International Conference on Data Mining W orkshops (ICDMW) , pages 115–122. IEEE. Jaynes, 2003. Jaynes, E. (2003). Probability Theory: The Logic of Science . Cambridge Uni v . Press. Kemp and T enenbaum, 2006. Kemp, C. and T enenbaum, J. (2006). Learning systems of concepts with an infinite relational model. In 21st National Confer ence on Artificial Intelligence . Nadel, 1957. Nadel, S. F . (1957). The Theory of Social Structure . Cohen & W est, London. 16 Romain Guigour ` es, Marc Boull ´ e and Fabrice Rossi Nadif and Gov aert, 2010. Nadif, M. and Go vaert, G. (2010). Model-based co-clustering for contin- uous data. In ICMLA , pages 175–180. Newman, 2006. Newman, M. (2006). Modularity and community structure in networks. Proc Natl Acad Sci U S A , 103(23):8577–8582. Nowicki and Snijders, 2001. Nowicki, K. and Snijders, T . (2001). Estimation and prediction for stochastic blockstructures. Journal of the American Statistical Association , 96:1077–1087. Reichardt and White, 2007. Reichardt, J. and White, D. R. (2007). Role models for complex networks. The European Physical J ournal B , 60:217–224. Schaeffer , 2007. Schaeffer , S. E. (2007). Graph clustering. Computer Science Review , 1(1):27–64. Shannon, 1948. Shannon, C. E. (1948). A mathematical theory of communication. Bell system technical journal , 27:379–423. Strehl and Ghosh, 2003. Strehl, A. and Ghosh, J. (2003). Cluster ensembles – a knowledge reuse framew ork for combining multiple partition. JMLR , 3:583–617. W asserman and Faust, 1994. W asserman, S. and Faust, K. (1994). Social Network Analysis: Meth- ods and Applications . Structural analysis in the social sciences. Cambridge Univ . Press. White et al., 1976. White, H., Boorman, S., and Breiger, R. (1976). Social structure from multiple networks: I. blockmodels of roles and positions. Am. J. of Sociology , 81(4):730–80.
Original Paper
Loading high-quality paper...
Comments & Academic Discussion
Loading comments...
Leave a Comment