Estimation of Monotone Treatment Effects in Network Experiments
Randomized experiments on social networks pose statistical challenges, due to the possibility of interference between units. We propose new methods for estimating attributable treatment effects in such settings. The methods do not require partial int…
Authors: David S. Choi
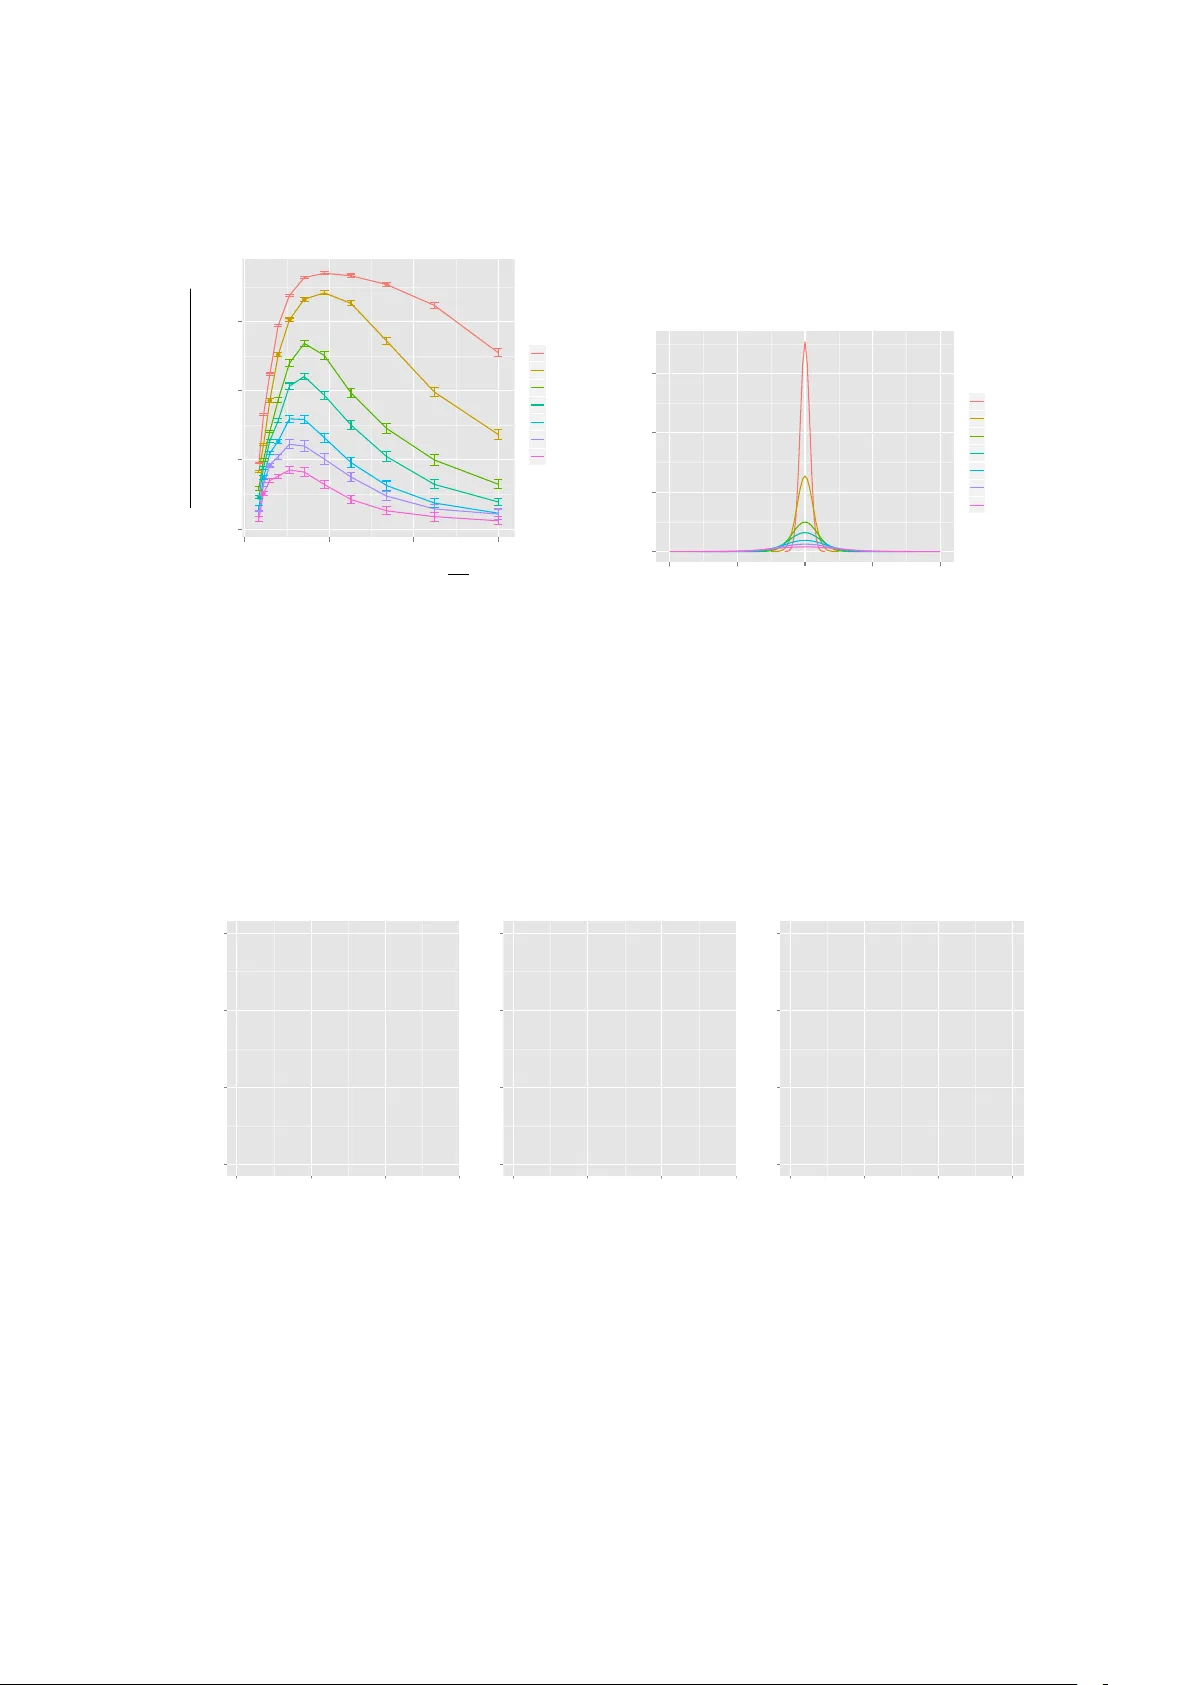
Estimation of Monotone T reatment Ef fects in Netw ork Experiments Da vid Choi June 14, 2021 Abstract Randomized experiments on social networks pose statistical challenges, due to the pos- sibility of interference between units. W e propose new methods for estimating attrib utable treatment effects in such settings. The methods do not require partial interference, but instead require an identifying assumption that is similar to requiring nonnegati ve treat- ment ef fects. Network or spatial information can be used to customize the test statistic; in principle, this can increase power without making assumptions on the data generating process. K eywords : causal inference, attributable effect, interference, randomized experiments, network data, F acebook, peer effects 1 Intr oduction Spillov er ef fects, social influence, and the sharing of information are widely believ ed to be impor- tant mechanisms for social and economic systems. T o better understand them, researchers may collect network data on relationships between units. In some cases, the data may come from a ran- domized experiment; past examples include studies in viral marketing [ Aral and W alker , 2011 ], voting beha vior [ Bond et al., 2012 , Nickerson, 2008 ], online sharing [ Kramer et al., 2014 ], edu- cation [ Sweet et al., 2013 ], and health [ Miguel and Kremer , 2004 ]. In such experiments, the outcomes tend to be social in nature, and the treatment of one indi vidual may influence others. This phenomenon, known as interference, often complicates the analysis. For example, [ Bond et al., 2012 ] describes an experiment that was conducted 1 using Facebook, a social netw ork website. On the day of the 2010 US midterm Congressional elections, participants recei ved a banner advertisement on F acebook which encouraged them to vote, with the option to self-report that they had v oted by clicking on an “I v oted” button. This advertisement was customized for each recipient, so that it displayed the total number of users who had already vie wed the advertisement and clicked “I voted”; for a random subset, the advertisement also displayed the profile pictures of up to six of the recipient’ s Facebook friends who had already self-reported. The self-reported voting rate for the treatment group (those recei ving profile pictures) was 2.08% higher than for the other participants, a difference large enough to reject a sharp null of zero ef fect. Since the content of the advertisement for each vie wer depended on the actions of pre vious vie wers, the presence of peer ef fects w as ensured by the experiment design. Additionally , participants may hav e influenced each other through con versations caused by vie wing the advertisement. Due to this interference, rigorous estimates of the ef fect size do not necessarily follo w from rejection of the sharp null, as estimation methods that assume no interference may not be applicable. W e propose a ne w approach for these types of experiments, which is based on an identifying assumption that the treatment effect is monotone. This is slightly weaker than requiring the treatment to not ha ve neg ativ e effects, either directly or indirectly , on the outcome of any unit. Aside from this assumption, the interference will be allowed to take arbitrary and unknown form. Specifically , we do not assume partial interference or a correctly specified model of social influence. The outline of the paper is as follo ws. Section 2 surv eys related works. The basic problem formulation is gi ven in Section 3 . Three methods for estimation are presented in Section 4 . These methods are demonstrated using data and simulation examples in Section 5 . Section 6 discusses practical issues and future directions. Further technical details of the methods are presented in the appendices. 2 2 Related W ork Early discussion of interference in the potential outcomes frame work is attributed to [ Rubin, 1990 , Halloran and Struchiner , 1995 ]. Current methods can be broadly divided between those which use a distribution-free rank statistic, and those which add identifying assumptions. Distribution-free rank statistics are considered in [ Rosenbaum, 2007 , Luo et al., 2012 ]. In this approach, no assumptions are made on the interference, so that the estimates are highly robust. Ho wev er , estimation is limited to rank-based quantities, i.e., on whether the treatment caused an o verall shift in the ranks of the treated population when ordering the units by outcome. For non-rank quantities of interest, such as the av erage outcome under a counterfactual treatment, it appears that additional assumptions are required. The most common identifying assumption is that the units form groups (such as households or villages) that do not interfere with each other; this is termed partial interference [ Sobel, 2006 ]. The paper [ Hudgens and Halloran, 2008 ] deri ves unbiased point estimates under partial interfer- ence, and v ariance bounds on the estimation error under a stronger condition termed stratified in- terference. Asymptotically normal estimates are gi v en in [ Liu and Hudgens, 2013 ], again assum- ing stratified interference, and finite sample error bounds are deriv ed in [ Tchetgen and V anderW eele, 2012 ]. For settings where partial interference does not apply , more general exposure models ha ve been in vestig ated by [ T oulis and Kao, 2013 , Ugander et al., 2013 , Arono w and Samii, 2012 , Ogburn and V anderW ee le, 2014 , Manski, 2013 ], with rigorous results if one assumes knowledge of the network dynamics, such as who influences whom. As a result, they may not be suitable when the underlying social mechanisms are not well understood. The recent paper [ Eckles et al., 2014 ] also studies bi- ased estimation of treatment effects under weaker assumptions than partial or fully modeled interference, which is similar in spirit to this present work. 3 3 Setup and notation Let N denote the number of units in the experiment. Let treatments be assigned by sampling L units without replacement, and let X = ( X 1 , . . . , X N ) encode the treatment assignment, where X i = 1 if the i th unit was selected for treatment and X i = 0 otherwise. Let Y = ( Y 1 , . . . , Y N ) denote the observed outcomes, and let θ = ( θ 1 , . . . , θ N ) denote the counterfactual outcomes under “full control”, i.e., if none of the units had recei ved treatment and X i = 0 for all i . As pre viously mentioned, we do not require an assumption of partial interference to hold. Instead, we require the follo wing assumption on the treatment effect: Assumption 1 (Monotonicity) . θ i ≤ Y i , for all i = 1 , . . . , N . This assumption might not be appropriate for some applications; for e xample, police inter- ventions might displace crime, so that crime rates would decrease in some areas but increase in others. On the other hand, a vaccination program via “herd immunity” might hav e a strictly beneficial ef fect on the risk of infection. Let A denote the attributable effect of the treatment, defined to be the total difference between Y and θ : A = N X i =1 ( Y i − θ i ) . (1) Our definition for A generalizes that of [ Rosenbaum, 2001 ] to allow for interference; if no interference is present, the two definitions are equiv alent. Our inferential goal is a one-sided confidence interval lower bounding A . If this lower bound on A is large, it implies that the observed treatment had a lar ge ef fect on the outcomes. Let G denote a network of observed pre-treatment social interactions between the units. This snapshot of observ ed interactions might be only a crude proxy for the actual social dynamics. Hence, we will not use G to make e xplicit assumptions on the influence between units. Instead, G will be used to choose a test statistic. Our moti vation is rob ustness to model error . If G turns out to be a poor proxy , the method will lose power but not correctness, so that any significant 4 findings will still be v alid. 4 Constructing a Confidence Interv al f or A In this section, we present three methods for estimating one-sided confidence intervals that upper bound P i θ i , which by ( 1 ) is equi valent to a lo wer bound on the attrib utable ef fect A . In Section 4.1 , a t-test based asymptotic confidence interval is presented for count-v alued outcomes, i.e., when θ and Y are nonneg ativ e integers. In Section 4.2 , a non-asymptotic estimate is presented for the special case of binary outcomes, which is then extended in Section 4.3 to utilize the observed netw ork G . 4.1 T -test Based Asymptotic Confidence Interval Suppose that the entries of θ are actually observed for the N − L untreated units. Assuming that these units are sampled without replacement, it is well known [ Thompson, 2012 ] that an unbiased point estimate for ¯ θ = N − 1 P i θ i is gi ven by the sample a verage ˆ θ , ˆ θ = 1 N − L X i : X i =0 θ i . Under certain conditions, ˆ θ is asymptotically normal, in which case an asymptotic (1 − α ) confidence upper bound for ¯ θ is giv en by ˆ θ + t α s L N ˆ σ 2 N − L , (2) where ˆ σ 2 is the estimated v ariance, ˆ σ 2 = 1 N − L − 1 X i : X i =0 ( θ i − ˆ θ ) 2 , 5 and where t α is the α -critical value of a t distribution with N − L − 1 de grees of freedom. In our setting, θ is not actually observed, and hence ( 2 ) cannot be e valuated. Let us assume that Assumption 1 holds, and also that θ is restricted to the set of nonne gati ve integers, so that 0 ≤ θ ≤ Y and θ ∈ Z N . Then an upper bound to the unknown value of ( 2 ) can be found by solving the follo wing optimization problem: max θ ∈ Z N ˆ θ + t α s L N ˆ σ 2 N − L (3) such that 0 ≤ θ i ≤ Y i for all i, which equals the highest v alue of ( 2 ) ov er all possible values of θ . A polynomial-time solution method for this optimization problem is described in Appendix A . Example 1. It may seem counterintuitive that ( 3 ) may be maximized by θ smaller than Y . T o illustrate that this may be possible, let L = 20 , N = 25 , and let the entries of Y equal (10 , 10 , 10 , 11 , 11) for the untr eated units. Using ( 2 ) while letting θ = Y gives a 95% upper bound of 10 . 9 . On the other hand, letting θ equal (0 , 10 , 10 , 11 , 11) for the untr eated units gives an upper bound of 12 . 4 , achieving the optimal value of ( 3 ) . As with any t-test, by using ( 3 ) we are implicitly assuming that ˆ θ satisfies a central limit theorem. Equi v alently , we may instead state that one of two alternativ es must be true: either ( 3 ) gi ves a correct confidence interv al, or the α -quantile of ˆ θ (after studentization) is greater than t α , which for large N − L and L roughly equates to θ having hea vy tails. 1 W e remark that bootstrapping the untreated entries in Y will not compute a confidence inter- v al for ˆ θ , since in general θ 6 = Y . Howe ver , the bootstrap may be still useful as a distributional check, testing whether ( 2 ) is v alid for the point hypothesis θ = Y . 1 for e xample, [ Bloznelis, 1999 , Th. 1.1] implies that N − 1 P i | θ 3 i | · N − 1 P i θ i − ¯ θ 2 − 3 / 2 must be lar ge. 6 4.2 Non-asymptotic Confidence Interv al for Binary Outcomes For binary-v alued outcomes, a non-asymptotic one-sided confidence interv al for P i θ i can be computed. This can be done by a process known as “in verting a test statistic” 2 . Let W ( X ; θ ) denote a test statistic of X that is parameterized by the unkno wn θ . Let w α ( θ ) denote the α -quantile of W ( X ; θ ) , defined by P ( W ( X ; θ ) ≤ w α ( θ )) = α . (4) While θ is unknown, we kno w two constraints on its v alue. First, we know that θ ≤ Y , by Assumption 1 . Second, we know that W ( X ; θ ) ≤ w α ( θ ) with probability α , by ( 4 ) . Hence, to upper bound P i θ i with probability α , we can find the θ which maximizes P i θ i while satisfying these constraints. That is, we can solve the optimization problem max θ ∈{ 0 , 1 } N N X i =1 θ i (5) such that W ( X ; θ ) ≤ w α ( θ ) θ i ≤ Y i for all i. It can be seen that ( 5 ) includes all non-rejected hypotheses, thus finding a one-sided confidence interv al for P i θ i . W e will use the test statistic W basic , defined as W basic ( X ; θ ) = N X i =1 X i θ i . It can be seen that W basic ( X ; θ ) is generated by sampling L entries from θ without replacement, 2 In practice, in verting a test statistic to produce a confidence interval can potentially result in unstable behavior when the underlying assumptions are violated [ Gelman, 2011 ]. While we do not recommend our methods when Assumption 1 is violated, the y do not suffer from this behavior . This is because ( 5 ) will always have at least one feasible solution, θ = 0 . 7 so that W basic ( X ; θ ) is a Hyp ergeometric( P i θ i , N − P i θ i , L ) random variable. As a result, the optimization problem ( 5 ) is easily computable for W = W basic , and we describe a solution method in Appendix B . This method was originally presented in [ Rosenbaum, 2001 , Appendix], but for the case of no interference. W eaker Assumption W e present a weak er assumption than Assumption 1 , which may be applicable when the treatment ef fect is not strictly nonnegati ve: Assumption 2 (Aggregate Monotonicity for the Untreated) . X i : X i =0 θ i ≤ X i : X i =0 Y i . Unlike Assumption 1 , which requires the treatment effect to be nonneg ativ e for e very indi vidual, Assumption 2 only restricts the sum of the treatment ef fect over those units which did not recei ve treatment. T o upper bound P i θ i under Assumption 2 , we can solve a modification of ( 5 ), max θ ∈{ 0 , 1 } N N X i =1 θ i (6) such that W ( X ; θ ) ≤ w α ( θ ) X i : X i =0 θ i ≤ X i : X i =0 Y i , where we hav e replaced the constraint θ ≤ Y by Assumption 2 . Details of the solution method for W = W basic are gi ven in Appendix B . 4.3 Using the observ ed network G W e extend the approach of Section 4.2 to handle a ne w statistic W spill , which utilizes the observed network G . This statistic will hav e po wer to detect treatment effects that spill ov er from treated 8 units to their untreated neighbors. Let W spill be gi ven by W spill ( X ; θ ) = 1 L W basic ( ˜ X ; θ ) = 1 L N X i =1 ˜ X i θ i , where ˜ X is a smoothed v ersion of X , so that each entry in ˜ X is a weighted a verage of nearby entries in X . More precisely , let ˜ X equal ˜ X = X T K, where the smoothing matrix K ∈ R N × N is gi ven by K ij = 1 Z j exp( − d 2 ij /σ 2 K ) if d ij ≤ d max ,K 0 otherwise, (7) where d ij denotes the distance between units i and j in G ; where d max ,K ≥ 0 , σ K > 0 are shape parameters; and where Z j denotes a normalizing constant Z j = X i : d ij ≤ d max ,K exp( − d 2 ij /σ 2 K ) , chosen so that the columns sum to one, making each element of ˜ X a weighted average of elements in X . Because each entry of ˜ X is a weighted average, units that are close to treated units will have high v alues in ˜ X , e ven if the y are not treated themselves. This will gi ve W spill po wer to detect spillov ers. Ho we ver , unlike W basic , exact solution of ( 5 ) is not computationally feasible for W = W spill . In Appendix C , ( 25 ) gi ves a relaxation of ( 5 ) that can be ef ficiently solved when 9 the outcomes are binary-v alued, yielding a asymptotically conservati ve estimate of A under Assumption 1 . 5 Data and Simulation Examples In this section, we present data and simulation examples to exhibit the performance of the methods described in the pre vious section. In Section 5.1 , the estimator ( 3 ) is used to analyze a primary school de worming e xperiment presented in [ Miguel and Kremer , 2004 ]. In Section 5.2 , the Facebook election e xperiment of [ Bond et al., 2012 ] is analyzed using the test statistic W basic . In Section 5.3 , simulated experiments are used to e valuate the performance of the test statistic W spill . 5.1 Analysis of [ Miguel and Kr emer , 2004 ] [ Miguel and Kremer , 2004 ] describes a primary school de worming project that was carried out in 1998 in Busia, K enya, in order to reduce the number of infections by parasitic worms in young children. W e restrict analysis to N = 50 schools in a high infection area of Busia, which were di vided into 2 equal-sized groups. Schools in group 1 receiv ed free dew orming treatments beginning in 1998, while group 2 did not. Students were surveyed in 1999, and substantially fe wer infections were found in the treatment-eligible pupils in group 1 compared to group 2, with 141 and 506 infections respectively . It is believ ed that the number of infections in each schools was af fected not only by its own treatment status, b ut also that of other schools as well. This is because students that receiv ed the deworming treatment were susceptible to re-infection by infected students. T o demonstrate the estimator giv en by ( 3 ) on this experiment, we will assume that treatment was assigned by sampling without replacement 3 , and that all missing values in the data are 3 Groups 1, 2, and 3 (with group 3 e xcluded from the 1999 survey) were actually assigned by di viding the schools into administrativ e subunits, listing them in alphabetical order , and assigning ev ery third school to the same 10 ignorable. W e also assume that the de worming treatment ne ver increases the risk of infection, either to its direct recipient or to others. Under these assumptions, we solv e a variant of ( 3 ) as discussed in Appendix A . The resulting estimates are that with 95% confidence, the number of infections that would hav e occurred if all schools recei ved de worming is upper bounded by 347 , and the number of infections that would ha ve occurred if no schools receiv ed de worming is lo wer bounded by 829 . These estimates may well be conservati ve, as no spatial information was used. Howe ver , the y are not vaccuous; the one-sided confidence intervals are equal to those gi ven by a regular t-test, which requires a much stronger assumption of no interference between schools, and an identical assumption regarding the asymptotic normality of ˆ θ . 5.2 Election Day F acebook Experiment Using the reported counts for each treatment/outcome combination for the Facebook e xperiment of [ Bond et al., 2012 ], we may estimate the attributable effect A by solving ( 5 ) or ( 6 ) for W = W basic . In both cases, the resulting 95% confidence interv al for A equals [1199323 , ∞ ) , implying that the usage of profile pictures caused at least 1,199,323 users to click “I voted”, when they would not ha ve done so otherwise. This equals 2.0% of the treated population, matching the estimate of [ Bond et al., 2012 ] which assumed no interference. As the solutions to ( 5 ) and ( 6 ) are the same, our estimate of A is v alid under either As- sumption 1 or Assumption 2 . Possibly , some indi viduals may have been discouraged from voting by seeing the profile picture of a Facebook friend (for example, perhaps due to a negati ve relationship), which would violate Assumption 1 . Assumption 2 allo ws for this possibility , since no restrictions are made on the ef fects of treatment on the treated. group. 11 5.3 Simulated Study In settings where spillov er ef fects are large, the statistic W spill may outperform W basic by identifying clusters of outcomes that were caused by the treatment. T o demonstrate this beha vior , we ran simulations in which treatments resulted in higher probabilities of positiv e outcomes not only for the treated units, but also for those nearby as well. W e e xplored a range of scenarios, v arying the number of treatments and their spatial separation, the spillov er radius of the treatment ef fect, the counterfactual P i θ i , and also the choice of kernel matrix K . W e found that estimates using W spill were most accurate and robust to choice of K when the treatments resulted in many well-separated clusters of positiv e outcomes; in particular , increasing the number of treatments or their potency could could actually decrease accuracy , by causing treatment effects to “run into each other”. Description of Simulated Experiments In each simulation, N units were placed on a uni- formly spaced √ N × √ N grid. Sampling with replacement w as used to select units j 1 , . . . , j L for treatment, and auxiliary binary variables Z 1 , . . . , Z L were generated with distribution Bernoulli(1 / 2) . For i = 1 , . . . , N , each counterfactual outcome θ i was a Bernoulli( p 0 ) ran- dom v ariable, and each observed outcome Y i equaled 1 if θ i = 1 , and otherwise equaled a Bernoulli( P i ) random v ariable, where the probability P i of having outcome Y i = 1 due to treatment was gi ven by P i = 1 − L Y ` =1 (1 − h ( i, j ` )) Z ` , (8) where h denotes a truncated gaussian, h ( i, j ) = 0 if d ij > d max ,h min 1 , C exp {− d 2 ij /σ 2 h } otherwise , (9) 12 where d ij denotes distance between units i and j on the grid, and where d max ,h , C , and σ h are shape parameters. In words, ( 8 ) - ( 9 ) imply that each treatment ` has no effect if Z ` = 0 , and otherwise has an area effect that is independent of other treatments, i.e., each treatment ` for which Z ` = 1 has probability h ( i, j ` ) of independently causing unit i to have outcome Y i = 1 . For each experiment, estimation using W spill was computed by solving ( 25 ) , which is a relaxation of ( 5 ) as discussed in Appendix C . In all simulations where the spillov er ef fects were large, we note that W basic and ( 3 ) ga ve nearly v acuous estimates, since they cannot detect spillov ers. Simulation Results Figure 1a sho ws estimation performance as a function of the generati ve h and the assumed kernel K . T o construct this figure, 7 different choices for h were used, in which σ h and C were adjusted so that the de gree of localization of the treatment effect was v aried while A was k ept constant in expectation. These choices for h are sho wn in Figure 1b , with examples of the simulated outcomes sho wn in Figure 2 . The assumed kernel K was v aried by ranging the bandwidth parameter σ K used in ( 7 ) from σ h / 3 to 6 σ h . In all cases, performance e ventually decreased for large σ K , suggesting that the choice of K should reflect knowledge about the anticipated treatment ef fect. For localized ef fects (i.e., small σ h ), the estimates were more accurate, and allowed for the bandwidth of K to be chosen many times larger than σ h . For dif fuse ef fects (i.e., large σ h ), estimates were highly conserv ativ e and more sensitiv e to the choice of K . These results suggest that estimation using W spill may require spatial separation between treated units, so that the ef fects can be localized to their source. Figure 3 sho ws av erage estimation performance as a function of the number of treatments L , and also their spatial density L/ N , which was controlled by varying the grid size N . W e found that increasing with the number of treatments impro ved accurac y , while increasing the spatial density of treatments worsened it. As a result, increasing L while keeping N fixed could decrease accuracy , due to the diminished spatial separation between the treatments. Examples 13 ● ● ● ● ● ● ● ● ● ● ● ● ● ● ● ● ● ● ● ● ● ● ● ● ● ● ● ● ● ● ● ● ● ● ● ● ● ● ● ● ● ● ● ● ● ● ● ● ● ● ● ● ● ● ● ● ● ● ● ● ● ● ● ● ● ● ● ● ● ● ● ● ● ● ● ● ● 0.00 0.25 0.50 0.75 0 2 4 6 Bandwidth Mismatch σ K σ h Estimated Lower Bound for A Actual V alue of A σ h ● ● ● ● ● ● ● 3 5 8 10 13 16 20 (a) Estimation accuracy 0.00 0.25 0.50 0.75 −60 −30 0 30 60 Distance h σ h 3 5 8 10 13 16 20 (b) V arious h used in simulations Figure 1: A verage accuracy (and standard errors) of estimated lo wer bound for A , for v arious choices of spillov er function h and mismatched smoothing matrix K . The spillo ver functions h , sho wn in (b), were chosen by v arying the bandwidth σ h while keeping A constant in e xpectation. K was chosen to hav e a mismatched bandwidth σ K that was a multiple of the generativ e σ h . 100 simulations per data point; examples of the simulations are sho wn in Fig. 2 . ● ● ● ●●● ● ● ● ● ● ● ● ● ● ● ● ● ● ● ● ● ● ● ● ● ● ● ● ● ● ● ● ● ● ● ● ● ● ● ● ● ● ● ● ●● ● ● ● ● ● ● ● ● ● ● ● ● ● ● ●● ● ● ● ● ● ● ● ● ● ● ● ● ● ● ● ● ● ● ● ● ● ●● ●● ● ● ● ● ● ● ● ● ● ● ● ● ● ● ● ● ● ● ● ● ● ● ● ● ●● ● ● ● ● ● ● ● ● ● ●● ● ● ● ● ● ● ● ● ● ● ● ● ● ● ● ● ● ● ● ● ● ● ● ● ● ● ● ● ● ● ● ● ● ● ● ● ● ● ● ● ● ● ● ● ● ● ● ● ● ● ● ● ● ● ● ● ● ● ● ● ● ●● ● ● ● ● ● ●● ● ● ● ● ● ● ● ● ● ● ● ● ● ● ● ● ● ● ● ● ● ● ● ● ● ●● ● ● ● ● ● ● ● ● ● ● ●● ● ● ● ●● ● ● ● ● ● ● ● ● ● ● ● ● ● ● ●● ● ● ● ● ● ● ● ● ● ● ● ● ● ● ● ● ● ● ● ● ● ● ● ● ● ● ● ● ● ● ● ● ● ● ● ● ● ● ●● ● ● ● ● ● ● ● ● ● ● ● ● ●● ● ● ● ● ● ● ● ● ● ● ● ● ● ● ● ● ● ● ● ● ● ● ● ●● ●● ● ● ● ● ● ● ● ● ● ● ● ● ● ● ● ● ●●● ● ● ● ● ● ● ● ● ● ● ● ● ●● ● ● ● ● ● ● ● ● ● ● ● ● ● ● ● ● ● ● ● ● ● ● ● ● ● ● ● ● ● ● ● ● ● ● ● ● ● ● ● ● ● ● ● ● ● ● ● ● ● ● ● ● ● ● ● ● ● ● ● ● ● ●● ● ● ● ● ● ● ● ● ● ● ● ●● ● ● ● ● ● ● ● ● ● ● ● ● ● ● ● ● ● ● ● ● ● ● ● ● ● ● ● ● ● ● ● ● ● ● ● ● ● ● ● ● ● ● ● ● ● ● ● ● ● ● ● ● ● ● ● ● ● ● ● ● ● ● ● ● ● ● ● ● ● ● ● ● ● ● ● ● ● ● ● ● ● ● ● ● ● ● ● ● ● ● ● ● ● ● ● ● ● ● ● ● ● ● ● ● ● ● ● ● ● ● ● ● ● ● ● ● ● ● ● ● ● ● ● ● ● ● ● ● ● ● ● ● ● ● ● ● ● ● ● ● ● ● ● ● ● ● ● ● ● ● ● ● ● ● ● ● ● ● ● ● ● ● ● ● ● ● ● ● ● ● ● ● ● ● ● ● ● ● ● ● ● ● ● ● ● ● ● ● ● ● ● ● ● ● ● ● ● ● ● ● ● ● ● ● ● ● ● ● ● ● ● ● ● ● ● ● ● ● ● ● ● ● ● ● ● ● ● ● ● ● ● ● ● ● ● ● ● ● ● ● ● ● ● ● ● ● ● ● ● ● ● ● ● ● ● ● ● ● ● ● ● ● ● ● ● ● ● ● ● ● ● ● ● ● ● ● ● ● ● ● ● ● ● ● ● ● ● ● ● ● ● ● ● ● ● ● ● ● ● ● ● ● ● ● ● ● ● ● ● ● ● ● ● ● ● ● ● ● ● ● ● ● ● ● ● ● ● ● ● ● ● ● ● ● ● ● ● ● ● ● ● ● ● ● ● ● ● ● ● ● ● ● ● ● ● ● ● ● ● ● ● ● ● ● ● ● ● ● ● ● ● ● ● ● ● ● ● ● ● ● ● ● ● ● ● ● ● ● ● ● ● ● ● ● ● ● ● ● ● ● ● ● ● ● ● ● ● ● ● ● ● ● ● ● ● ● ● ● ● ● ● ● ● ● ● ● ● ● ● ● ● ● ● ● ● ● ● ● ● ● ● ● ● ● ● ● ● ● ● ● ● ● ● ● ● ● ● ● ● ● ● ● ● ● ● ● ● ● ● ● ● ● ● ● ● ● ● ● ● ● ● ● ● ● ● ● ● ● ● ● ● ● ● ● ● ● ● ● ● ● ● ● ● ● ● ● ● ● ● ● ● ● ● ● ● ● ● ● ● ● ● ● ● ● ● ● ● ● ● ● ● ● ● ● ● ● ● ● ● ● ● ● ● ● ● ● ● ● ● ● ● ● ● ● ● ● ● ● ● ● ● ● ● ● ● ● ● ● ● ● ● ● ● ● ● ● ● ● ● ● ● ● ● ● ● ● ● ● ● ● ● ● ● ● ● ● ● ● ● ● ● ● ● ● ● ● ● ● ● ● ● ● ● ● ● ● ● ● ● ● ● ● ● ● ● ● ● ● ● ● ● ● ● ● ● ● ● ● ● ● ● ● ● ● ● ● ● ● ● ● ● ● ● ● ● ● ● ● ● ● ● ● ● ● ● ● ● 0 100 200 300 0 100 200 30 0 (a) σ h = 3 ; highly localized ● ● ● ● ● ● ● ● ● ● ● ● ● ● ● ● ● ● ●● ● ● ● ● ●● ● ● ● ● ● ● ● ● ● ● ● ● ● ● ● ● ● ● ● ●● ● ● ● ● ● ● ● ● ● ● ● ● ● ● ● ● ● ● ● ● ● ● ● ● ● ● ● ● ● ● ● ● ● ● ● ● ● ● ● ● ● ● ● ● ● ● ● ● ● ● ● ● ● ● ● ● ● ● ● ● ● ● ● ● ● ● ● ● ● ● ● ● ● ● ● ● ● ● ● ● ● ● ● ● ● ● ● ● ● ● ● ● ● ● ● ● ● ● ● ● ● ● ●● ● ● ●● ● ● ● ● ● ● ● ● ● ● ● ● ● ● ●● ● ● ● ● ● ● ● ● ● ● ● ● ● ● ● ● ● ● ● ● ● ● ● ● ● ● ● ● ●● ● ● ● ● ● ● ● ● ●● ● ● ● ● ● ● ● ● ● ● ● ● ● ●● ● ● ● ● ●● ● ● ● ● ● ● ● ● ● ● ● ● ● ● ● ● ● ● ● ● ● ● ● ● ● ● ● ● ● ● ● ● ● ● ● ● ● ● ● ● ● ● ● ● ● ● ● ● ● ● ● ● ● ● ● ● ● ● ● ● ● ● ● ● ● ● ● ● ● ● ● ● ● ● ● ● ● ● ● ● ● ● ● ● ● ● ● ● ● ● ●● ● ● ● ● ● ● ● ● ● ● ● ● ● ● ● ● ● ● ●● ● ● ● ● ● ● ● ● ● ● ● ● ● ● ● ● ● ●● ● ● ● ● ● ● ● ● ● ● ● ● ● ● ● ● ● ● ● ● ● ● ● ● ● ● ● ● ● ● ● ● ● ● ● ● ● ● ● ● ● ● ● ● ● ● ● ● ● ● ● ● ● ● ● ● ● ● ● ● ● ● ● ● ● ● ● ● ● ● ● ● ● ● ● ● ● ● ● ● ● ● ● ● ● ● ● ● ● ● ● ● ● ●● ● ● ● ● ● ● ● ● ●●● ● ● ● ● ●● ● ●● ● ● ● ● ● ● ● ● ● ● ● ● ● ● ● ● ● ● ● ● ● ● ● ● ● ●● ● ● ● ● ● ● ● ● ● ● ● ● ● ● ● ● ● ● ● ● ● ●● ● ● ● ● ● ● ● ● ● ● ● ● ● ● ● ● ● ● ● ● ● ● ● ●● ● ● ● ● ● ● ●● ●● ● ● ● ● ● ● ● ● ● ● ● ● ● ● ● ● ● ● ● ● ● ● ● ● ● ● ● ● ● ● ● ● ●● ● ● ● ● ● ● ● ● ● ● ● ●● ● ● ● ● ● ● ● ● ● ● ● ● ● ● ● ● ● ● ● ● ● ● ● ● ● ● ● ● ●● ● ● ● ● ● ● ● ● ●● ● ● ● ● ● ● ● ● ● ● ● ● ● ● ● ● ● ● ● ● ● ● ● ● ● ● ● ● ● ● ● ● ● ● ● ● ● ● ● ● ● ● ● ● ● ● ● ●● ● ● ● ● ● ● ● ● ● ● ● ● ● ● ● ● ● ● ● ● ● ● ● ● ● ● ● ● ● ● ● ● ● ● ● ● ● ● ● ● ● ● ● ● ● ● ● ● ● ● ● ● ● ● ● ● ● ● ● ● ● ● ● ● ● ● ● ● ● ● ● ● ● ● ● ● ● ● ● ● ● ● ● ● ● ● ● ● ● ● ● ● ● ● ● ● ● ● ● ● ● ● ● ● ● ● ● ● ● ● ● ● ● ● ● ● ● ● ● ● ● ● ● ● ● ● ● ● ● ● ● ● ● ● ● ● ● ● ● ● ● ● ● ● ● ● ● ● ● ● ● ● ● ● ● ● ● ● ● ● ● ● ● ● ● ● ● ● ● ● ● ● ● ● ● ● ● ● ● ● ● ● ● ● ● ● ● ● ● ● ● ● ● ● ● ● ● ● ● ● ● ● ● ● ● ● ● ● ● ● ● ● ● ● ● ● ● ● ● ● ● ● ● ● ● ● ● ● ● ● ● ● ● ● ● ● ● ● ● ● ● ● ● ● ● ● ● ● ● ● ● ● ● ● ● ● ● ● ● ● ● ● ● ● ● ● ● ● ● ● ● ● ● ● ● ● ● ● ● ● ● ● ● ● ● ● ● ● ● ● ● ● ● ● ● ● ● ● ● ● ● ● ● ● ● ● ● ● ● ● ● ● ● ● ● ● ● ● ● ● ● ● ● ● ● ● ● ● ● ● ● ● ● ● ● ● ● ● ● ● ● ● ● ● ● ● ● ● ● ● ● ● ● ● ● ● ● ● ● ● ● ● ● ● ● ● ● ● ● ● ● ● ● ● ● ● ● ● ● ● ● ● ● ● ● ● ● ● ● ● ● ● ● ● ● ● ● ● ● ● ● ● ● ● ● ● ● ● ● ● ● ● ● ● ● ● ● ● ● ● ● ● ● ● ● ● ● ● ● ● ● ● ● ● ● ● ● ● ● ● ● ● ● ● ● ● ● ● ● ● ● ● ● ● ● ● ● ● ● ● ● ● ● ● ● ● ● ● ● ● ● ● ● ● ● ● ● ● ● ● ● ● ● ● ● ● ● ● ● ● ● ● ● ● ● ● ● ● ● ● ● ● ● ● ● ● ● ● ● ● ● ● ● ● ● ● ● ● ● ● ● ● ● ● ● ● ● ● ● ● ● ● ● ● ● ● ● ● ● ● ● ● ● ● ● ● ● ● ● ● ● ● ● ● ● ● ● ● ● ● ● ● ● ● ● ● ● ● ● ● ● ● ● ● ● ● ● ● ● ● ● ● ● ● ● ● ● ● ● ● ● ● ● ● ● ● ● ● ● ● ● ● ● ● ● ● ● ● ● ● ● ● ● ● ● ● ● ● ● ● ● ● ● ● ● ● ● ● ● ● ● ● ● ● ● ● ● ● ● ● ● ● ● ● ● ● ● ● ● ● ● ● ● ● ● ● ● ● ● ● ● ● 0 100 200 300 0 100 200 30 0 (b) σ h = 10 ; medium localiza- tion ● ● ● ● ● ● ● ● ● ● ● ● ● ● ● ● ● ● ● ● ● ● ● ● ● ● ● ● ● ● ● ● ● ● ● ● ● ● ● ● ● ● ● ● ● ● ● ● ● ● ● ● ● ● ● ● ● ● ● ● ● ● ● ● ● ● ● ● ● ● ● ● ● ● ● ● ● ● ● ● ● ● ● ● ● ● ● ● ● ● ● ● ● ● ● ● ● ● ● ● ● ● ● ● ● ● ● ● ● ● ● ● ● ● ● ● ● ● ● ● ● ● ● ● ● ● ● ● ● ● ● ● ● ● ● ● ● ● ● ● ● ● ● ● ● ● ● ● ● ● ● ● ● ● ● ● ● ● ● ● ● ● ● ● ● ● ● ● ● ● ● ● ● ● ● ● ● ● ● ● ● ● ● ● ● ● ● ● ● ● ● ● ● ● ● ● ● ● ● ● ● ● ● ● ● ● ● ● ● ● ● ● ● ● ● ● ● ● ● ● ● ● ● ● ● ● ● ● ● ● ● ● ● ● ● ● ● ● ● ● ● ● ● ● ● ●● ● ● ● ● ● ● ● ● ● ● ● ● ● ● ● ● ● ● ● ● ● ● ● ● ● ● ● ● ● ● ● ● ● ● ● ● ● ● ● ● ● ● ● ● ● ● ● ● ● ● ● ● ● ● ●● ● ● ● ● ● ● ● ●● ● ● ● ● ● ● ● ● ● ● ● ● ● ● ● ● ● ● ● ● ● ● ● ● ● ● ● ● ● ● ● ● ● ● ● ● ● ● ● ● ● ● ● ● ● ● ● ● ● ● ● ● ● ● ● ● ● ● ● ● ● ● ● ● ● ● ● ● ● ● ● ● ● ● ● ● ● ● ● ● ● ● ● ● ● ● ● ● ● ● ● ● ● ● ● ● ● ● ● ● ● ● ● ● ● ● ● ● ● ● ● ● ● ● ● ● ● ● ● ●● ● ● ● ● ● ● ● ● ●● ● ● ● ● ● ● ● ● ● ● ●● ● ● ● ● ● ● ● ● ● ● ● ● ● ● ● ● ● ● ● ● ● ● ● ● ● ● ● ● ● ● ● ● ● ● ● ● ● ● ● ● ● ● ● ● ● ● ● ● ● ● ● ● ● ● ● ● ● ● ● ● ● ● ● ● ● ● ● ● ● ● ● ● ● ● ● ● ● ● ● ● ● ● ● ● ● ● ● ● ● ● ● ● ● ● ● ● ● ● ● ● ● ● ● ● ● ● ● ● ● ● ● ● ● ● ● ● ● ● ● ● ● ● ● ● ● ● ● ● ● ● ● ● ● ● ● ● ● ● ● ● ● ● ● ● ● ● ● ● ● ● ● ● ● ● ● ● ● ● ● ● ● ● ● ● ● ● ● ● ● ● ● ● ● ● ● ● ● ● ● ● ● ● ● ● ● ● ● ● ● ● ● ● ● ● ● ● ● ● ● ● ● ● ● ● ● ● ● ● ● ● ● ● ● ● ● ● ● ● ● ● ● ● ● ● ● ● ● ● ● ● ● ● ● ● ● ● ● ● ● ● ● ● ● ● ● ● ● ● ● ● ● ● ● ● ● ● ● ● ● ● ● ● ● ● ● ● ● ● ● ● ● ● ● ● ● ● ● ● ● ● ● ● ● ● ● ● ● ● ● ● ● ● ● ● ● ● ● ● ● ● ● ● ● ● ● ● ● ● ● ● ● ● ● ● ● ● ● ● ● ● ● ● ● ● ● ● ● ● ● ● ● ● ● ● ● ● ● ● ● ● ● ● ● ● ● ● ● ● ● ● ● ● ● ● ● ● ● ● ● ● ● ● ● ● ● ● ● ● ● ● ● ● ● ● ● ● ● ● ● ● ● ● ● ● ● ● ● ● ● ● ● ● ● ● ● ● ● ● ● ● ● ● ● ● ● ● ● ● ● ● ● ● ● ● ● ● ● ● ● ● ● ● ● ● ● ● ● ● ● ● ● ● ● ● ● ● ● ● ● ● ● ● ● ● ● ● ● ● ● ● ● ● ● ● ● ● ● ● ● ● ● ● ● ● ● ● ● ● ● ● ● ● ● ● ● ● ● ● ● ● ● ● ● ● ● ● ● ● ● ● ● ● ● ● ● ● ● ● ● ● ● ● ● ● ● ● ● ● ● ● ● ● ● ● ● ● ● ● ● ● ● ● ● ● ● ● ● ● ● ● ● ● ● ● ● ● ● ● ● ● ● ● ● ● ● ● ● ● ● ● ● ● ● ● ● ● ● ● ● ● ● ● ● ● ● ● ● ● ● ● ● ● ● ● ● ● ● ● ● ● ● ● ● ● ● ● ● ● ● ● ● ● ● ● ● ● ● ● ● ● ● ● ● ● ● ● ● ● ● ● ● ● ● ● ● ● ● ● ● ● ● ● ● ● ● ● ● ● ● ● ● ● ● ● ● ● ● ● ● ● ● ● ● ● ● ● ● ● ● ● ● ● ● ● ● ● ● ● ● ● ● ● ● ● ● ● ● ● ● ● ● ● ● ● ● ● ● ● ● ● ● ● ● ● ● ● ● ● ● ● ● ● ● ● ● ● ● ● ● ● ● ● ● ● ● ● ● ● ● ● ● ● ● ● ● ● ● ● ● ● ● ● ● ● ● ● ● ● ● ● ● ● ● ● ● ● ● ● ● ● ● ● ● ● ● ● ● ● ● ● ● ● ● ● ● 0 100 200 300 0 100 200 300 (c) σ h = 20 ; dif fuse effects Figure 2: Examples of simulated experiments used to generate Fig. 1 , in which the spillover function h was v aried while the expectation of A was held constant. N = 90 , 000 units were placed on a 300 × 300 grid. Black circles denote treated units ( L = 50 ), red dots denote units with outcome 1. T reatment ef fects were lar ge; on average, each treatment caused 12.5 outcomes, and P i Y i = 1225 and P i θ i = 600 in e xpectation. 14 ● ● ● ● ● ● ● ● ● ● ● ● ● ● ● ● ● ● ● ● ● ● ● ● ● ● ● ● ● ● ● ● ● ● ● ● ● ● ● ● ● ● ● ● ● ● ● ● ● ● ● ● ● ● ● ● ● ● ● ● ● ● ● ● ● ● ● ● ● ● ● ● ● ● ● ● ● ● ● ● ● ● ● ● ● ● ● ● ● ● ● 0.25 0.50 0.75 0 100 200 300 Number of T reatments (L) Estimated Lower Bound for A Actual V alue of A L N ● ● ● ● ● ● ● 0.004 0.011 0.017 0.023 0.03 0.036 0.042 Figure 3: A verage estimation accurac y (and standard errors) using W spill with smoothing matrix K matched to the generati ve h , while v arying the number of treatments L and their spatial density L/ N . 400 simulations per data point; examples of the simulations are sho wn in Fig. 4 of the simulations used are sho wn in Figure 4 . Figure 5 shows the a verage estimation performance when d max ,h = 0 , meaning that the simulated treatments had no spillo vers. The estimated lo wer bound on A was produced either by in verting W basic , or by in verting W spill with d max ,K = 0 , 1 , 2 ; the parameter d max ,K can be interpreted as an assumption on the maximum distance between a treated unit and its spillo ver . Estimation using W basic was most accurate; on av erage, the estimated lower bound on A was 93% of the true v alue. Estimation using W spill was less accurate, ranging from 63% of the true v alue when d max ,K = 0 to the trivial lower bound of zero when d max ,K = 2 . These results reinforce that K should reflect knowledge of the anticipated treatment effect, and that W basic may perform better when spillov ers are at zero or near-zero le vels. As expected, the co verage rates for the estimated 95 % one-sided confidence intervals were conserv ativ ely high. The highest frequency of violated confidence interv als was 3%, which occurred when L = 10 , L/ N = 0 . 04 . Ov er all of the simulations, only 0.1% of them resulted in a confidence interv al which did not cover the true v alue of A . 15 ● ● ● ● ● ● ● ● ● ● ● ● ● ● ● ● ● ● ● ● ● ● ● ● ● ● ● ● ● ● ● ● ● ● ● ● ● ● ● ● ● ● ● ● ● ● ● ● ● ● ● ● ● ● ● ● ● ● ● ● ● ● ● ● ● ● ● ● ● ● ● ● ● ● ● ● ● ● ● ● ● ● ● ● ● ● ● ● ● ● ● ● ● ● ● ● 0 10 20 30 40 50 0 10 20 30 40 5 0 (a) L = 10 , L/ N = 0 . 04 (50 × 50 grid) ● ●● ● ● ● ● ● ● ● ● ● ● ● ●● ● ● ● ● ●● ●● ●● ● ● ●● ● ● ● ● ● ● ● ●● ● ● ● ● ● ● ● ●● ● ●● ● ●● ● ● ● ● ●● ● ● ● ● ● ● ● ● ● ● ● ●● ● ● ● ●● ● ● ● ●● ● ●● ● ● ● ● ● ● ● ● ●● ● ● ● ● ● ●● ●● ● ●● ● ● ● ●● ● ● ● ● ● ●● ● ● ●● ●● ● ● ● ● ●● ● ●● ● ● ● ● ●● ● ● ● ● ●● ● ● ● ● ● ●● ● ● ● ● ● ● ●● ●● ● ●● ●● ●● ● ● ● ● ● ● ● ● ● ● ●● ● ● ● ● ● ● ● ● ● ● ● ● ● ●● ● ● ● ● ● ● ● ● ● ● ● ● ● ●● ● ● ● ● ● ● ● ● ●● ● ● ●● ●● ● ● ● ● ●● ●● ● ● ● ● ●● ● ● ● ●● ● ●● ●● ● ● ● ● ● ● ●● ● ● ● ● ● ● ●● ● ●● ● ● ●● ● ● ● ● ●● ● ● ● ●● ●● ● ● ● ● ● ● ●● ● ● ●● ● ● ●● ● ● ● ● ● ●● ● ● ● ● ● ●● ● ●● ● ● ● ● ● ●● ● ●● ● ●● ●● ● ●● ●● ● ● ●● ● ● ● ●● ● ●● ● ● ● ●● ● ● ● ● ● ● ● ● ●● ●● ● ●● ● ● ● ● ● ● ● ●● ● ● ● ● ● ● ● ●● ● ● ● ● ● ● ●● ● ● ● ● ●● ● ● ● ● ● ● ● ● ● ● ● ● ● ● ● ●● ●● ● ●● ● ● ● ●● ● ●● ●● ● ● ● ● ● ●● ● ● ● ●● ● ● ● ● ● ● ● ● ● ● ● ● ● ● ● ● ● ● ● ● ● ● ● ● ● ● ● ● ● ● ● ● ● ● ● ● ● ● ● ● ● ● ● ● ● ● ● ● ● ● ● ● ● ● ● ● ● ● ● ● ● ● ● ● ● ● ● ● ● ● ● ● ● ● ● ● ● ● ● ● ● ● ● ● ● ● ● ● ● ● ● ● ● ● ● ● ● ● ● ● ● ● ● ● ● ● ● ● ● ● ● ● ● ● ● ● ● ● ● ● ● ● ● ● ● ● ● ● ● ● ● ● ● ● ● ● ● ● ● ● ● ● ● ● ● ● ● ● ● ● ● ● ● ● ● ● ● ● ● ● ● ● ● ● ● ● ● ● ● ● ● ● ● ● ● ● ● ● ● ● ● ● ● ● ● ● ● ● ● ● ● ● ● ● ● ● ● ● ● ● ● ● ● ● ● ● ● ● ● ● ● ● ● ● ● ● ● ● ● ● ● ● ● ● ● ● ● ● ● ● ● ● ● ● ● ● ● ● ● ● ● ● ● ● ● ● ● ● ● ● ● ● ● ● ● ● ● ● ● ● ● ● ● ● ● ● ● ● ● ● ● ● ● ● ● ● ● ● ● ● ● ● ● ● ● ● ● ● ● ● ● ● ● ● ● ● ● ● ● ● ● ● ● ● ● ● ● ● ● ● ● ● ● ● ● ● ● ● ● ● ● ● ● ● ● ● ● ● ● ● ● ● ● ● ● ● ● ● ● ● ● ● ● ● ● ● ● ● ● ● ● ● ● ● ● ● ● ● ● ● ● ● ● ● ● ● ● ● ● ● ● ● ● ● ● ● ● ● ● ● ● ● ● ● ● ● ● ● ● ● ● ● ● ● ● ● ● ● ● ● ● ● ● ● ● ● ● ● ● ● ● ● ● ● ● ● ● ● ● ● ● ● ● ● ● ● ● ● ● ● ● ● ● ● ● ● ● ● ● ● ● ● ● ● ● ● ● ● ● ● ● ● ● ● ● ● ● ● ● ● ● ● ● ● ● ● ● ● ● ● ● ● ● ● ● ● ● ● ● ● ● ● ● ● ● ● ● ● ● ● ● ● ● ● ● ● ● ● ● ● ● ● ● ● ● ● ● ● ● ● ● ● ● ● ● ● ● ● ● ● ● ● ● ● ● ● ● ● ● ● ● ● ● ● ● ● ● ● ● ● ● ● ● ● ● ● ● ● ● ● ● ● ● ● ● ● ● ● ● ● ● ● ● ● ● ● ● ● ● ● ● ● ● ● ● ● ● ● ● ● ● ● ● ● ● ● ● ● ● ● ● ● ● ● ● ● ● ● ● ● ● ● ● ● ● ● ● ● ● ● ● ● ● ● ● ● ● ● ● ● ● ● ● ● ● ● ● ● ● ● ● ● ● ● ● ● ● ● ● ● ● ● ● ● ● ● ● ● ● ● ● ● ● ● ● ● ● ● ● ● ● ● ● ● ● ● ● ● ● ● ● ● ● ● ● ● ● ● ● ● ● ● ● ● ● ● ● ● ● ● ● ● ● ● ● ● ● ● ● ● ● ● ● ● ● ● ● ● ● ● ● ● ● ● ● ● ● ● ● ● ● ● ● ● ● ● ● ● ● ● ● ● ● ● ● ● ● ● ● ● ● ● ● ● ● ● ● ● ● ● ● ● ● ● ● ● ● ● ● ● ● ● ● ● ● ● ● ● ● ● ● ● ● ● ● ● ● ● ● ● ● ● ● ● ● ● ● ● ● ● ● ● ● ● ● ● ● ● ● ● ● ● ● ● ● ● ● ● ● ● ● ● ● ● ● ● ● ● ● ● ● ● ● ● ● ● ● ● ● ● ● ● ● ● ● ● ● ● ● ● ● ● ● ● ● ● ● ● ● ● ● ● ● ● ● ● ● ● ● ● ● ● ● ● ● ● ● ● ● ● ● ● ● ● ● ● ● ● ● ● ● ● ● ● ● ● ● ● ● ● ● ● ● ● ● ● ● ● ● ● ● ● ● ● ● ● ● ● ● ● ● ● ● ● ● ● ● ● ● ● ● ● ● ● ● ● ● ● ● ● ● ● ● ● ● ● ● ● ● ● ● ● ● ● ● ● ● ● ● ● ● ● ● ● ● ● ● ● ● ● ● ● ● ● ● ● ● ● ● ● ● ● ● ● ● ● ● ● ● ● ● ● ● ● ● ● ● ● ● ● ● ● ● ● ● ● ● ● ● ● ● ● ● ● ● ● ● ● ● ● ● ● ● ● ● ● ● ● ● ● ● ● ● ● ● ● ● ● ● ● ● ● ● ● ● ● ● ● ● ● ● ● ● ● ● ● ● ● ● ● ● ● ● ● ● ● ● ● ● ● ● ● ● ● ● ● ● ● ● ● ● ● ● ● ● ● ● ● ● ● ● ● ● ● ● ● ● ● ● ● ● ● ● ● ● ● ● ● ● ● ● ● ● ● ● ● ● ● ● ● ● ● ● ● ● ● ● ● ● ● ● ● ● ● ● ● ● ● ● ● ● ● ● ● ● ● ● ● ● ● ● ● ● ● ● ● ● ● ● ● ● ● ● ● ● ● ● ● ● ● ● ● ● ● ● ● ● ● ● ● ● ● ● ● ● ● ● ● ● ● ● ● ● ● ● ● ● ● ● ● ● ● ● ● ● ● ● ● ● ● ● ● ● ● ● ● ● ● ● ● ● ● ● ● ● ● ● ● ● ● ● ● ● ● ● ● ● ● ● ● ● ● ● ● ● ● ● ● ● ● ● ● ● ● ● ● ● ● ● ● ● ● ● ● ● ● ● ● ● ● ● ● ● ● ● ● ● ● ● ● ● ● ● ● ● ● ● ● ● ● ● ● ● ● ● ● ● ● ● ● ● ● ● ● ● ● ● ● ● ● ● ● ● ● ● ● ● ● ● ● ● ● ● ● ● ● ● ● ● ● ● ● ● ● ● ● ● ● ● ● ● ● ● ● ● ● ● ● ● ● ● ● ● ● ● ● ● ● ● ● ● ● ● ● ● ● ● ● ● ● ● ● ● ● ● ● ● ● ● ● ● ● ● ● ● ● ● ● ● ● ● ● ● ● ● ● ● ● ● ● ● ● ● ● ● ● ● ● ● ● ● ● ● ● ● ● ● ● ● ● ● ● ● ● ● ● ● ● ● ● ● ● ● ● ● ● ● ● ● ● ● ● ● ● ● ● ● ● ● ● ● ● ● ● ● ● ● ● ● ● ● ● ● ● ● ● ● ● ● ● ● ● ● ● ● ● ● ● ● ● ● ● ● ● ● ● ● ● ● ● ● ● ● ● ● ● ● ● ● ● ● ● ● ● ● ● ● ● ● ● ● ● ● ● ● ● ● ● ● ● ● ● ● ● ● ● ● ● ● ● ● ● ● ● ● ● ● ● ● ● ● ● ● ● ● ● ● ● ● ● ● ● ● ● ● ● ● ● ● ● ● ● ● ● ● ● ● ● ● ● ● ● ● ● ● ● ● ● ● ● ● ● ● ● ● ● ● ● ● ● ● ● ● ● ● ● ● ● ● ● ● ● ● ● ● ● ● ● ● ● ● ● ● ● ● ● ● ● ● ● ● ● ● ● ● ● ● ● ● ● ● ● ● ● ● ● ● ● ● ● ● ● ● ● ● ● ● ● ● ● ● ● ● ● ● ● ● ● ● ● ● ● ● ● ● ● ● ● ● ● ● ● ● ● ● ● ● ● ● ● ● ● ● ● ● ● ● ● ● ● ● ● ● ● ● ● ● ● ● ● ● ● ● ● ● ● ● ● ● ● ● ● ● ● ● ● ● ● ● ● ● ● ● ● ● ● ● ● ● ● ● ● ● ● ● ● ● ● ● ● ● ● ● ● ● ● ● ● ● ● ● ● ● ● ● ● ● ● ● ● ● ● ● ● ● ● ● ● ● ● ● ● ● ● ● ● ● ● ● ● ● ● ● ● ● ● ● ● ● ● ● ● ● ● ● ● ● ● ● ● ● ● ● ● ● ● ● ● ● ● ● ● ● ● ● ● ● ● ● ● ● ● ● ● ● ● ● ● ● ● ● ● ● ● ● ● ● ● ● ● ● ● ● ● ● ● ● ● ● ● ● ● ● ● ● ● ● ● ● ● ● ● ● ● ● ● ● ● ● ● ● ● ● ● ● ● ● ● ● ● ● ● ● ● ● ● ● ● ● ● ● ● ● ● ● ● ● ● ● ● ● ● ● ● ● ● ● ● ● ● ● ● ● ● ● ● ● ● ● ● ● ● ● ● ● ● ● ● ● ● ● ● ● ● ● ● ● ● ● ● ● ● ● ● ● ● ● ● ● ● ● ● ● ● ● ● ● ● ● ● ● ● ● ● ● ● ● ● ● ● ● ● ● ● ● ● ● ● ● ● ● ● ● ● ● ● ● ● ● ● ● ● ● ● ● ● ● ● ● ● ● ● ● ● ● ● ● ● ● ● ● ● ● ● ● ● ● ● ● ● ● ● ● ● ● ● ● ● ● ● ● ● ● ● ● ● ● ● ● ● ● ● ● ● ● ● ● ● ● ● ● ● ● ● ● ● ● ● ● ● ● ● ● ● ● ● ● ● ● ● ● ● ● ● ● ● ● ● ● ● ● ● ● ● ● ● ● ● ● ● ● ● ● ● ● ● ● ● ● ● ● ● ● ● ● ● ● ● ● ● ● ● ● ● ● ● ● ● ● ● ● ● ● ● ● ● ● ● ● ● ● ● ● ● ● ● ● ● ● ● ● ● ● ● ● ● ● ● ● ● ● ● ● ● ● ● ● ● ● ● ● ● ● ● ● ● ● ● ● ● ● ● ● ● ● ● ● ● ● ● ● ● ● ● ● ● ● ● ● ● ● ● ● ● ● ● ● ● ● ● ● ● ● ● ● ● ● ● ● ● ● ● ● ● ● ● ● ● ● ● ● ● ● ● ● ● ● ● ● ● ● ● ● ● ● ● ● ● ● ● ● ● ● ● ● ● ● ● ● ● ● ● ● ● ● ● ● ● ● ● ● ● ● ● ● ● ● ● ● ● ● ● ● ● ● ● ● ● ● ● ● ● ● ● ● ● ● ● ● ● ● ● ● ● ● ● ● ● ● ● ● ● ● ● ● ● ● ● ● ● ● ● ● ● ● ● ● ● ● ● ● ● ● ● ● ● ● ● ● ● ● ● ● ● ● ● ● ● ● ● ● ● ● ● ● ● ● ● ● ● ● ● ● ● ● ● ● ● ● ● ● ● 0 100 200 0 100 200 (b) L = 300 , L/ N = 0 . 04 ( 265 × 265 grid) ● ● ● ● ● ● ● ● ● ● ● ● ● ● ● ● ● ● ● ● ● ● ● ● ● ● ● ● ● ● ● ● ● ● ● ● ● ● ● ● ● ● ● ● ● ● ● ● ● ● ● ● ● ● ● ● ● ● ● ● ● ● ● ● ● ● ● ● ● ● ● ● ● ● ● ● ● ● ● ● ● ● ● ● ● ● ● ● ● ● ● ● ● ● ● ● ● ● ● ● ● ● ● ● ● ● ● ● ● ● ● ● ● ● ● ● ● ● ● ● ● ● ● ● ● ● ● ● ● ● ● ● ● ● ● ● ● ● ● ● ● ● ● ● ● ● ● ● ● ● ● ● ● ● ● ● ● ● ● ● ● ● ● ● ● ● ● ● ● ● ● ● ● ● ● ● ● ● ● ● ● ● ● ● ● ● ● ● ● ● ● ● ● ● ● ● ● ● ● ● ● ● ● ● ● ● ● ● ● ● ● ● ● ● ● ● ● ● ● ● ● ● ● ● ● ● ● ● ● ● ● ● ● ● ● ● ● ● ● ● ● ● ● ● ● ● ● ● ● ● ● ● ● ● ● ● ● ● ● ● ● ● ● ● ● ● ● ● ● ● ● ● ● ● ● ● ● ● ● ● ● ● ● ● ● ● ● ● ● ● ● ● ● ● ● ● ● ● ● ● ● ● ● ● ● ● ● ● ● ● ● ● ● ● ● ● ● ● ● ● ● ● ● ● ● ● ● ● ● ● ● ● ● ● ● ● ● ● ● ● ● ● ● ● ● ● ● ● ● ● ● ● ● ● ● ● ● ● ● ● ● ● ● ● ● ● ● ● ● ● ● ● ● ● ● ● ● ● ● ● ● ● ● ● ● ● ● ● ● ● ● ● ● ● ● ● ● ● ● ● ● ● ● ● ● ● ● ● ● ● ● ● ● ● ● ● ● ● ● ● ● ● ● ● ● ● ● ● ● ● ● ● ● ● ● ● ● ● ● ● ● ● ● ● ● ● ● ● ● ● ● ● ● ● ● ● ● ● ● ● ● ● ● ● ● ● ● ● ● ● ● ● ● ● ● ● ● ● ● ● ● ● ● ● ● ● ● ● ● ● ● ● ● ● ● ● ● ● ● ● ● ● ● ● ● ● ● ● ● ● ● ● ● ● ● ● ● ● ● ● ● ● ● ● ● ● ● ● ● ● ● ● ● ● ● ● ● ● ● ● ● ● ● ● ● ● ● ● ● ● ● ● ● ● ● ● ● ● ● ● ● ● ● ● ● ● ● ● ● ● ● ● ● ● ● ● ● ● ● ● ● ● ● ● ● ● ● ● ● ● ● ● ● ● ● ● ● ● ● ● ● ● ● ● ● ● ● ● ● ● ● ● ● ● ● ● ● ● ● ● ● ● ● ● ● ● ● ● ● ● ● ● ● ● ● ● ● ● ● ● ● ● ● ● ● ● ● ● ● ● ● ● ● ● ● ● ● ● ● ● ● ● ● ● ● ● ● ● ● ● ● ● ● ● ● ● ● ● ● ● ● ● ● ● ● ● ● ● ● ● ● ● ● ● ● ● ● ● ● ● ● ● ● ● ● ● ● ● ● ● ● ● ● ● ● ● ● ● ● ● ● ● ● ● ● ● ● ● ● ● ● ● ● ● ● ● ● ● ● ● ● ● ● ● ● ● ● ● ● ● ● ● ● ● ● ● ● ● ● ● ● ● ● ● ● ● ● ● ● ● ● ● ● ● ● ● ● ● ● ● ● ● ● ● ● ● ● ● ● ● ● ● ● ● ● ● ● ● ● ● ● ● ● ● ● ● ● ● 0 10 20 30 40 50 0 10 20 30 40 50 (c) L = 100 , L/ N = 0 . 36 ( 50 × 50 grid) Figure 4: Examples of simulations used to generate Figure 3 . (a) and (b) sho w low density treatments on small and large grids, while (c) sho ws high density treatments on a grid of equal size to (a). Estimation accuracy was best for (b), then (a), and worst for (c). Each treatment caused 1.5 outcomes on av erage, and P i θ i / P i Y i = 0 . 7 in e xpectation. ● ● ● ● 0.00 0.25 0.50 0.75 1.00 W basic 0 1 2 d max, K Estimated Lower Bound for A Actual V alue of A Figure 5: Estimation accuracy (a verage performance and standard errors) in spatial experiments in which the treatment had only a direct effect (i.e., no spillov ers). Estimation either used W basic , or used W spill with d max ,K v aried between 0 (no spillov ers assumed) to 2 (spillov ers up to distance 2 assumed). Experiments in volv ed N = 90 , 000 units placed on a 300 × 300 grid, with L = 50 treatments. P i θ i = 600 and P i Y i = 625 in expectation. 100 simulations per data point. 16 6 Discussion A pplicability of W spill The simulations of Section 5.3 are stylized, and are mainly meant to sho w that in principle, it is possible to rigorously estimate spillovers without placing strong assumptions on the v alidity of the observed network G . Ho we ver , the results also suggest that as a practical method, in v erting the test statistic W spill may ha ve limitations due to the follo wing requirements: 1. The treatments should result in a large number of well-separated clusters of outcomes. If spillov ers are non-existent or v ery small, W basic should be used instead. 2. The kernel smoothing matrix K should be at least some what matched to the form of the spillov ers. Ho w practical are these requirements? W e would not expect the effects of single physical treatment, such as a coupon or advertisement, to resemble the simulations, in which as many as 12 . 5 outcomes were caused per treatment. Howe ver , the condition X i = 1 need not represent a single physical treatment. Instead, it could mean administering the physical treatment to a subset of units in the vicinity of i . For example, the condition X i = 1 could signify that some percentage of all units within some distance to i (or belonging to the same re gion as i ) recei ve the physical treatment. In this manner , it may be possible to design e xperiments in which the outcomes tend to be clustered at some desired intensity . Additionally , the treatment vicinities corresponding to each unit may be used to guide the choice of the kernel smoothing matrix K . Cluster-randomi zed designs, such as the type described abo ve, are likely to be more ef fecti ve for in vestig ating interference-based effects – not only for W spill , b ut for any other estimator as well. Assumption 1 allo ws for a good deal of flexibility in the e xperiment design. For e xample, if a unit belonged to multiple vicinities that were selected for treatment, the experiment protocol could gi ve the unit a higher probability of recei ving the physical treatment, or limit the unit to the same probability as those units in a single treatment vicinity , or e ven disqualify the unit from 17 treatment altogether , as all three design options are allo wed under Assumption 1 . General Usage In this paper , we ha ve considered the problem of estimating the attrib utable ef fect A by a lower bound. Such a lower bound, if it is not v acuously conservati ve, may help in determining whether an experimental treatment had a practically significant ef fect. In returning only a lower bound, we are taking a conservati ve approach to the possibility of errors in the network or spatial model (or the lack of a model in ( 3 ) and W basic ). W e believ e that a conservati ve approach to model misspecification will be desireable in some applications. In addition to estimation of A , one might consider testing the hypothesis that A = P i ( θ i − Y i ) equals zero. Howe ver , under Assumption 1 , A can equal zero only if θ = Y , meaning that the treatment must hav e zero effect on each indi vidual unit. As a definition of “no effect”, this is far more restricti ve than the hypothesis of zero a verage treatment ef fect, which allo ws for individual outcomes to change under treatment so long as the totals remain the same. F or this reason, we recommend that significance tests should not assume Assumption 1 . When interference is present, a better choice for significance testing might be to use the rank-based methods of [ Rosenbaum, 2007 ]. While we ha ve focused on estimation of the attributable effect A , our methods can sometimes also be applied to estimate a version of the average treatment ef fect, which we define as follows. Let θ ft denote the counterfactual outcomes under full treatment, i.e., the outcome if all units were treated and X i = 1 for all i . Let θ fc ≡ θ denote the counterfactual under full control. One definition for the av erage treatment ef fect is AT E = 1 N N X i =1 ( θ ft i − θ fc i ) , which is the dif ference in outcomes between full treatment and full control, a veraged o ver all units. As an example, in Section 5.1 (and with further details in Appendix A ), we report an upper bound on P i θ ft and a lower bound on P i θ fc using ( 3 ) for the data of [ Miguel and Kremer , 2004 ], 18 thus inducing a lower bound on the av erage treatment effect. For binary outcomes, it can be seen that solving ( 5 ) for W basic with 1 − X in place of X and 1 − Y in place of Y is equi valent to estimating a upper bound on 1 − P i θ ft i , which gi ves a lo wer bound on P i θ ft . In principle, ( 25 ) for W spill can also be solved with X and Y transformed in the same manner . Howe ver , the runtime for in verting W spill for this problem will be prohibitiv ely large if P i (1 − Y i ) P i Y i , as was the case in the simulations. As a result, the performance of the relaxation ( 25 ) under this transformation has not been in vestig ated. Future directions and further analysis of [ Miguel and Kremer , 2004 ] In many settings, an observed netw ork G or spatial information might be only a crude proxy to the true underlying social mechanisms. W e hav e shown that it is possible to rigorously use such information to improv e estimates, without making unreasonable assumptions on the generati ve process. Ho wev er , the proposed method needed high signal-to-noise for good performance, and it was not demonstrated on a real data set. F or these reasons, usage of W spill should be regarded as proof-of-concept rather than recommended practice. As a possible direction for future work, we are in vestigating ho w the method of ( 3 ) might be applied to the “effecti ve treatment” estimator discussed in [ Eckles et al., 2014 , Sec. 2.4.3]. This estimator , also discussed in [ Arono w and Samii, 2012 ], was sho wn in [ Eckles et al., 2014 , Thm 2.2] to reduce bias under Assumption 1 , but currently requires a correctly specified exposure model to compute a confidence interval. As this is a very strong assumption, a conserv ativ e estimate similar to ( 3 ) may be of interest. W e describe a special case of this estimator for which ( 3 ) can be seen to apply , in the conte xt of the de worming experiment of [ Miguel and Kremer , 2004 ]. W e grouped 48 of the 50 schools into 16 triplets by order of distance, i.e., the closest three schools were grouped together , then the closest three out of the remaining schools, and so forth. The final 2 schools were remov ed from the analysis. W e declared that a group of schools was treated if at least 2 schools in the 19 group were treated (i.e., if the y receiv ed the de worming treatment). The treated schools in the treated groups were declared to be selected. In this manner , 18 schools belonging to 8 treated groups were selected. Conditioned on the number of treated groups, and the number of selected schools in each group, the distribution of the 18 selected schools equals a two-stage sample [ Thompson, 2012 ], in which the treated groups are selected by sampling without replacement, and then the selected schools are sampled within the treated groups. It follo ws by arguments similar to Section 4.1 that the av erage number of observed infections for the 18 selected schools is a conservati v ely biased point estimate for the per-school infections under full treatment. This v alue equaled 3 . 8 , implying an point estimate of 182 for the total number of infections under full treatment. This is a 33% reduction from the point estimate of 270 that would result from an assumption of no interference, i.e., if all 24 treated schools were av eraged. T o compute a confidence interv al, in principle the method of ( 3 ) can be applied to the selected schools, using the estimated v ariance of a two stage sample in place of ˆ σ . While the small sample size of 8 groups likely in validates the central limit theorem requirements of ( 3 ) 4 , the approach may be applicable in a larger experiment, such as [ Bond et al., 2012 ]. Also, we observe that the point estimate is reminiscent of a U-statistic, since it can be written as a function of all N 3 school triplets and their respecti ve treatments. This suggests further possibilities for ne w estimators. In this preliminary analysis, the spatial information in [ Miguel and Kremer , 2004 ] was used to remov e treated schools from consideration if they were far from other treated schools. This improv ed the point estimate because such schools were more susceptible to reinfection. This is quite dif ferent from the simulations, where well-separated treatments g ave the best estimates. W e conjecture that both types of settings can arise in practice. 4 W e remark that the upper bound found this way for the deworming e xperiment was 297 . This is somewhat less than the estimate of 347 found in Section 5.1 , suggesting at least that the proposed approach will not be vacuously conservati ve. 20 A ppendices A T -test Based Asymptotic Confidence Interv al Solution of ( 3 ) It can be seen that the objecti ve function of ( 3 ) is a function of ˆ θ and ˆ σ 2 , and is increasing in the latter ar gument. Hence, the optimal θ will maximize ˆ σ 2 ov er some lev el set of ˆ θ , which is equiv alent to solving max θ ∈ Z N X i : X i =0 θ 2 i (10) such that X i : X i =0 θ i = c 0 ≤ θ i ≤ Y i for all i, for some value of c . Since c must be an integer between 0 and P i : X i =0 Y i , we can solve ( 10 ) for all possible v alues of c , and then choose the solution that maximizes ( 3 ). T o solve ( 10 ) , let n = N − L and let i 1 , . . . , i n sort the elements of { Y i : X i = 0 } in descending order . It can be seen that ( 10 ) is maximized by letting θ i 1 = min { c, Y i 1 } , and follo wing the recursion θ i j = min ( c − j − 1 X k =1 θ i k , Y i j ) , j = 2 , . . . , n, (11) so that the entries of θ corresponding to the untreated units are “filled up” in decreasing order of Y , i.e., θ i j = 0 unless θ i k = Y i k for k = 1 , . . . , j − 1 . V ariant of ( 3 ) used in [ Miguel and Kremer , 2004 ] T o estimate the number of infections that would occur if all of the schools were treated, we define Y , X , and θ as follo ws. Let Y i denote the number of infections observed in school i . Re versing the definition of X , let X i = 0 denotes 21 that school i recei ves the de worming treatment. Let θ denote the counterfactual outcomes that would occur if X i = 0 for all i . W ith Y , X , and θ thus defined, Assumption 1 , which states that θ ≤ Y , means that treating all of the schools w ould not increase the infection counts o ver the observed v alues. A 95% confidence upper bound on ¯ θ can be found by solving ( 3 ). T o estimate the number of infections that would occur if none of the schools were treated, let Y be defined as before; let X i = 1 denote that school i recei ves de worming treatment; and let θ denote the counterfactual outcome that would occur if no schools recei ve treatment. In place of Assumption 1 , we assume that θ i ≥ Y i , meaning that treating no schools would not reduce the infection counts belo w the observed v alues, and also that θ i ≤ S i , where S i is the total number of students at school i that were measured in the 1999 surv ey . By similar reasoning as ( 3 ) , in order to lo wer bound ¯ θ we can solve min θ ∈ Z N ˆ θ − t α s L N ˆ σ 2 N − L (12) such that Y i ≤ θ i ≤ S i for all i, where ˆ θ and ˆ σ 2 are defined as before. Similar to ( 3 ) , the optimal θ must maximize ˆ σ 2 along a le vel set of ˆ θ , so that max θ ∈ Z N X i : X i =0 θ 2 i (13) such that X i : X i =0 θ i = c Y i ≤ θ i ≤ S i for all i can be solved for dif ferent v alues of c to find the optimal θ . The optimization problem ( 13 ) can be formulated and solved as a dynamic programming problem. Generically , a simplified version of a dynamic program in volv es choosing a sequence 22 of discrete decision variables u 1 , . . . , u T , so as to control a sequence of state variables s 0 , . . . , s T , where the initial state s 0 is giv en and s t = f t ( s t − 1 , u t ) for t = 1 , . . . , T and some set of functions f 1 , . . . , f T which model the state dynamics. A reward g ( u t ) is paid for each decision, and an final re ward G ( s T ) is paid based on the final state. The goal is to choose u 1 , . . . , u T to maximize G ( s T ) + P t g ( u t ) , thereby steering towards a high reward final state while also maintaining high re wards for each decision. A canonical algorithm to solv e this problem is v alue iteration [ Bertsekas et al., 1995 ], which is also called backwards induction or Bellman’ s equation. T o formulate ( 13 ) as a dynamic programming problem, let T = n and let the decisions u 1 , . . . , u T equal θ i 1 , . . . , θ i n . Let g ( u t ) = u 2 t , so that P t g ( u t ) equals the objectiv e of ( 13 ) . Let s 0 = 0 , and let s t = s t − 1 + u t , so that s T = P t u t , which equals P i : X i =0 θ i . Let the final re ward G ( s T ) equal 0 if s T = c , and −∞ otherwise, thus enforcing the constraint that P i : X i =0 θ i = c . B Estimation Using W basic Solution of ( 5 ) for W basic For W = W basic , the α -le vel critical value of W is a function of P i θ i , since W is a Hyp ergeometric( P i θ i , N − P i θ i , L ) random v ariable. Let w α ( P i θ i ) denote the α -lev el critical v alue of W . It follows that ( 5 ) can be re written as max θ ∈{ 0 , 1 } N N X i =1 θ i such that X i : X i =1 θ i ≤ w α N X i =1 θ i ! (14) X i : X i =1 θ i ≤ X i : X i =1 Y i (15) X i : X i =0 θ i ≤ X i : X i =0 Y i ., (16) where ( 15 ) and ( 16 ) are consequences of θ ≤ Y . This optimization problem depends only the quantities P i : X i =1 θ i and P i : X i =0 θ i . As these quantities are integer v alued and bounded abov e 23 and belo w , their optimal v alues can be easily found by e xhaustiv e search. Solution of ( 6 ) f or W basic For W = W basic , the optimization problem ( 6 ) can be re written as abov e, b ut with constraint ( 15 ) remov ed. This removes the upper bound on P i : X i =1 θ i . Howe ver , since P i : X i =1 θ i ≤ P i X i , an upper bound still exists, so the optimal solution may be found by exhausti ve search as before. C Estimation Using W spill For W = W spill , the solution of of the optimization problem ( 5 ) is computationally hard. W e present a conserv ativ e approximation of ( 5 ) that yields a lar ger confidence interval for A . The main steps of the approximation are to bound the critical v alue w α ( θ ) using a simpler expression, and to enclose the feasible region of ( 5 ) by linear inequalities. Preliminaries W e will require the follo wing basic identities. It can be seen that W spill ( X ; θ ) equals the a verage of L samples drawn without replacement from the vector K θ . Because the columns of K sum to one, it holds that E W spill ( X ; θ ) = 1 N N X i =1 θ i , (17) where we note that the expectation E ≡ E X is taken o ver the random treatment X . Let u denote a unit sampled uniformly from 1 , . . . , N . Let 1 u ∈ { 0 , 1 } N denote the indicator function returning 1 for unit u and 0 else where. It follows that W spill (1 u ; θ ) is equal in distribution to W spill ( X ; θ ) for L = 1 . F or all L , it holds that E W spill ( X ; θ ) = E u W spill (1 u ; θ ) (18) V ar W spill ( X ; θ ) = N − L L ( N − 1) E u W spill (1 u ; θ ) 2 − [ E u W spill (1 u ; θ )] 2 , (19) 24 where ( 19 ) follo ws from basic properties of simple random sampling [ Thompson, 2012 , Eq. 2.5]. A pproximation of ( 5 ) By Chebyche v’ s inequality , it holds for any choice of W that P W ( X ; θ ) − E W ( X ; θ ) (V ar W ( X ; θ )) 1 / 2 ≥ α − 1 / 2 ! ≤ α . (20) This is a highly conserv ati ve bound, but we use it here for simplicity and defer impro vements for later discussion. Analogous to ( 5 ) , a one-sided (1 − α ) confidence interv al for P i θ i is giv en by max θ ∈{ 0 , 1 } N 1 N N X i =1 θ i (21) such that W ( X ; θ ) − E W ( X ; θ ) (V ar W ( X ; θ )) 1 / 2 ≤ α − 1 / 2 θ i ≤ Y i for all i. T o re write this problem with a smaller number of decision v ariables, let m ( y ) ∈ R 3 denote the vector gi ven by m 1 ( θ ) = E u W (1 u ; θ ) , m 2 ( θ ) = W ( X ; θ ) , and m 3 ( θ ) = E W (1 u ; θ ) 2 . Let M = { m ( θ ) : θ ≤ Y } denote the set of all achiev able values for m ( θ ) . Equating terms and using ( 17 )-( 19 ), the optimization problem ( 21 ) can be restated as max m ∈ R 3 m 1 (22) such that m 2 − m 1 ( m 3 − m 2 1 ) 1 / 2 ≤ αL N − 1 N − L − 1 / 2 m ∈ M . 25 While this optimization problem has only 3 decision variables, it is hard to optimize because the constraint m ∈ M is dif ficult to check. As a relaxation, we will replace the constraint m ∈ M by a weaker constraint m ∈ P , where P is a polyhedron that contains M , and which can be represented by a tractable number of linear inequalities. Let f ∗ ( λ ) denote the maximum inner product between λ ∈ R 3 and m ( θ ) ∈ M : f ∗ ( λ ) = max θ ∈{ 0 , 1 } N λ T m ( θ ) such that θ ≤ Y . Gi ven a set Λ ⊂ R 3 , let P Λ denote the set { m : λ T m ≤ f ∗ ( λ ) for all λ ∈ Λ } . Since λ T m ≤ f ∗ ( λ ) for all m ∈ M , it follo ws that P Λ contains M . Hence the follo wing optimization problem upper bounds ( 22 ), yielding a conserv ativ e confidence interval: max m ∈ R 3 m 1 (23) such that m 2 − m 1 ( m 3 − m 2 1 ) 1 / 2 ≤ αL N − 1 N − L − 1 / 2 λ T m ≤ f ∗ ( λ ) , ∀ λ ∈ Λ . This optimization problem is low dimensional. As a result, it can be practically solved by a grid-based search ov er the feasible region, pro vided that f ∗ ( λ ) is kno wn for all λ ∈ Λ . Computation of f ∗ ( λ ) T o solve ( 23 ) , we must compute f ∗ ( λ ) for all λ ∈ Λ . F or W = W spill , it holds by the follo wing identities, E u W spill (1 u ; θ ) = 1 T K θ N , E u W spill (1 u ; θ ) 2 = θ T K T K θ N , and W ( X ; θ ) = X T K θ L , 26 that we may write f ∗ ( λ ) as f ∗ ( λ ) = max θ ∈{ 0 , 1 } N λ 1 1 T K θ N + λ 2 X T K θ L + λ 3 θ T K T K θ N , (24) such that θ i ≤ Y i for all i. For nonne gati ve K and λ 3 , ( 24 ) can be transformed into a canonical optimization problem of finding an “ s - t min cut” in a graph. The transformation, described in Appendix D , w as originally proposed in [ Greig et al., 1989 ] for image denoising. After the transformation, the min cut problem can be solved by linear programming or the F ord-Fulkerson algorithm, which runs in O ( n 3 ) time where n = P i Y i . [ Papadimitriou and Steiglitz, 1998 ] Selection of Λ Figure 6 giv es a geometric picture of the role of M and P Λ in determining the feasible region of ( 23 ) . The set Λ must satisfy λ 3 ≥ 0 for all λ ∈ Λ , since f ∗ ( λ ) cannot be ef ficiently computed otherwise. By definition, each half-space H λ = { m : λ T m ≤ f ∗ ( λ ) } equals a supporting hyperplane of the set M in the direction λ k λ k . This implies that H λ = H cλ when c is a positiv e scalar . As a result, a reasonable strate gy is to choose Λ to cov er the allow able directions { λ : k λ k = 1 , λ 3 ≥ 0 } as densely as possible, so that P Λ approximates the con vex hull of M in those directions. Reducing conservati veness Chebyche v’ s inequality gi ves a very conserv ati ve approximation to the critical value of the test statistic. Because W spill ( X ; θ ) is a sample av erage, a normal approximation may yield a better estimate of its critical v alue. That is, it may hold that P W spill ( X ; θ ) − E W spill ( X ; θ ) (V ar W spill ( X ; θ )) 1 / 2 ≥ z α ! ≈ α , 27 m 3 λ m 1 m T λ = f ∗ ( λ ) (a) M and m T λ = f ∗ ( λ ) m 3 m 1 (b) P Λ m 3 m 1 m 3 ≥ m 2 1 (c) P Λ ∩ { m 3 ≥ m 2 1 } Figure 6: Cartoon depiction of ( 23 ) , showing dimensions m 1 and m 3 only . (a) shows M (as dots), and a supporting hyperplane in a direction λ . (b) sho ws P Λ (as shaded re gion), which may equal the con ve x hull of M in all directions λ satisfying λ 3 ≥ 0 . (c) sho ws the intersection of P Λ and the constraint m 3 ≥ m 2 1 . This constraint is implicit in ( 23 ) , since otherwise ( m 3 − m 2 1 ) − 1 / 2 would not be real-v alued. where z α is the upper critical value of a standard normal. Using this approximation leads to the follo wing optimization problem max m ∈ R 3 m 1 (25) such that m 2 − m 1 ( m 3 − m 2 1 ) 1 / 2 ≤ z α L − 1 / 2 λ T m ≤ f ∗ ( λ ) , ∀ λ ∈ Λ . Summary of method Gi ven binary observations Y , treatment assignment X , and network information G , the method entails the follo wing steps: 1. Choose a smoothing matrix K , for example by choosing values of d max ,K and σ K . 2. Choose a set Λ ⊂ R 3 such that λ 3 ≥ 0 for all λ ∈ Λ . This will ultimately induce the set P which relaxes the actual feasible re gion. 3. For each λ ∈ Λ , compute f ∗ ( λ ) by solving ( 24 ) . The solution of ( 24 ) is discussed in Appendix D . 28 4. Solve ( 23 ) or ( 25 ) to the desired lev el of precision. This is done by discretizing the feasible region of ( 23 ) or ( 25 ) along a grid, and checking e very grid point. Because the objectiv e is linear and the feasible region is 3-dimensional, the number of grid points that must be checked increases cubically with the desired precision. The best solution is an upper bound on P i θ i , up to the precision of the grid search. D T ransf ormation of f ∗ ( λ ) to min-cut pr oblem Gi ven a nonnegati ve matrix A ∈ R d × d with zero diagonal, and s, t ∈ 1 , . . . , d , the s-t min cut problem is min x ∈{ 0 , 1 } d X i 6 = j A ij x i (1 − x j ) (26) such that x s = 1 , x t = 0 . The interpretation of ( 26 ) is that A denotes a weighted adjacency matrix of a network, and x di vides the nodes 1 , . . . , d into two groups, with s and t in separate groups, so as to minimize the sum of the weighted edges that are “cut” by the di vision. This problem is polynomially solvable by the Ford-Fulkerson algorithm and also by linear programming [ Papadimitriou and Steiglitz, 1998 ]. T o transform f ∗ ( λ ) into the form of ( 26 ), we observ e that f ∗ ( λ ) = max θ ∈{ 0 , 1 } N λ 1 1 T K θ N + λ 2 X T K θ L + λ 3 θ T K T K θ N , such that θ i ≤ Y i for all i, may be re written as max x ∈{ 0 , 1 } d x T M x + b T x + c, 29 for some d > 0 , b ∈ R d , c ∈ R , and nonnegati ve matrix M , where the decision variable x corresponds to the free elements in y , i.e., those in { i : Y i = 1 } . F ollowing [ Greig et al., 1989 ], we transform this to a min-cut problem by observing that x T M x + b T x = − X i,j ( M ij x i (1 − x j ) − M ij x i ) + X i b i x i = − X i 6 = j M ij x i (1 − x j ) + X i x i b i + X j M ij ! . (27) Let γ i = b i + P j M ij . Then maximizing ( 27 ) is equiv alent to max x ∈{ 0 , 1 } d − X i 6 = j M ij x i (1 − x j ) − X i : γ i ≥ 0 | γ i | (1 − x i ) + X i : γ i < 0 | γ i | x i . (28) Let s = d + 1 , t = d + 2 , and let x s = 1 , x t = 0 . W e can rewrite ( 28 ) as max x ∈{ 0 , 1 } d − X i 6 = j M ij x i (1 − x j ) − X i : γ i ≥ 0 | γ i | (1 − x i ) x s + X i : γ i < 0 | γ i | x i (1 − x t ) , which can be re written as ( 26 ) for some nonnegati ve A ∈ R d +2 × d +2 with zero diagonal. Refer ences [Aral and W alker , 2011] Aral, S. and W alker , D. (2011). Creating social contagion through viral product design: A randomized trial of peer influence in networks. Management Science , 57(9):1623–1639. [Arono w and Samii, 2012] Arono w , P . M. and Samii, C. (2012). Estimating av erage causal ef- fects under general interference. In Summer Meeting of the Society for P olitical Methodology , University of North Car olina, Chapel Hill, J uly , pages 19–21. 30 [Bertsekas et al., 1995] Bertsekas, D. P ., Bertsekas, D. P ., Bertsekas, D. P ., and Bertsekas, D. P . (1995). Dynamic pr ogramming and optimal contr ol , volume 1. Athena Scientific Belmont, MA. [Bloznelis, 1999] Bloznelis, M. (1999). A berry-esseen bound for finite population student’ s statistic. Annals of pr obability , pages 2089–2108. [Bond et al., 2012] Bond, R. M., Fariss, C. J., Jones, J. J., Kramer, A. D., Marlow , C., Settle, J. E., and Fo wler , J. H. (2012). A 61-million-person experiment in social influence and political mobilization. Natur e , 489(7415):295–298. [Eckles et al., 2014] Eckles, D., Karrer , B., and Ugander , J. (2014). Design and analysis of experiments in netw orks: Reducing bias from interference. arXiv pr eprint arXiv:1404.7530 . [Gelman, 2011] Gelman, A. (2011). Why it doesn’t make sense in general to form confidence interv als by in verting hypothesis tests. http://andrewgelman.com/2011/08/25/ why_it_doesnt_m/ . Accessed: 2015-10-02. [Greig et al., 1989] Greig, D., Porteous, B., and Seheult, A. H. (1989). Exact maximum a posteriori estimation for binary images. J ournal of the Royal Statistical Society . Series B (Methodological) , pages 271–279. [Halloran and Struchiner , 1995] Halloran, M. E. and Struchiner , C. J. (1995). Causal inference in infectious diseases. Epidemiology , pages 142–151. [Hudgens and Halloran, 2008] Hudgens, M. G. and Halloran, M. E. (2008). T ow ard causal inference with interference. Journal of the American Statistical Association , 103(482). [Kramer et al., 2014] Kramer , A. D. I., Guillory , J. E., and Hancock, J. T . (2014). Experimental e vidence of massiv e-scale emotional contagion through social networks. Pr oceedings of the National Academy of Sciences , 111(24):8788–8790. 31 [Liu and Hudgens, 2013] Liu, L. and Hudgens, M. G. (2013). Large sample randomization inference of causal ef fects in the presence of interference. Journal of the American Statistical Association , (just-accepted). [Luo et al., 2012] Luo, X., Small, D. S., Li, C.-S. R., and Rosenbaum, P . R. (2012). Inference with interference between units in an fmri experiment of motor inhibition. Journal of the American Statistical Association , 107(498):530–541. [Manski, 2013] Manski, C. F . (2013). Identification of treatment response with social interac- tions. The Econometrics Journal , 16(1):S1–S23. [Miguel and Kremer , 2004] Miguel, E. and Kremer , M. (2004). W orms: identifying impacts on education and health in the presence of treatment externalities. Econometrica , pages 159–217. [Nickerson, 2008] Nickerson, D. W . (2008). Is voting contagious? e vidence from two field experiments. American P olitical Science Review , 102(01):49–57. [Ogburn and V anderW eele, 2014] Ogburn, E. L. and V anderW eele, T . J. (2014). V accines, contagion, and social networks. arXiv pr eprint arXiv:1403.1241 . [Papadimitriou and Steiglitz, 1998] Papadimitriou, C. H. and Steiglitz, K. (1998). Combinato- rial optimization: algorithms and comple xity . Courier Dov er Publications. [Rosenbaum, 2001] Rosenbaum, P . R. (2001). Effects attributable to treatment: Inference in experiments and observ ational studies with a discrete pi vot. Biometrika , 88(1):219–231. [Rosenbaum, 2007] Rosenbaum, P . R. (2007). Interference between units in randomized exper- iments. Journal of the American Statistical Association , 102(477). [Rubin, 1990] Rubin, D. B. (1990). Comment: Ne yman (1923) and causal inference in experi- ments and observ ational studies. Statistical Science , 5(4):472–480. 32 [Sobel, 2006] Sobel, M. E. (2006). What do randomized studies of housing mobility demon- strate? causal inference in the face of interference. J ournal of the American Statistical Association , 101(476):1398–1407. [Sweet et al., 2013] Sweet, T . M., Thomas, A. C., and Junk er , B. W . (2013). Hierarchical net- work models for education research hierarchical latent space models. J ournal of Educational and Behavior al Statistics , 38(3):295–318. [Tchetgen and V anderW eele, 2012] Tchetgen, E. J. T . and V anderW eele, T . J. (2012). On causal inference in the presence of interference. Statistical Methods in Medical Resear ch , 21(1):55–75. [Thompson, 2012] Thompson, S. K. (2012). Sampling . W iley . [T oulis and Kao, 2013] T oulis, P . and Kao, E. (2013). Estimation of causal peer influence ef fects. In Pr oceedings of The 30th International Confer ence on Machine Learning , pages 1489–1497. [Ugander et al., 2013] Ugander , J., Karrer , B., Backstrom, L., and Kleinberg, J. (2013). Graph cluster randomization: network e xposure to multiple univ erses. arXiv pr eprint arXiv:1305.6979 . 33
Original Paper
Loading high-quality paper...
Comments & Academic Discussion
Loading comments...
Leave a Comment