Visualization techniques for the developing chicken heart
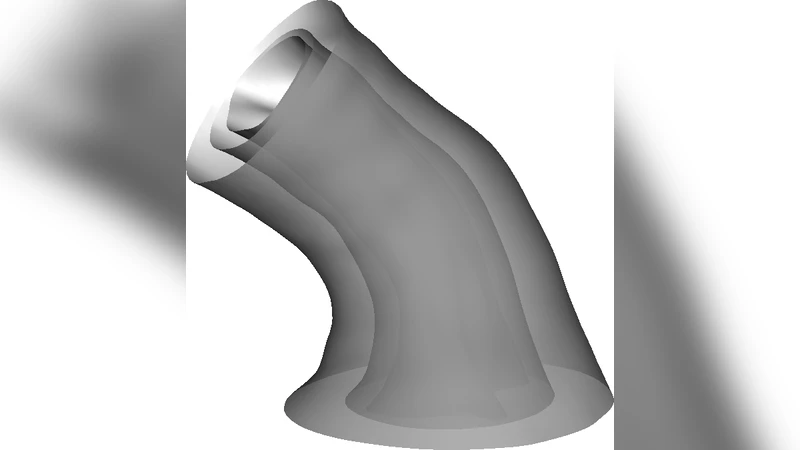
We present a geometric surface parameterization algorithm and several visualization techniques adapted to the problem of understanding the 4D peristaltic-like motion of the outflow tract (OFT) in an embryonic chick heart. We illustrated the techniques using data from hearts under normal conditions (four embryos), and hearts in which blood flow conditions are altered through OFT banding (four embryos). The overall goal is to create quantitative measures of the temporal heart-shape change both within a single subject and between multiple subjects. These measures will help elucidate how altering hemodynamic conditions changes the shape and motion of the OFT walls, which in turn influence the stresses and strains on the developing heart, causing it to develop differently. We take advantage of the tubular shape and periodic motion of the OFT to produce successively lower dimensional visualizations of the cardiac motion (e.g. curvature, volume, and cross-section) over time, and quantifications of such visualizations.
💡 Research Summary
The paper introduces a comprehensive framework for quantifying and visualizing the four‑dimensional (3D + time) motion of the outflow tract (OFT) in embryonic chicken hearts. Using optical coherence tomography (OCT), the authors acquired 4D image volumes of HH18 stage embryos (≈3 days of incubation) and extracted three surface meshes—outer myocardium, inner myocardium, and the lumen wall—at 195 time points across a single cardiac cycle, yielding 585 meshes per embryo. Two experimental groups were studied: four normal controls and four embryos subjected to OFT banding, a surgical procedure that constricts the tube, raises intraventricular pressure, and alters blood‑flow dynamics.
A central technical contribution is a “geodesic parameterization” algorithm tailored to tubular biological structures. By defining a longitudinal (u) and circumferential (v) coordinate system, the method minimizes changes in surface geodesics across time, ensuring that a given (u, v) pair tracks the same physical point throughout the cardiac cycle. This overcomes the limitations of conventional conformal or area‑preserving mappings, which cannot handle the simultaneous lengthening, shortening, and radial deformation characteristic of the OFT.
Once a consistent parameterization is established, the authors map surface attributes—curvature, area, volume—onto 2‑D image domains. They present several low‑dimensional visualizations: (1) an unfolded tube colored by mean or maximum curvature, animated over time; (2) cross‑sectional profiles at regularly spaced positions, plotted as contour area or perimeter versus time; (3) derivative fields that reveal local velocity and acceleration, illustrating how the peristaltic contraction wave propagates along the tube; and (4) integrated volume curves for the whole tube and for sub‑segments (proximal, middle, distal). These visualizations reduce the complexity of the original data while preserving the essential spatiotemporal dynamics.
Quantitative analysis shows that normal embryos contract the OFT by roughly 30 % on average, with the contraction wave traveling from the ventricular to the aortic end at about 1.2 mm /ms. In banded embryos, overall contraction amplitude drops below 15 %, and the distal segment exhibits a markedly slower wave speed (≈0.6 mm /ms). Moreover, the normal elliptical deformation of the lumen cross‑section is attenuated by ~40 % in banded hearts, indicating that increased resistance suppresses the outward bulging of endocardial cushions. These findings link altered hemodynamics to specific mechanical changes in the tube wall, providing a mechanistic explanation for the downstream cardiac malformations observed after banding.
The authors claim three major contributions: (1) a robust, tube‑specific surface parameterization that enables consistent temporal tracking; (2) a suite of visualization techniques that translate high‑dimensional, time‑varying surface data into intuitive 2‑D images and plots; and (3) a set of quantitative metrics that allow direct comparison between normal and flow‑perturbed hearts. The framework is demonstrated on a modest dataset (four controls, four banded embryos) but is scalable to larger cohorts and to other tubular organs. Future work is suggested to integrate biomechanical simulations, expand the range of flow‑alteration models, and explore statistical shape analysis across developmental stages.
Comments & Academic Discussion
Loading comments...
Leave a Comment