Opinion mining from twitter data using evolutionary multinomial mixture models
Image of an entity can be defined as a structured and dynamic representation which can be extracted from the opinions of a group of users or population. Automatic extraction of such an image has certain importance in political science and sociology r…
Authors: Md. Abul Hasnat, Julien Velcin, Stephane Bonnevay
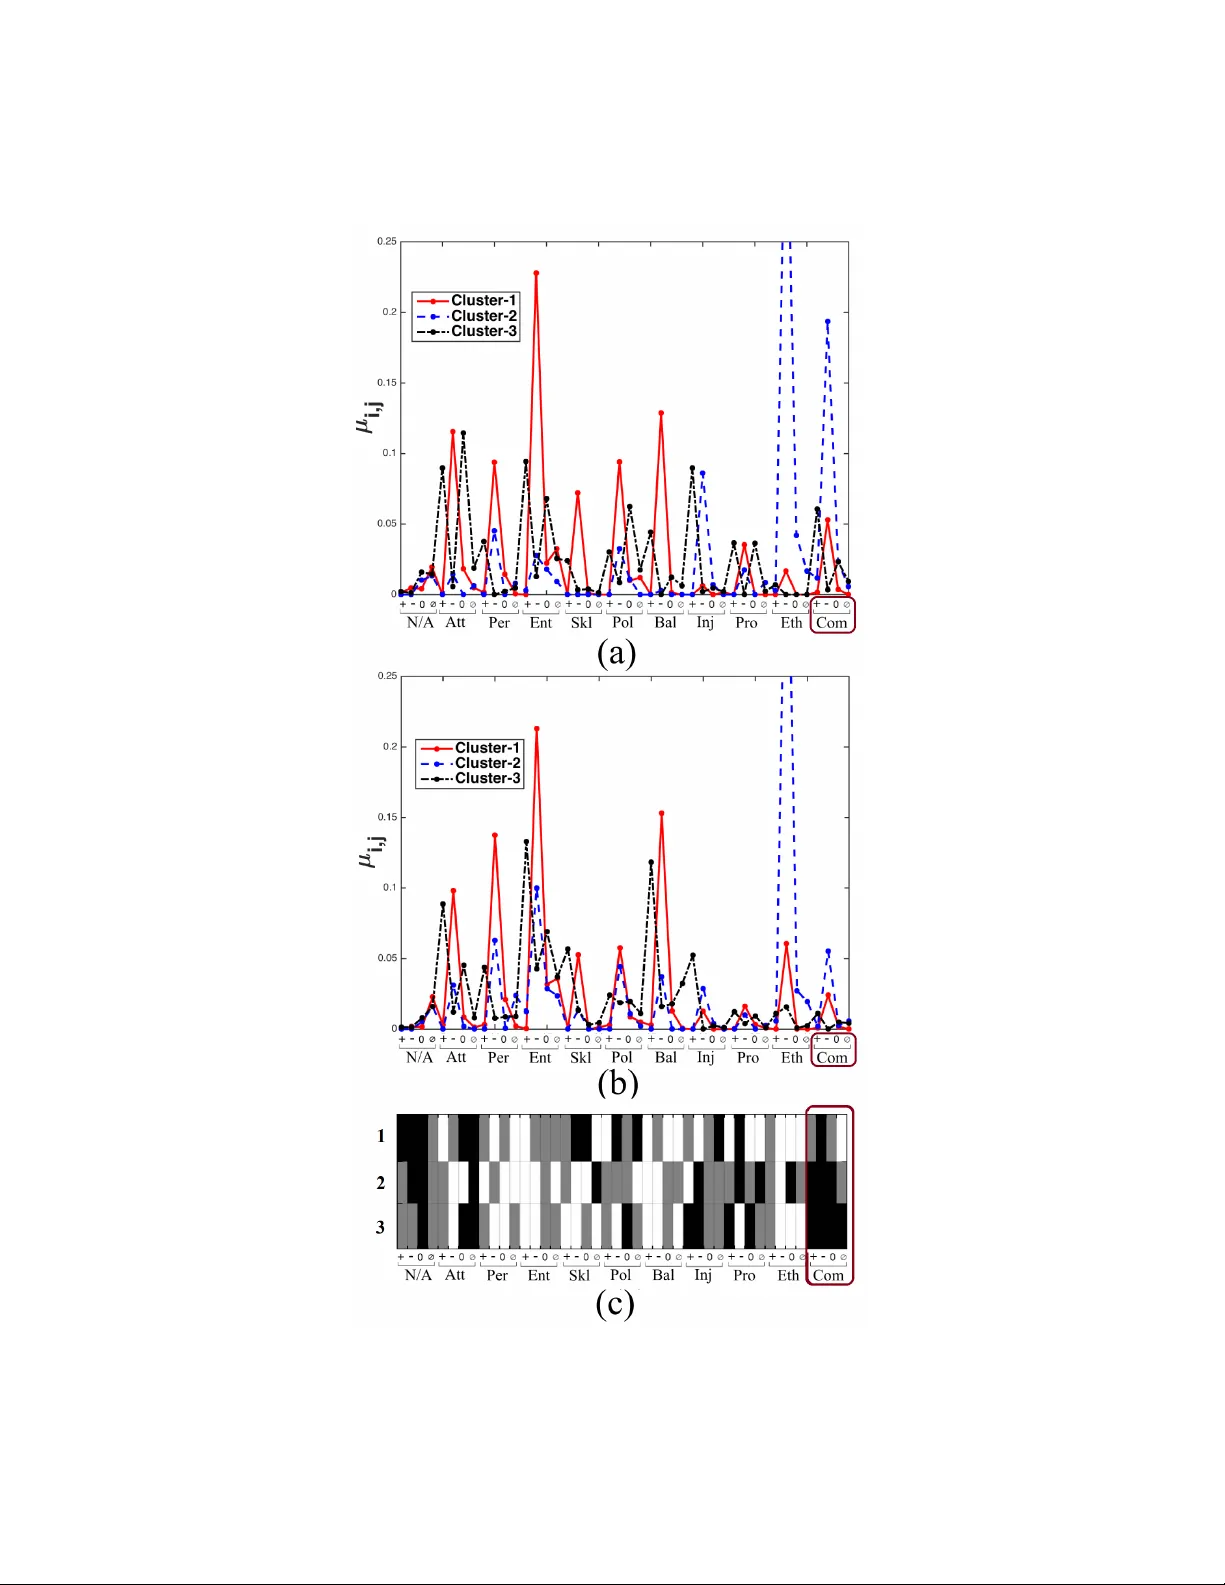
Submitte d to the Annals of Applie d Statistics OPINION MINING FR OM TWITTER D A T A USING EV OLUTIONAR Y MUL TINOMIAL MIXTURE MODELS L ab or atoir e ERIC, Universit ´ e de Lyon - Lumi ` er e ∗ By Md. Abul Hasna t ∗ , Julien Velcin ∗ , Stephane Bonnev a y ∗ and Julien Ja cques ∗ Image of an entit y can be defined as a structured and dynamic represen tation which can b e extracted from the opinions of a group of users or p opulation. Automatic extraction of such an image has certain importance in p olitical science and so ciology related studies, e.g., when an extended inquiry from large-scale data is required. W e study the images of t wo politically significant en tities of F rance. These images are constructed by analyzing the opinions collected from a w ell known so cial media called Twitter . Our goal is to build a system whic h can be used to automatically extract the image of entities ov er time. In this paper, we propose a nov el evolutionary clustering metho d based on the parametric link among Multinomial mixture mo dels. First w e prop ose the form ulation of a generalized mo del that estab- lishes parametric links among the Multinomial distributions. After- w ard, w e follo w a mo del-based clustering approach to explore dif- feren t parametric sub-mo dels and select the b est model. F or the ex- p erimen ts, first we use synthetic temp oral data. Next, we apply the metho d to analyze the annotated so cial media data. Results show that the prop osed metho d is b etter than the state-of-the-art based on the common ev aluation metrics. Additionally , our method can pro vide interpretation ab out the temp oral ev olution of the clusters. 1. In tro duction. W e define an image as a multi-faceted representa- tion that aggregates a set of opinions or general impressions regarding an en tit y . By entit y , w e mean a p olitician, a celebrit y , a compan y , a brand, etc. In this research, w e are particularly interested to use annotated so- cial media data to extract the image of t wo F rench politicians and observ e its c hanges/ev olution ov er time. W e consider the annotated data from the ImagiWeb pro ject ( V elcin et al. , 2014 ) which are extracted b efore and after the 2012 F rench presiden tial election. The annotation pro vides a compact and meaningful representation for each tw eet. Our goal is to develop a tem- p oral/ev olutionary clustering tec hnique, which groups the annotated opin- ions and then extracts the image of an entit y ov er time from the clustering results. Subsequen tly , we wan t to explain/interpret the temp oral c hanges of the image created from eac h group of users. 1 2 HASNA T ET AL. In the recent years, the so cial media pla ys a significant role in many asp ects of our daily activit y . There exist numerous p opular so cial media suc h as Twitter or F aceb o ok, where the users (p eople) often pro vide their opinions ab out particular entit y , e.g., p ersons (p olitician, actor), pro ducts consumed in the daily life, etc. A common metho d to analyze such data is to use a clustering metho d that naturally groups the users/opinions, and then inv estigate eac h group indep enden tly . An imp ortant prop erty of these data is that they ma y change over time due to changes of the attributes, and appearance/disapp earance of users. Moreo ver, users ma y change their opinion ab out the targeted en tity . An ordinary clustering metho d is unlikely to adapt with suc h temp o- ral dynamics of the data, as it does not consider any relev an t information suc h as history and temp oral effects. The notion of ev olutionary clustering ( Chakrabarti, Kumar and T omkins , 2006 ; Xu, Kliger and Hero Iii , 2014 ; Chi et al. , 2009 ; Xu et al. , 2012 ) app ears in such situations, where the metho d should b e specialized in clustering temp oral data by taking care of the historic information and current data altogether. Numerous metho ds exist, whic h address these issues appropriately and cluster temp oral data. These metho ds are based on different strategies, such as sp ectral clustering ( Chi et al. , 2009 ; Xu, Kliger and Hero Iii , 2014 ) and probabilistic gener- ativ e mo del ( Blei and Lafferty , 2006 ; Xu et al. , 2012 ; Kim et al. , 2015 ). Ho w ever, it remains an imp ortan t issue - how to in terpret the evolution of the clusters. In this research, we are motiv ated by this issue and prop ose a no v el metho d based on the Multinomial mixture mo del ( Bishop et al. , 2006 ) to cluster the temp oral data as w ell as interpret the evolution of the clusters through some prior b elief. Therefore, we prop ose a no v el metho d whic h sim ultaneously p erforms ev olutionary clustering and interpreting the ev olution. Multinomial Mixture (MM) mo del based clustering strategy is a p opular metho d for clustering discrete data ( Meil˘ a and Heck erman , 2001 ; Silv estre, Cardoso and Figueiredo , 2014 ; Hasnat, Alata and T r ´ emeau , 2015 ; Agresti , 2002 ). Most recen tly , it has b een exploited to p erform evolutionary clustering ( Kim et al. , 2015 ). In this researc h, w e consider MM as the core model for the data and prop ose an ev olutionary clustering metho d b y deriving appropriate link b etw een the parameters of MM at different time. P arametric link among probability distributions has been used in the con- text of transfer learning ( Biernacki, Beninel and Bretagnolle , 2002 ; Jacques and Biernacki , 2010 ; Beninel et al. , 2012 ), where the goal is to adapt a clustering mo del from a source population to a target one. In the con text of contin uous features, Biernac ki, Beninel and Bretagnolle ( 2002 ) prop osed OPINION MINING FROM TWITTER DA T A 3 a parametric link b etw een the Normal distributions. Jacques and Biernacki ( 2010 ) extended it for the binary features using Bernoulli distribution. How- ev er, no such formulation exists for the Multinomial distribution. Moreov er, suc h parametric link-based metho ds are never considered in the context of ev olutionary clustering. This researc h addresses b oth of these issues. This research proposes a no vel ev olutionary clustering metho d for extract- ing image of political en tities. The highligh ts of our con tributions include: (a) prop ose a formulation for a parametric link among Multinomial distri- butions; (b) dev elop a nov el evolutionary clustering metho d by exploiting the link parameters and (c) provide interpretation of the link parameters to interpret cluster ev olutions. First, w e use synthetic data to ev aluate and compare the prop osed metho d w.r.t. the state-of-the-art metho ds. Next, w e apply it to analyze the temp oral dynamics of so cial media data obtained from the ImagiWeb pro ject ( V elcin et al. , 2014 ). Results in Sec. 4 show that the prop osed metho d is b etter than the state-of-the-art metho ds. In the rest of the pap er, we present the data in Sec. 2 , describ e our prop osed metho d in Sec. 3 , present the exp erimental results in Sec. 4 , pro vide analysis of the p olitical data in Sec. 5 , and finally draw conclusions in Sec. 6 . 2. The Imagiw eb pro ject and the p olitical opinion dataset. W e collected data from the p olitic al opinion dataset of the ImagiW eb 1 (IW- POD) pro ject, see V elcin et al. ( 2014 ) for further details of data collec- tion, relev ant statistics and represen tation. IW-POD consists of manually annotated tw eets, from May 2012 to Jan uary 2013, related to tw o F rench p oliticians: F rancois Hollande (FH) and Nicolas Sark ozy (NS). First, these t w eets are annotated in to 11 different asp ects, such as A ttribute (Att), Per- son (P er), En tit y (En t), Skills (Skl), Political line (Pol), Balance (Bal), In- junction (Inj), Pro jet (Pro), Ethic (Eth), Communication (Com) and No asp ect detected (N/A). Afterward, each asp ect is annotated with 6 opin- ion p olarities, such as v ery negativ e (-2), negative (-1), no polarity (0), Null, p ositiv e (+1) and v ery positive (+2). F or example, the t w eet - Sarko is mor e r ational (orig: Sarko est plus r ationnel) is annotated with the asp ect called Person and p olarity +1. It is ab out NS and indicates that the user pro vides p ositiv e opinion with an emphasis on the p ersonal attribute. Another exam- ple, the tw eet - Nic olas Sarkozy, the worst pr esident of the Fifth R epublic (Orig: Nic olas Sarkozy, le plus mauvais pr´ esident de la V` eme R ´ epublique) is annotated with the asp ect called Skil l and p olarity − 1. It is a negativ e opinion ab out NS and indicates that the user emphasizes on the skill of NS. 1 h ttp://mediamining.univ-lyon2.fr/v elcin/imagiw eb/dataset.html 4 HASNA T ET AL. In order to use these tw eets for clustering, they are regroup ed within the sp ecified time ep o ch. Moreov er, similar p olarities are merged, e.g., tw o p ositiv es (+1 and +2) are merged into one as only p ositive (+). Therefore, eac h asp ect consits of four p olarities, such as p ositiv e (+), negative (-), zero (0) and undefined/null ( ∅ ). As a consequence, finally eac h regroup ed t w eet represen ts the opinion of an user ab out a particular politician which is a 44 (11 × 4) dimensional vector of discrete data. In our exp eriment, we group opinions from IW-POD in to three time 2 ep o chs: t 1, t 2 and t 3, see T able 1 for details of the temp oral data. Moreo v er, since the true n umber of clusters is unknown, w e run clustering for differen t num bers of clusters ranging from 3 to 9. T able 1 Details of the IW-POD dataset which is divide d into thr e e time perio ds. Each observation c onsists of a 44 dimensional discr ete value d ve ctor that enc o des information ab out 11 differ ent asp e cts e ach having 4 p olarities. Time stamp Time p erio d Significance Num. opinions N. Sarkozy Num. opinions F. Hollande t1 03/12 - 06/12 Before and After Election 1018 1168 t2 07/12 - 10/12 After Election 1067 1079 t3 11/12 - 01/13 After Election 1079 708 3. P arametric Link Based Ev olutionary Clustering. W e adopt the parametric link approach ( Biernacki, Beninel and Bretagnolle , 2002 ; Jacques and Biernac ki , 2010 ) for evolutionary clustering by assuming that the source samples are equiv alen t to the samples at time ep o c h t and target samples represent sample of time t + 1. With this assumption, w e incorp orate linear link b etw een Multinomials at different time ep o ch. The algorithm for the prop osed clustering method is presen ted in Algorithm 1 . 3.1. R elate d work. Ev olutionary Clustering (ECL), also called cluster- ing over time , aims to cluster the data that dynamically evolv es ov er time ( Chakrabarti, Kumar and T omkins , 2006 ). Ordinary clustering metho ds are not appropriate as they group/partition the data samples only based on the certain prop erties of the data. In contrary , ECL metho ds cluster the data by additionally considering the temp oral smo othness to reflect the long-term trends of the data while b eing robust to the short-term v aria- tions ( Chakrabarti, Kumar and T omkins , 2006 ; Xu, Kliger and Hero Iii , 2 The first round of the presidential election was held in 22/04/2012 and the second round run-off was held on 06/05/2012. Therefore, the data collected during this election p eriod b elong to time epo ch t 1. OPINION MINING FROM TWITTER DA T A 5 2014 ; Chi et al. , 2009 ). ECL should maintain four prop erties ( Chakrabarti, Kumar and T omkins , 2006 ) suc h as consistency , noise remov al, smo othing and cluster corresp ondence. The demand and application of such clustering metho d are increasing rapidly due to the significan t gro wth of the dynamic data in n umerous domains. It has b een successfully applied to analyze news ( Xu et al. , 2012 ), so cial media ( Kim et al. , 2015 ), sto ck price ( Xu, Kliger and Hero Iii , 2014 ), photo-tag pairs ( Chakrabarti, Kumar and T omkins , 2006 ), and do cuments ( Blei and Laffert y , 2006 ). T emp oral/evolutionary data clustering has b een addressed from several viewp oin ts in the literature, whic h naturally raises several task-sp ecific no- tions ab out ECL. A distinction among them can b e as follows: (1) clustering (2) monitoring and (3) interpreting. In the following paragraphs, we review relev ant literature based on this distinction. F ollowing the definition of Chakrabarti, Kumar and T omkins ( 2006 ), the ECL metho d clusters data b y considering the historic information and cur- ren t data. Based on this definition, in this research we do not consider the metho ds whic h do not take into accoun t the historic information. Besides, in order to limit our fo cus on the parametric metho ds, we do not consider the metho ds from non-parametric Bay esian based approaches ( Xu et al. , 2008 ; Dub ey et al. , 2013 ; Kharratzadeh, Renard and Coates , 2015 ). Numerous metho ds based on differen t techniques hav e b een prop osed in the literature ( Chakrabarti, Kumar and T omkins , 2006 ; Xu, Kliger and Hero Iii , 2014 ; Chi et al. , 2009 ; Xu et al. , 2012 ; Kim et al. , 2015 ; Blei and Laffert y , 2006 ). Chakrabarti, Kumar and T omkins ( 2006 ) pro vided a generic framew ork for this problem and prop osed ev olutionary v ersion of k-means and hierarchical agglomerativ e clustering metho ds. Their prop os ed frame- w ork is based on optimizing a global cost function that consists of snapshot (static clustering) quality and history cost (temporal smo othness). This is considered as the first work for evolutionary clustering and has b een subse- quen tly extended by other researchers. Chi et al. ( 2009 ) prop osed t wo ev o- lutionary clustering metho ds based on sp ectral clustering strategy . In their approac h, they added terms within the clustering cost functions in order to regularize the temp oral smo othness. Xu, Kliger and Hero Iii ( 2014 ) recently prop osed AFFECT, whic h p erforms adaptive evolutionary clustering by es- timating an optimal smo othing parameter. This approach is extended with sev eral static clustering methods, suc h as k-means, hierarchical and sp ectral. A common prop ert y of these metho ds is that they specialized for contin uous data and hence ma y not b e an appropriate choice for clustering categorical data that is our concern in this research. Dynamic T opic Mo del (DTM) is a well-kno wn probabilistic method for 6 HASNA T ET AL. analyzing temporal categorical data ( Blei and Lafferty , 2006 ). It w as origi- nally dev eloped to analyze time ev olution of topics in large document col- lections. DTM extends the p opular topic mo deling metho d called Laten t Diric hlet Allo cation (LDA) ( Blei, Ng and Jordan , 2003 ). It uses Dirichlet prior based smoothing, whic h sometime o v er-smo oth the data. As a con- sequence, it may cluster the data samples with non co-occurring features in the same group ( Kim et al. , 2015 ). This ev en tually causes DTM to un- derp erform to cluster some classical non-textual temp oral categorical data. Recen tly , Kim et al. ( 2015 ) address this issue and prop osed a probabilis- tic generativ e mo del based ev olutionary clustering method, called T emp o- ral Multinomial Mixture (TMM). TMM extends the classical Multinomial Mixture (MM) mo del b y incorp orating temp oral dependency into the re- lation betw een data comp onen ts of current time ep o c h and the clusters of the previous time ep o ch. MM is a well-kno wn standard probabilistic mo del, whic h has been widely used to cluster static discrete/categorical data ( Meil˘ a and Hec k erman , 2001 ; Silv estre, Cardoso and Figueiredo , 2014 ). Similar to MM, TMM estimates mo del parameters using an Exp ectation Maximization (EM) algorithm. Although b oth DTM and TMM provide reasonable results to cluster temp oral categorical data, they are unable to detect and provide an y interpretation of the cluster evolutions, whic h is one of the main fo ci of this research. Indeed, TMM is more related to our prop osed approach as we aim to establish parametric link among MMs at differen t time ep o chs. The ev olution monitoring task ( Spiliopoulou et al. , 2006 ; Oliveira and Gama , 2010 ; F erlez et al. , 2008 ; Lamirel , 2012 ) tracks the ev olution of clus- ters b y iden tifying the birth, death, split, merge and surviv al of clusters at differen t time. An external clustering method is first used at each time to cluster the data, e.g., Spiliop oulou et al. ( 2006 ) and Oliveira and Gama ( 2010 ) used the k-means method, whereas Lamirel ( 2012 ) used the neural clustering metho d. Afterward, the association and mapping among the clus- ters at different time is examined based on several heuristics. F or example, Oliv eira and Gama ( 2010 ) used cluster cen troid related statistics, called com- prehensiv e representation of clusters. This approac h is very similar to the notion of detecting recurrent concept drifts in a semi-supervised context, see Li, W u and Hu ( 2012 ) for an example. A differen t metho d, called label-based diac hronic approach ( Lamirel , 2012 ), exploits the MultiView Data Analysis paradigm among the cluster lab els at differen t time. In this approac h, each feature is analyzed individually to compute recall, precision and F-measure. These information are used to construct heuristics for monitoring evolution. Our approach is different than the abov e metho ds, because: (a) w e do not aim to propose a cluster monitoring metho d explicitly and (b) w e do not use OPINION MINING FROM TWITTER DA T A 7 a static clustering metho d. Besides the ab ov e metho ds, F erlez et al. ( 2008 ) prop osed a joint clustering-monitoring metho d whic h uses the cross asso ci- ation algorithm to cluster data and a bipartite graph to monitor evolution. F or data clustering, they group the distinct features (word) in eac h clus- ter and hence features do not co exist in different clusters. This is differen t than us as w e exploit all the features in order to pro vide a feature lev el in terpretation for the ev olution. The task of evolution in terpretation aims to explain the reason for the ev olution of clusters at different time. It can b e accomplished by explicitly analyzing the features. T o this aim, Lamirel ( 2012 ) used the F-measures from individual features of the matched clusters (of different time) and con- struct a similarity rep ort. In our work, this interpretation can b e directly obtained from the link parameters by applying threshold on the link param- eters v alues. Therefore, our metho d is different from Lamirel ( 2012 ) as the link parameters computation is an integral part of the clustering task. Based on the abov e distinctions from sev eral viewpoints (clustering, mon- itoring and interpretation), we find that our method is more similar to the ev olutionary clustering methods rather than the evolution monitoring meth- o ds. Therefore, w e compare our metho d only with the relev an t state-of-the- art evolutionary clustering metho ds, such as Xu, Kliger and Hero Iii ( 2014 ), Blei and Lafferty ( 2006 ) and Kim et al. ( 2015 ). No w we fo cus on the literature related to our prop osal. The idea of para- metric link in a transfer learning context ( Beninel et al. , 2012 ) is inherited from the concept for Generalized Discriminant Analysis (GD A) ( Biernacki, Beninel and Bretagnolle , 2002 ). GD A adapts the classification rule from a source population to a target p opulation through a linear link map of their descriptive parameters. This is differen t than standard discriminan t rules which assumes a similarit y b etw een the source and target p opulations. Biernac ki, Beninel and Bretagnolle ( 2002 ) prop osed several mo dels with as- so ciated estimated parameters for GDA within the con text of multiv ariate Gaussian distribution. Later, Jacques and Biernacki ( 2010 ) extends the w ork of Biernacki, Beninel and Bretagnolle ( 2002 ) for binary data using Bernoulli distribution ( Bishop et al. , 2006 ). W e observ e that these approac hes can b e exploited for developing an ev olutionary clustering metho d by replacing the notion of source/target with different time ep o c hs t − 1/ t . Besides, such dev elopmen t requires the deriv ation of the linear link for the Multinomial distribution. Afterward, the link parameters naturally allo w us to in terpret the evolution of the clusters at different time. Categorical data/observ ations consists of the res p onses from a certain n um b er of categories. Differen t types (nominal and ordinal) of categorical 8 HASNA T ET AL. data are observ ed in n umerous studies ( Agresti , 2002 ), such as so cial science, biomedical science, genetics, education and mark eting. Moreo ver, data from differen t tasks, such as text retriev al and visual ob ject classification, are often conv erted to the categorical form. F or example, text data can b e con- v erted to this form by considering the unique w ords of the v o cabulary as an indep enden t category/term and then eac h sen tence/paragraph/do cument is represen ted as a discrete count v ector ( Zhong and Ghosh , 2005 ). The Multi- nomial distribution is a standard probability distribution for mo deling and analyzing the discrete categorical data ( Agresti , 2002 ). The Multinomial Mixture (MM) is a statistical model based on the Multi- nomial distribution. It has b een used for cluster analysis with discrete data ( Meil˘ a and Hec k erman , 2001 ; Agresti , 2002 ; Zhong and Ghosh , 2005 ; Sil- v estre, Cardoso and Figueiredo , 2014 ; Hasnat et al. , 2015 ). Meil˘ a and Heck- erman ( 2001 ) studied several Model-Based Clustering (MBC) metho ds with MM and experimentally compared them using differen t criteria suc h as clus- tering accuracy , computation time and num ber of selected clusters. Silv estre, Cardoso and Figueiredo ( 2014 ) prop osed a MBC metho d for MM which in tegrates b oth mo del estimation and selection task within a single EM algorithm. In their w ork, they extended the MBC strategy previously pro- p osed b y Figueiredo and Jain ( 2002 ) and pro vided a formulation to compute the Minimum Message Length (MML) criterion for mo del selection. Most recen tly , Hasnat et al. ( 2015 ) prop osed a MBC metho d which p erforms si- m ultaneous clustering and mo del selection using the MM. Their strategy p erforms similar task as Silvestre, Cardoso and Figueiredo ( 2014 ) in a com- putationally efficient manner which has b een previously prop osed for the Gaussian distribution ( Garcia and Nielsen , 2010 ) and Fisher distribution ( Hasnat, Alata and T r´ emeau , 2015 ). Moreo ver, similar to Meil˘ a and Heck er- man ( 2001 ), they provided a comparison among differen t mo del initialization and selection strategies. F ollowing all of the abov e approac hes ( Meil˘ a and Hec kerman , 2001 ; Silv estre, Cardoso and Figueiredo , 2014 ; Hasnat et al. , 2015 ), in this research we exploit the MBC framew ork to cluster discrete data with MM. MBC ( F raley and Raftery , 2002 ; Melnyk o v and Maitra , 2010 ) is a w ell- established metho d for cluster analysis and unsup ervised learning. It as- sumes a probabilistic mo del (e.g., mixture mo del) for the data, estimates the model parameters by optimizing an ob jective function (e.g., model lik eli- ho o d) and pro duces probabilistic clustering. The Expectation Maximization (EM) ( McLachlan and Krishnan , 2008 ) is mostly used in MBC to estimate the mo del parameters. EM consists of an Exp ectation step (E-step) and a Maximization step (M-step) whic h are iterativ ely employ ed to maximize the OPINION MINING FROM TWITTER DA T A 9 log likelihoo d of the data. Initialization of the EM algorithm has significant impact on clustering re- sults ( McLachlan and Krishnan , 2008 ; Baudry and Celeux , 2015 ). The EM algorithm is sensitiv e to its initialization, b ecause with differen t initializa- tions it ma y con v erge to differen t v alues of likelihoo d function, some of whic h can be local maxima (i.e., sub-optimal results). In order to ov ercome this, n umerous differen t initialization strategies are proposed and experimented in the relev ant literature ( Biernacki, Celeux and Gov aert , 2003 ; Meil˘ a and Hec kerman , 2001 ; Baudry and Celeux , 2015 ; Hasnat et al. , 2015 ). F ollo w- ing recommendations, w e use the small-EM ( Biernac ki, Celeux and Go v aert , 2003 ; Biernacki et al. , 2006 ; Baudry and Celeux , 2015 ; Hasnat et al. , 2015 ) metho d to initialize the MM parameters. MBC has been commonly exploited to identify the b est mo del for the data b y fitting a set of mo dels with differen t parameterizations and/or n um b er of comp onen ts and then applying a statistical mo del selection criterion ( F raley and Raftery , 2002 ; Biernacki, Celeux and Go v aert , 2000 ; Figueiredo and Jain , 2002 ; Melnyk o v and Maitra , 2010 ; Hasnat, Alata and T r´ emeau , 2015 ). In this pap er, w e apply this mo del fitting and selection strategy for t wo purp oses: (a) to identify the parametric submo dels (Section 3.4 ) and (b) to automatically select the num b er of comp onents (Section 3.7 ). 3.2. Statistic al mo del for evolutionary data samples. Let S t b e a set of samples corresp onding to time t and S t +1 b e a set from the next time t + 1. W e assume that while the cluster lab els for S t are kno wn to us (estimated from t − 1), lab els of S t +1 are unknown. Let S t b e comp osed of N t pairs ( x t 1 , z t 1 ) , . . . , ( x t N t , z t N t ) where x t i = x t i, 1 , . . . , x t i,D is the D dimensional count v ector of order V , i.e., P D d =1 x t i,d = V and z i is the asso ciated class lab el such that z t i,k = 1 if the data b elongs to cluster k with k = 1 , . . . , K and z t i,k = 0 otherwise. W e assume that an y sample x t i of S t is an indep endent realization of the random v ariable X t of distribution: X t ∼ M ( V , µ t k ) , k = 1 , . . . , K with M ( V , µ t k ) is the V -order Multinomial distribution with parameter µ t k = ( µ t k, 1 , . . . , µ t k,D ) which is formally defined as ( Bishop et al. , 2006 ): (3.1) M ( x i | V , µ k ) = V x i, 1 , x i, 2 , . . . , x i,D D Y d =1 µ x i,d k,d here, µ k is the parameter of the Multinomial distribution of k th class with 0 ≤ µ k,d ≤ 1 and P D d =1 µ k,d = 1. Therefore, samples of the en tire set S t 10 HASNA T ET AL. can b e mo deled with a mixture of k Multinomials, also called Multinomial Mixture (MM) mo del, whic h has the following form: (3.2) f ( x i | Θ K ) = K X k =1 π k M ( x i | V , µ k ) In Eq. ( 3.2 ), Θ K = { ( π 1 , µ 1 ) , . . . , ( π K , µ K ) } is the set of mo del parame- ters, π k is the mixing prop ortion with P K k =1 π k = 1 and M ( x i | V , µ k ) is the densit y function (Eq. ( 3.1 )). Besides, we assume that the class lab el z t i is an indep enden t realization of a random vector Z t , distributed according to 1-order Multinomial: Z t ∼ M (1 , π t ) where π t = π t 1 , . . . , π t K is the mixing prop ortion of the mo del in Eq. ( 3.2 ). The assumption of MM is similar for the samples of S t +1 with random v ariable X t +1 and parameter µ t +1 k . How ev er, for S t +1 the lab els z t +1 i of N t +1 pairs ( x t +1 1 , z t +1 1 ) , . . . , ( x t +1 N t +1 , z t +1 N t +1 ) are unkno wn. In the context of ev olutionary clustering, our goal is to estimate the unknown lab els z t +1 i for i = 1 , . . . , N t +1 using the information from S t and S t +1 b y establishing a link b etw een µ t k and µ t +1 k . 3.3. Par ametric link/r elationship among temp or al data. F or random v ari- ables Y t and Y t +1 distributed according to the Gaussian distribution, a lin- ear distributional link exists (under w eak assumptions) ( Biernac ki, Beninel and Bretagnolle , 2002 ), which has the form: Y t +1 ∼ D Y t + b , where D and b are the link parameters among the samples of different time ep o c h. F or binary data the follo wing distributional linear link among Bernoulli param- eters ( α t +1 and α t with 0 ≤ α ≤ 1) is derived by Jacques and Biernac ki ( 2010 ): (3.3) α t +1 = Φ δ Φ − 1 α t + λ γ where δ ∈ R + \{ 0 } , λ ∈ {− 1 , 1 } and γ ∈ R are the link parameters. Φ is the cum ulativ e Gaussian function of mean 0 and v ariance 1, see Fig. 3.1 . W e can use the ab ov e form ulation for Multinomial parameters by considering t w o issues: (1) Multinomial parameter µ k has equiv alent prop ert y as α k except P D d =1 µ k,d = 1 and (2) samples from X are not necessary to b e binary , whic h makes λ useless. Considering these issues w e can derive parametric link b etw een µ t and µ t +1 as: (3.4) µ t +1 k,d = Φ δ k,d Φ − 1 µ t k,d + γ k,d P D r =1 Φ δ k,r Φ − 1 µ t k,r + γ k,r OPINION MINING FROM TWITTER DA T A 11 where δ k,d ∈ R + \{ 0 } and γ k,d ∈ R are the link parameters. In Eq. ( 3.4 ), the combination of parameters δ k,d and γ k,d for ∀ k , d is called a full mo del whic h is ov er-parameterized and may leads to am biguit y . Instead, we con- sider sev eral sub-mo dels with certain constraints on the parameters, see the follo wing section. 3.4. Par ametric sub-mo dels. The idea of defining sub-mo dels is frequen t in Mo del-Based Clustering (MBC) ( F raley and Raftery , 2002 ). W e fit the ev olutionary clustering mo del (Eq. ( 3.4 )) with differen t sub-mo dels and then select the best mo del using the Bay esian Information Criteria ( Sch warz et al. , 1978 ): (3.5) B I C = − 2 L (Θ) + ν log N t +1 where L (Θ) is the log-lik elihoo d (Eq. ( 3.6 )) v alue asso ciated to the MM parameters of t + 1, ν is the n um b er of free parameters of the sub-model. These sub-mo dels pro vide sufficient interpretation ab out the change in pa- rameters from time t to t + 1. Definition and interpretation of sev eral basic sub-mo dels, defined as pair ( δ k,d /γ k,d ) are given b elow: (M1) 1 / 0 : This mo del is constrained with δ k,d = 1 and γ k,d = 0 for ∀ k , d , i.e., ν = 0. It indicates that the observ ations X t +1 can b e mo deled with µ t k,d and hence no evolution o ccurred. (M2) 0 /γ k,d : This mo del is constrained with δ k,d = 0 for ∀ k , d , i.e., ν = K ∗ D . It indicates that the observ ations X t +1 should b e mo deled without considering µ t k,d . This mo del should b e selected when a new cluster ev olv ed indep endently and does not consider any historical information. This is the most general mo del that can certainly fit the observ ations X t +1 to a MM most efficiently sub ject to a go o d initialization of the alternativ e iterativ e method. Sev eral p ossible v ariations 3 of this mo del are: 0 /γ , 0 / γ k and 0 / γ d . (M3) δ k,d / 0 : This mo del is constrained with γ k,d = 0 for ∀ k , d , i.e., ν = K ∗ D . It indicates that µ t +1 k,d are evolv ed through µ t k,d in a sp ecific transformation space (inv ersed cumul ative Gaussian). This mo del should b e selected when true evolution o ccurred whic h can be explained in detail through certain b elief on observed features and obtained clusters. Moreo ver, suc h a mo del can b e plugged in with any other metho d in order to describ e the cluster ev olution. Sev eral p ossible v ariations of this mo del are: δ / 0, δ k / 0 and δ d / 0. This mo del is equiv alen t to the fundamental unconstrained mo del assumed by Biernacki, Beninel and Bretagnolle ( 2002 ). 3 Subscript k means cluster dep endent and d means feature dep endent. No subscription means a constant v alue for all clusters and features. 12 HASNA T ET AL. (M4) 1 /γ k,d : In this mo del, δ k,d = 1 for ∀ k , d , i.e., ν = K ∗ D . This mo del do es nearly similar task as mo del M3. It is relativ ely easier to fit through the additiv e term in the inv erse cum ulativ e Gaussian space. On the other hand, it is less expressive in terms of in terpretation. Several p ossible v ariations of this mo del are: 1 /γ , 1 / γ k and 1 / γ d . 3.5. Par ameter estimation. In our prop osed form ulation of ev olutionary clustering, we estimate tw o different types of parameters (see Eq. ( 3.4 )): (1) MM mo del parameters: µ and π and (2) temp oral link parameters: δ and γ . W e estimate them in t w o steps. The first step consists of estimating µ and π (only for t = 1) for the observ ed samples of time t . In the second step, w e estimate δ and γ . A t any time ep o c h, w e estimate the class lab els z i b y maximum a p osteriori . 3.5.1. Multinomial Mixtur e (MM) Par ameters. At time t = 1, w e esti- mate the MM parameters using an Exp ectation Maximization (EM) algo- rithm that maximizes the log-lik eliho o d v alue which has the following form: (3.6) L (Θ) = N X i =1 log K X j =1 π j M x i | µ j where N = N 1 is the num ber of samples. In the Exp ectation step (E-step), w e compute p osterior probabilit y as: (3.7) ρ i,k = p ( z i,k = 1 | x i ) = π k Q D d =1 µ x i,d k,d P K l =1 π l Q D d =1 µ x i,d l,d In the Maximization step (M-step), we up date π k and µ k,d as: (3.8) π k = 1 N N X i =1 ρ i,k and µ k,d = P N i =1 ρ i,k x i,d P N i =1 P D r =1 ρ i,k x i,r The E and M steps are iterativ ely employ ed un til certain con v ergence crite- rion (difference of the log-likelihoo d v alues of successive iterations) is satis- fied. The estimation of µ k,d using Eq. ( 3.8 ) is only applicable for t = 1 due to the unav ailability of any temp oral information. F or any time t + 1, when the link parameters are a v ailable, µ k,d is estimated with Eq. ( 3.4 ). 3.5.2. Link p ar ameters. Estimation of link parameters δ k,d and γ k,d uses µ t k,d and the observ ed samples at time t + 1. Similar to Jacques and Biernacki OPINION MINING FROM TWITTER DA T A 13 ( 2010 ), w e use again an EM algorithm, but in whic h the M step is not ex- plicit. Consequen tly , we emplo y an external optimization metho d such as an alternativ e iterative algorithm whic h consists of a succession, component wise of the simplex metho d 4 ( Nelder and Mead , 1965 ). In general, the starting p oin t of the alternative algorithm corresponds to the case when µ t +1 k,d = µ t k,d , i.e., δ k,d = 1 and γ k,d = 0. How ev er, in order to obtain a b etter estimate and sa v e computation time 5 , we apply an efficien t approach, see Section 3.6.2 . Algorithm 1: Algorithm for clustering using parametric link among m ultinomial mixtures (PLMM). Input : χ = S t t =1 ,...,T , S t = { x i } i =1 ,...,N t , x i = { x i,d } d =1 ,...,D , x i,d ∈ N Output : Evolutionary clustering of χ with K classes and link parameters: δ t k,d and γ t k,d ∀ k , d, t . foreac h t do if t = 1 then Initialize π j,k and µ j,k for 1 ≤ j ≤ k using the smal l-EM procedure, see Section 3.6.1 ; end while not c onver ge d do { P erform the E-step of EM } ; foreac h i and j do Compute ρ ik = p ( z i,k = 1 | x i ) using Eq. ( 3.7 ) end { P erform the M-step of EM } ; for k = 1 to K do if t = 1 then Up date π k and µ k using Eq. ( 3.8 ) else Up date π k using Eq. ( 3.8 ) Compute δ k,d and γ k,d , see Sec. 3.5.2 Up date µ k using Eq. ( 3.4 ) end end end end 3.6. Par ameters initialization. In the proposed clustering method (Algo- rithm 1 ), we need to initialize both the MM parameters Θ init K = ( π init 1 , µ init 1 ) , . . . , ( π init K , µ init K ) for time t 1 and the link parameters ( δ and γ ). 4 F or the implementation, we used nelderme ad function of nloptr R pack age ( Ypma , 2014 ). The lo wer and upp er b ounds were set to − 2 . 5 and +2 . 5 resp ectively only for the γ k,d parameters. 5 The simplex metho d requires a large n umber of iterations to conv erge. 14 HASNA T ET AL. 3.6.1. Multinomial Mixtur e (MM) Par ameters. Generally , the MM pa- rameters are initialized randomly ( Meil˘ a and Hec k erman , 2001 ; Hasnat et al. , 2015 ). Ho w ever, with both synthetic and real data it has b een demonstrated b y Hasnat et al. ( 2015 ) that, random initialization has its limitation w.r.t. the clustering p erformance and stability . Therefore, following Hasnat et al. ( 2015 ), w e initialize the mo del parameters using the small-EM pro cedure. This small-EM pro cedure consists of running multiple short runs of ran- domly initialized EM and then selecting the one with the maximum lik eli- ho o d v alue. Here, short run means that the EM pro cedure do es not need to wait un til conv ergence and it can be stopped when a certain num ber of iterations is completed. 3.6.2. Link p ar ameters. W e prop ose an initialization pro cedure based on the predictive parameters set for next time ep o ch Θ pred K = ( π pred 1 , µ pred 1 ) , . . . , ( π pred K , µ pred K ) . Let Θ t K = ( π t 1 , µ t 1 ) , . . . , ( π t K , µ t K ) is the set of parameters for the curren t time ( t ) epo ch. Our initialization pro cedure consists of the follo wing steps: • Step 1: estimate Θ pred K using data samples of next time X t +1 and an EM algorithm which is initialized with Θ t K . • Step 2: compute δ init k,d and γ init k,d for each k and d as: (3.9) γ init k,d = Φ − 1 µ pred k,d for mo del M2 (3.10) δ init k,d = Φ − 1 µ pred k,d Φ − 1 µ t k,d for mo del M3 (3.11) γ init k,d = Φ − 1 µ pred k,d − Φ − 1 µ t k,d for mo del M4 The Eq. ( 3.9 ), ( 3.10 ) and ( 3.11 ) are simply deriv ed from Eq. ( 3.4 ) with the consideration that denominator is equal to 1, i.e., P D d =1 µ k,d = 1 for k = 1 , . . . , K . 3.7. V arying numb er of clusters. The metho dology presented in the pre- vious sub-sections assumes the same n um b er of clusters K for each time ep o ch. In this sub section, w e prop ose an extension of it such that the metho d can handle v arying K at differen t time, i.e., K t and K t +1 ma y be differen t. T o this aim, w e mo dify the links initialization strategy (Section OPINION MINING FROM TWITTER DA T A 15 3.6.2 ) in order to adapt the v ariability among Θ t K t and Θ t +1 K t +1 . A t time epo ch t , this extended metho d requires additional information, such as: (a) n um b er of clusters K t +1 and (b) cluster mapping b et ween Θ t K t and Θ t +1 K t +1 . W e adopted the metho d prop osed by Hasnat et al. ( 2015 ) with L-metho d ( Salv ador and Chan , 2004 ) to select the num b er of cluster automatically at eac h time ep o ch. In order to initialize the link parameters, first we select the num b er of clusters K t +1 and obtain the predictive parameter set Θ pred K t +1 . Next, for eac h cluster k in Θ pred K t +1 w e find the corresp onding cluster in Θ t K t based on the minimum symmetric kullback leibler div ergence (sKLD). sKLD among tw o clusters a and b is defined as ( Hasnat et al. , 2015 ): (3.12) sK LD = D K L ( µ a , µ b ) + D K L ( µ b , µ a ) 2 , where D K L ( µ a , µ b ) = D X d =1 µ a,d ln µ a,d µ b,d After establishing the correspondences, w e use Eq. ( 3.9 ), ( 3.10 ) and ( 3.11 ) to set the initial v alues of the link parameters. Finally , we estimate the link parameters following Section 3.5.2 . 3.8. Interpr etation of cluster evolution. The link parameters ( δ k,d and γ k,d ) along with the function Φ are the k ey to interpret the cluster ev olution. Let us notice some basic interpretation of the v alues of these parameters for all feature d and cluster k : • δ k,d = 0 means that µ k,d (probabilit y) at t + 1 do es not dep end on t , whereas δ k,d = 1 (with γ k,d = 0) means identical probabilit y at tw o differen t times. • δ k,d → 0 and/or γ k,d → ∞ means that the distribution tends to uni- form distribution. • δ k,d → ∞ and/or γ k,d → −∞ means that the distribution tends to b e mor e c onc entr ate d (Dirac distribution) at time t + 1 in the feature whic h has the highest probabilit y at time t . In order to get further interpretation, we need to understand the Multi- nomial parameters µ k,d and the space spanned b y the cumulativ e Gaussian Φ and its inv erse Φ − 1 . Let us consider an exp erimen t of dra wing V balls of d = 1 , . . . , D different colors (represen t features). After each dra w, the color of the ball is recorded in a D dimensional count vector x i and the ball is replaced. Therefore, at the end of i th exp erimen t x i,d rev eals the coun t of dra wing the d th colored ball. When a Multinomial distribution is used 16 HASNA T ET AL. Fig 3.1 . Il lustr ations of Cumulative Gaussian function and its r elationship with the par am- eter change of Multinomial distribution using Eq. ( 3.4 ). The arr ows indic ates the dir e ction of changes in the inverse function spac e which eventual ly incr e ase/de cr e ase the pr ob ability. to fit suc h exp erimental data, its parameter µ k,d rev eals the probabilit y of dra wing the d th colored ball. No w, let us consider Φ in Fig. 3.1 where the v alues along the Y-axis represen t the p ossible v alues of µ t +1 k,d (with 0 ≤ µ t +1 k,d ≤ 1) and the X-axis represen ts the v alues of µ t k,d after transforming through Φ − 1 function. No w, according to Eq. ( 3.4 ), cluster evolutions ( µ t k,d → µ t +1 k,d ) can b e explained through multiplication (using δ k,d ) and addition/subtraction (using γ k,d ) op erations. The v alues of γ k,d can certainly indicates the increase/decrease of the probabilit y of certain feature (color) sub jec t to the selection of sub-mo del M4 . On the other hand if sub-mo del M3 is selected, v alues of δ k,d can explain the b elief that µ t +1 k,d should decrease if µ t k,d < 0 . 5 and increase if µ t k,d > 0 . 5. F or example, let us consider that in a 2 colors (red and green) ball exp eriment the probability of the red color ball is changed from 0.8 (at time t1) to 0.7 (at time t2). Such a c hange can b e explained with mo del M3 with δ k,r ed = 0 . 6, whic h indicates that the b elief is decreased at the next time. F rom the ab o ve discussions it is eviden t that the prop osed metho d is capable to interpret the cluster ev olutions up to the feature level. 4. Numerical exp erimen ts. W e begin the exp eriments using sim- ulated evolutionary data samples and ev aluate w.r.t. the state-of-the-art metho ds. A characteristic com parison of differen t metho ds is presented in OPINION MINING FROM TWITTER DA T A 17 T able 2 . F or the simulated samples; we use the Adjusted Rand Index (ARI) ( Hub ert and Arabie , 1985 ) as a measure for ev aluation. Next, we exp eri- men t and compare metho ds using real data. W e use one of the real datasets exp erimen ted b y Kim et al. ( 2015 ). W e c ho ose the p olitic al opinion dataset from the ImagiW eb pro ject ( V elcin et al. , 2014 ) as it consists of data from an interesting time p erio d - during and after the election. T able 2 Char acteristic c omp arison of differ ent state-of-the-art evolutionary clustering metho ds: Par ametric Link among Multinomial Mixtur es (PLMM, our pr op osed metho d), T emp or al Multinomial Mixtur e (TMM) ( Kim et al. , 2015 ), Dynamic T opic Mo del (DTM) ( Blei and L afferty , 2006 ) and adaptive evolutionary clustering metho d (AFFECT) ( Xu, Kliger and Her o Iii , 2014 ). PLMM DTM TMM AFFECT Data Type Discrete Discrete Discrete Con tinuous In terpret Ev olution Y es No No No 4.1. Simulate d Data Samples. F ollowing standard sampling metho ds we generate differen t sets { S t } t =1 ,...,T of sim ulated data for differen t time epo chs. W e draw a finite set of categorical samples (discrete coun t vectors) S t = { x i } i,...,N t with differen t num bers (10, 20 and 40) of features (dimensions) D . These samples are issued from Multinomial Mixture (MM) mo dels of K = 3 classes. W e consider t wo different sets of samples: • Samples with higher order of categorical count ( hos ) with V ∼ 1 . 5 ∗ D with 3 time epo chs each ha ving differen t n um ber of i.i.d. samples: N 1 = 500, N 2 = 100, and N 3 = 200. W e also add noisy counts with these samples. These type of samples pro vides b etter resem blance with the MM parameters due to sufficient n umber of count in the observ ations. Practically , this is similar to the fact when the observ ations consists of data ov er longer p erio d of time. • Samples with lo w er order of categorical count ( los ) with V ∼ 0 . 7 ∗ D with 5 time ep o chs each having different num b er of i.i.d. samples: N 1 = 50, N 2 = 40, N 3 = 40, N 4 = 30 and N 5 = 20. This t yp e of samples are sparse and often difficult to distinguish among clusters. Practically , this is similar to the fact when the observ ations consists of data ov er shorter p erio d of time. The evolutionary data generation pro cess consists of tw o steps: (1) deter- mine MM parameters µ k,d at each time ep o c h t = 1 , . . . , T and (2) sample observ ations from the specified MM following assumption sp ecified b y Blei, Ng and Jordan ( 2003 ). F or t = 1, we sample µ k,d from a Diric hlet distribu- tion and v erify (separation w.r.t. the other clusters parameters ( Silvestre, 18 HASNA T ET AL. Cardoso and Figueiredo , 2014 )) it using the symmetric Kullback-Leibler Div ergence v alue. F or t > 1, w e sample µ k,d from µ t − 1 k,d using the MM link relationship defined in Eq. ( 3.4 ). This ensures that we main tain the temporal smo othness prop erty ( Chakrabarti, Kumar and T omkins , 2006 ; Xu, Kliger and Hero Iii , 2014 ) of the ev olutionary data samples. In order to use the link relationship, we use only mo del M4 for hos data samples and randomly select a model among M1, M3 and M4 for los data samples. Next, w e set the asso ciated link parameters ( δ k,d and γ k,d ) randomly within a pre-sp ecified range of v alues. T o sample observ ations, first we choose the order V k of eac h cluster. Our sampling procedure for eac h observ ation i at eac h time t follo ws the steps b elo w: • Cho ose a cluster z i,k = 1 as: z i ∼ M (1 , π 1 , . . . , π D ) , with, π d = 1 k . • Cho ose the order τ i of Multinomial for the sample x i using Poisson distribution as: τ i ∼ Poisson ( V z i ). • Draw sample x i using Multinomial distribution as: x i ∼ M τ i , µ k, 1 , . . . , µ k,D . T able 3 Simulate d data evaluation and c omp arison using A djusted R and Index (ARI) ( Hub ert and Ar abie , 1985 ). Metho ds: PLMM (prop ose d), Dynamic T opic Mo del (DTM), T emp or al Multinomial Mixtur e (TMM) and AFFECT with k-me ans. Datasets c onsist of differ ent typ es (hos and los) of samples with differ ent numbers (10, 20 and 40) of fe atur es. hos : higher or der samples and los : lower or der samples. Boldfac e d indic ate the b est r esult and underline d numb ers indicate se c ond b est. V alues inside the p ar entheses pr ovide the standar d deviation of the ARI values. PLMM TMM DTM AFFECT 10, hos 0.91 (0.07) 0.86 (0.11) 0.79 (0.14) 0.43 (0.12) 10, los 0.81 (0.19) 0.91 (0.1) 0.81 (0.1) 0.34 (0.11) 20, hos 0.96 (0.05) 0.91 (0.1) 0.81 (0.18) 0.37 (0.11) 20, los 0.90 (0.18) 0.98 (0.04) 0.95 (0.11) 0.35 (0.09) 40, hos 0.97 (0.05) 0.92 (0.11) 0.48 (0.4) 0.33 (0.11) 40, los 0.93 (0.16) 0.97 (0.05) 0.97 (0.1) 0.36 (0.1) W e applied our proposed Parametric Link among Multinomial Mixtures (PLMM, Algorithm 1 ) clustering metho d on these sim ulated data using the basic sub-mo dels defined in Sec. 3.4 . T able 3 provides the results using the ARI ( Hub ert and Arabie , 1985 ) measure. Moreo v er, it provides a com- parativ e ev aluation w.r.t. other state-of-the-art metho ds (see comparison in T able 2 ): (a) T emp oral Multinomial Mixture (TMM) ( Kim et al. , 2015 ) with smo othness parameter α = 1; (b) Dynamic T opic Model (DTM) ( Blei and Lafferty , 2006 ) with h yp er-parameter α = 0 . 01 and (c) Adaptive ev olu- OPINION MINING FROM TWITTER DA T A 19 tionary clustering metho d (AFFECT 6 ) ( Xu, Kliger and Hero Iii , 2014 ) with k-means and Euclidean distance as a measure of similarity . W e compute the a v erage ARI of time t = 2 , . . . , T (at t = 1 there is no evolution). Results in T able 3 w.r.t. ARI ev aluation shows that: • PLMM (prop osed) provides highest ARI for the hos samples and TMM ( Kim et al. , 2015 ) provides highest ARI for the los samples. These results are not surprising as both PLMM and TMM methods are sp ecialized methods to cluster samples whic h are drawn from Multi- nomial distributions. • DTM ( Blei and Laffert y , 2006 ) pro vides b etter results for los samples and higher dimensional data. This t yp e of data is more lik ely to extract from text do cuments for whic h DTM was originally proposed. • AFFECT ( Xu, Kliger and Hero Iii , 2014 ) performs po orly compares to others for b oth types of sample. This is expected b ecause of the simi- larit y measure used in AFFECT is appropriate for con tin uous data. Next, w e test statistical h yp othesis among PLMM, TMM and DTM using two sample t-test at the 5% significance lev el. The null hypothesis is that - the data in tw o results comes from indep endent random samples from normal distributions with equal means and equal but unkno wn v ariances. Results sho w that for all hos data the h yp othesis is rejected with p-v alue < 0.001. On the other hand, for the los data it is rejected only for 10 dimensional samples among the pairs (PLMM, TMM) and (DTM, TMM) with p-v alue < 0.0001. Next, w e analyze the evolution of the clusters in terms of selected sub- mo dels. T able 4 provides the rate of differen t selected models. W e see that, for the hos data samples the mo del M4 (1 /γ k,d ) is mostly selected. On the other hand, for the los data samples, differen t mo dels M1: (1 / 0), M4: (1 /γ k,d ) and M3: ( δ k,d / 0) are selected at certain rate. This observ ation con- firms that PLMM successfully reco v ers the cluster evolutions with different mo dels whic h were used to generate the simulated data. Interestingly , we observ e that the model M2 (1 /γ k,d ) is not selected which reflects the true fact that it w as not considered to generate the sim ulated data samples. No w based on the selected mo del, w e can provide further interpretation using δ k,d and γ k,d , see Sec. 3.4 . Finally , we conduct exp eriments with v arying num ber of clusters K at differen t time ep o ch. F or this exp eriment, w e use the same MM parameters whic h were used to generate the hos data samples. T o ensure differen t K at different ep o c h, we randomly select a pair of time epo c hs and remo v e a 6 W e exp erimented AFFECT with hierarchical and sp ectral clustering also. How ev er, k-means provided the b est results. 20 HASNA T ET AL. T able 4 Per c entage of the sele cte d models for the interpr etation of evaluation. hos : higher or der (c ate goric al c ount) samples and los : lower order samples. Boldfac e d indic ate the highest r ate. M1: ( 1 / 0 ) M4: ( 1 /γ k,d ) M3: ( δ k,d / 0 ) M2: ( 0 /γ k,d ) 10, hos 0 % 94 % 6 % 0 % 10, los 15 % 38 % 47 % 0 % 20, hos 0 % 92 % 8 % 0 % 20, los 14 % 43 % 43 % 0 % 40, hos 0 % 96 % 4 % 0 % 40, los 4 % 37 % 59 % 0 % cluster from one of them. Then, w e generate N t = N t +1 = 1000 synthetic data samples from them using the same pro cedure mentioned before. Ap- plying the extension of PLMM metho d (Section 3.7 ) on these data provides the following results (ARI): 0.967 (0.09) for d = 10, 0.988 (0.04) for d = 20 and 0.986 (0.05) for d = 40. These results confirms that our prop osed exten- sion can cluster the synthetic data with v arying K and provides reasonable accuracy . 4.2. IW-POD dataset. W e consider three different methods, Dynamic T opic Mo del (DTM) ( Blei and Lafferty , 2006 ), T emp oral Multinomial Mix- ture (TMM) ( Kim et al. , 2015 ) and Parametric Link among Multinomial Mixtures (PLMM), for a comparativ e ev aluation of the p erformance on IW- POD dataset. These metho ds are selected based on their sp ecialt y to cluster discrete evolutionary/temporal data. W e set 100 maximum n um b er of itera- tions as the conv ergence criterion for all methods. Besides, we set the thresh- old log-likelihoo d difference v alues as 0.0001 for PLMM and TMM. The smo othness parameter α of TMM was set to 1. The DTM hyper-parameter α was set to 0.01. F or the PLMM metho d, we consider the sub-mo dels men- tioned in Sec. 3.4 . IW-POD dataset do es not pro vide ground truth cluster labels, due to whic h w e were unable to ev aluate clustering results with the kno wn-lab els based metric suc h as ARI . In this context, we ev aluate the metho ds using a well known lik eliho o d related measure called p erplexity on a held-out test set ( Murph y , 2012 ; Blei, Ng and Jordan , 2003 ). Perplexity is a quan tity originally used in the field of language mo deling ( Murphy , 2012 ). It measures ho w well a mo del has captured the underlying distribution of language. In clustering context, p erplexity is defined as the recipro cal geometric mean of the p er feature (w ord) log-lik eliho o d of a test set, which is computed using the model parameters learned with a training set. Therefore, the lower p erplexity v alue indicates that the estimated (trained) mo del p erforms b etter OPINION MINING FROM TWITTER DA T A 21 Number of clusters 3 4 5 6 7 8 9 Perplexity 19 20 21 22 23 24 25 26 PL TMM DTM Number of clusters 3 4 5 6 7 8 9 Perplexity 20 21 22 23 24 25 26 27 28 PL TMM DTM Number of clusters 3 4 5 6 7 8 9 Perplexity 15 20 25 30 35 40 45 50 55 PL TMM DTM Number of clusters 3 4 5 6 7 8 9 Perplexity 10 20 30 40 50 60 70 80 90 PL TMM DTM (c) (d) N. Sark ozy F . Hollande t2 t3 Fig 4.1 . Comp arison of differ ent methods w.r.t. the p erplexity values ( lower is b etter ) c ompute d fr om the IW-POD data of two entities (r ow-1: Sarkozy and r ow-2: Hol lande) and two time ep o chs (c olumn-1: ep o ch t 2 and c olumn-2: ep och t 3 ). Metho ds: Dynamic T opic Mo del (DTM) ( Blei and Lafferty , 2006 ), T empor al Multinomial Mixtur e (TMM) ( Kim et al. , 2015 ) and our pr op ose d Par ametric Link among Multinomial Mixtur es (PLMM) metho d. 22 HASNA T ET AL. to fit the test data. Perplexity can b e formally defined as ( Blei, Ng and Jordan , 2003 ): (4.1) per ple xity ( X test ) = exp − L Θ train P N test i =1 V i ! where, V i is the total num b er of feature coun ts (words for do cument) in observ ation i , L Θ train denotes the log-likelihoo d of the test data set com- puted using the trained mo del parameters Θ train and Eq. ( 3.6 ). In our exp eriments, for each time epo c h t , we compute p erplexity from 5 folds of training-test data division and then tak e the av erage of 5 p erplexity v alues as the final measure. F or each fold, w e used 80% data for training the mo del and obtain parameters Θ train and the remaining 20% data to compute p erplexity using Eq. ( 4.1 ). Fig. 4.1 illustrates the p erplexity v alues computed from the data of t wo entities (ro w-1: Sarkozy and row-2: Hollande) and tw o time ep o chs (column-1: ep o ch t 2 and column-2: ep o ch t 3). Time ep o c h t 1 is not considered b ecause it do es not reflect the link relationship and temp oral asp ect of data clustering. Results in Fig. 4.1 show that, PLMM provides the b est p erplexity com- pared to DTM and TMM. This means that, compared to other metho ds, PLMM provides b etter fitting of the underlying Multinomial distribution to the test data. The next best (3 out of 4) metho d is the DTM follo wed by the TMM. Indeed, the results from TMM are in tuitive as the fitted mo dels are highly influenced b y the other cluster components (Multinomial distri- butions) from the previous and next time ep o chs. In con trary , PLMM only consider the link from one cluster in the previous time ep o ch and fit the data accordingly . Fig. 4.2 provides a visual illustration of clustering results obtained from the ab ov e three methods. This illustration is obtained by using the Multi- dimensional scaling ( Krusk al and Wish , 1978 ) technique where the distance matrix among the observ ations is computed by first con verting the coun t v ectors into probabilities and then using the sKLD (Eq. 3.12 ) as a measure of distance. The clustering results are obtained with K = 3, time ep o ch t 2 and the observ ations asso ciated with the en tity NS. F rom visual compar- ison among the plots in Fig. 4.2 , w e can say that PLMM pro vides b etter separation than TMM and DTM. Indeed, this observ ation agrees with the n umerical results obtained with the p erplexity v alues in Fig. 4.1 (a) for K = 3. Next, w e apply the extension of PLMM metho d (Section 3.7 ) with this dataset and observe the p erplexity for time ep o chs t 2 and t 3. F or the entit y NS, w e obtain av erage p erplexity v alues as: t 2 : 26 . 56 and t 3 : 25 . 06 where OPINION MINING FROM TWITTER DA T A 23 (a) PLMM (b) TMM (c) DTM Fig 4.2 . Il lustr ation of clustering r esults visualize d with Multidimensional sc aling ( Kruskal and Wish , 1978 ). Metho ds: (a) pr op ose d Par ametric Link among Multinomial Mixtures (PLMM); (b) T emp or al Multinomial Mixtur e (TMM) ( Kim et al. , 2015 ) and (c) Dynamic T opic Mo del (DTM) ( Blei and Lafferty , 2006 ). 24 HASNA T ET AL. a v erage K t 2 is 3 and a verage K t 3 is 5. F or the entit y FH, we obtain av erage p erplexity v alues as: t 2 : 13 . 08 and t 3 : 5 . 17 where av erage K t 2 is 4 and a v erage K t 3 is 5. Compared to the results in Fig. 4.1 we see that, p erplexity v alues increases (p erformance decreases) for en tit y NS and decreases (p er- formance impro v es) for FH. Based on these observ ations, w e can sa y that the extension of PLMM pro vides a go o d compromise in p erformance and w orks well for v arying K at differen t ep o chs. W e do not compare these re- sults with the TMM and DTM metho ds as they work with fixed K for all time ep o chs. Finally , let us focus on the in terpretations of cluster evolutions in the IW-POD dataset. T able 5 provides the selection rate of differen t models at differen t time ep o c hs (see T able 1 for details of time division). Listed rates pro vide us very interesting observ ations from whic h we can say that: • The opinions about NS were ev olving almost similar wa y during and after the e lection p erio d. These evolutions can b e in terpreted through the b elief on asp ects using mo dels M3:( δ k,d / 0) (93%) and M4:(1 /γ k,d ) (7%). This indicates that during t 1- t 2- t 3 opinions ab out NS w ere c hanging slowly . • Mo del M2:(0 /γ k,d ) is selected for all clusters of opinions ab out FH dur- ing t1-t2. This means that the opinions change significantly b et ween t 1 and t 2 p erio d. F rom t 2 to t 3 (both after election p erio d), opinions were ev olving, which can b e in terpreted through the b elief on the features with the mo dels M4:(1 /γ k,d ) (62%) and M3:( δ k,d / 0) (38%). T able 5 Sele ction r ate of differ ent mo dels (Sec. 3.4 ) for the IW-POD dataset at differ ent time ep o chs (se e T able 1 for details of time division). M1: ( 1 / 0 ) M4: ( 1 /γ k,d ) M3: ( δ k,d / 0 ) M2: ( 0 /γ k,d ) NS (t1-t2) 0 % 0 % 100 % 0 % NS (t2-t3) 0 % 13 % 87 % 0 % FH (t1-t2) 0 % 0 % 0 % 100 % FH (t1-t2) 0 % 62 % 38 % 0 % 5. Analysis of the p olitical opinion dataset. In this section, w e p erform analysis on the clustering results only from the PLMM metho d. In order to visualize the conten ts, we construct a histogram representation, whic h helps us to discriminate among differen t clusters. These histograms are constructed by counting the p olarities (in vertical direction) w.r.t. eac h attribute (in horizontal direction). The color of the bars resembles the color of p olarities. Fig. 5.1 illustrates an example of a histogram which is con- OPINION MINING FROM TWITTER DA T A 25 Sark ozy after election − g1 (siz e: 1270) Frequency 0 50 100 150 200 250 300 350 Attribute Balance sheet Communication Entity Ethic Injunction None P erson P olitical line Project Skills 0 50 100 150 200 250 300 350 54 78 27 27 94 22 39 88 96 109 22 38 29 31 27 40 26 30 21 30 − 2 − 1 0 1 2 NULL Fig 5.1 . Il lustr ation of the clustering r esults using a histo gr am c onstructe d fr om the p o- larities of differ ent asp e cts. The asp e cts ar e or der e d fr om left to right as: (1) Attribute; (2) Balance sheet; (3) Communic ation; (4) Entity; (5) Ethic; (6) Injunction; (7) None; (8) Person; (9) Politic al line; (10) Pr oje ct and (11) Skil ls. The p olarities ar e c olor e d and or der e d fr om b ottom to top as: -2 (dark blue), -1 (blue), 0 (light or ange), 1 (or ange), 2 (r e d) and NULL (gr ey). structed from the tw eets of a cluster from time t 2. F ollo wing this illustration, in Fig. 5.2 and 5.3 , let us lo ok at the examples of the clusters at different time ep o c hs for the entities NS and FH respectively . These results are ob- tained b y clustering data using PLMM method with K = 3. F rom both figures we observ e that, at eac h time epo c h the clusters ha ve differen t his- togram represen tations. Moreo ver, during differen t time ep o chs each cluster undergo es certain amount of c hanges in differen t attributes and asso ciated p olarities. This demonstrates that the prop osed PLMM metho d is able to pro vide sufficient inter-cluster v ariations (at each time) while resp ecting the temp oral dynamics (for eac h cluster during different time ep o ch s). An alternative and compact represen tation (w.r.t. the MM mo del param- eters) of the clusters for NS is illustrated in Fig. 5.4 (a) and 5.4 (b). Simi- lar to the examples of Fig. 5.2 , this alternativ e represen tation demonstrate that, at a certain time ep o ch different cluster emphasizes on different as- 26 HASNA T ET AL. p ects/p olarities of an en tity . Besides, the temporal c hanges of the clusters can b e identified subsequently during different ep o c hs by observing the in- crease/decrease of the probabilities. Ho w ever, from the user’s p ersp ective, this represen tation may not b e con v enient to understand. Therefore, we use histograms for further analysis and use this compact representation for a differen t purp ose. No w, let us explain the seman tics obtained from these clustering results. F or brevit y , here we denote a cluster as cl. . F rom Fig. 5.2 (clusters for NS) w e see that, while cl. 1 and 3 emphasize on the negative (-) and p ositive (+) p olarities resp ectively , cl. 2 emphasizes on a particular attribute. Naively w e can sa y that, there are three groups of p eoples: (a) the first group ( cl. 1) pro vides negativ e opinions from v arious asp ects, thus tends to hold a negativ e image ab out the entit y; (b) the second group ( cl. 2) particularly emphasizes on Ethic of the entit y and mostly provide negative opinions and (c) the third group ( cl. 3) can b e seen as a contrary to the first group ( cl. 1) as it tends to hold a p ositive image ab out the entit y . T able 6 pro vides three examples of the t w eets for time t 1 and for eac h cluster ab out NS. W e can realize that these t w eets reflect the opinions which truly corresp ond to the groups obtained by the clustering metho d. F rom temp oral viewp oint, we observe several c hanges w.r.t. differen t as- p ects. In order to analyze the changes using histograms, we observ e the heigh t of histogram bar for eac h asp ect. This height indicates the n um b er of tw eets/opinions corresp onding to the related asp ect. Let us consider an example of the asp ect Communic ation which pla ys a certain role on clus- tering. W e observ e that: (a) for cl. 1, the total num ber of t w eets related to the asp ect Communic ation remains same during time t 1 and t 2 and reduces during t 2 and t 3; (b) for cl. 2, the total num ber of tw eets related to this asp ect reduces con tin uously and (c) for cl. 3, the total n umber of t w eets related to this asp ect reduces from t 1 to t 2 and remains same during t 2 to t 3. Moreov er, a closer lo ok on cl. 3 from t 2 to t 3 reveals an increase of p osi- tiv e opinions ab out the c ommunic ation skill of the en tity . Another example is the asp ect called A ttribute , whose height reduces con tin uously with time for b oth cl. 1 and 3. Similarly , from an analysis of the heigh t of histogram bars in Fig. 5.3 (clusters for FH) we see that, the asp ects called Entity , Ethic , Politic al line , Skil ls and Communic ation pla y certain role to describ e the image of FH. F or example, the tw eet - Hol land would r emove the wor d “r ac e” in the Constitution (orig: Hol lande supprimer ait le mot “r ac e” dans la Constitution) from time t 1 and cl. 3 is annotated with the asp ect called p olitic al line and polarity +1 . Another t weet - Hol land and Netanyahu evoke the struggle against anti-Semitism (orig: Hol lande et Netanyahou ´ evo quent OPINION MINING FROM TWITTER DA T A 27 Sark ozy after election − g1 (siz e: 808) Frequency 0 50 100 150 200 250 Attribute Balance sheet Communication Entity Ethic Injunction None Person Political line Project Skills 0 50 100 150 200 250 40 32 121 26 159 11 16 31 27 17 103 18 57 13 13 46 − 2 − 1 0 1 2 NULL t1 t2 t3 Cl. 1 Cl. 2 Cl. 3 Fig 5.2 . Il lustr ation of the clustering r esults fr om PLMM metho ds for NS. R esults obtaine d using K = 3 for thr e e time ep o chs t 1 , t 2 and t 3 . Each cluster is r epr esente d as a histo gr am c onstructe d fr om the p olarities of differ ent asp e cts. The asp e cts ar e or der e d fr om left to right as: (1) Attribute; (2) Balanc e she et; (3) Communic ation; (4) Entity; (5) Ethic; (6) Injunction; (7) None; (8) Person; (9) Politic al line; (10) Pr oje ct and (11) Skil ls. The p olarities ar e c olor e d and or dere d from b ottom to top as: -2 (dark blue), -1 (blue), 0 (light or ange), 1 (or ange), 2 (r e d) and NULL (gr ey). Each c olumn r epr esents clusters fr om a p articular ep o ch. Each r ow repr esents a p articular cluster in different ep o chs. 28 HASNA T ET AL. Fig 5.3 . Il lustr ation of the clustering r esults fr om PLMM metho ds for FH. Results obtaine d using K = 3 for thr e e time ep o chs t 1 , t 2 and t 3 . Each cluster is r epr esente d as a histo gr am c onstructe d fr om the p olarities of differ ent asp e cts. The asp e cts ar e or der e d fr om left to right as: (1) Attribute; (2) Balanc e she et; (3) Communic ation; (4) Entity; (5) Ethic; (6) Injunction; (7) None; (8) Person; (9) Politic al line; (10) Pr oje ct and (11) Skil ls. The p olarities ar e c olor e d and or dere d from b ottom to top as: -2 (dark blue), -1 (blue), 0 (light or ange), 1 (or ange), 2 (r e d) and NULL (gr ey). Each c olumn r epr esents clusters fr om a p articular ep o ch. Each r ow repr esents a p articular cluster in different ep o chs. OPINION MINING FROM TWITTER DA T A 29 la lutte c ontr e l’antis ´ emitisme) has the same annotation whic h is from the same cluster but from time t 3. These t wo examples rev eal the imp ortance of the asp ect p olitic al line for k eeping the similar opinions into the same group at different time. The ab o v e observ ations clearly indicate that, for different groups of p eople different asp ects has certain imp ortance at different time. Therefore, an analyst can retriev e the most prominen t asp ects from p eople’s opinion ab out an en tity at a particular time or within a certain range of time p erio ds. Besides the abov e interpretation of the clustering results, an analyst can obtain more information from the PLMM clustering results via the link parameters ( δ k,d or γ k,d ). After analyzing the links among MM parameters w e notice that they are able to provide a compact explanation ab out the temp oral changes during tw o time ep o c hs. Fig. 5.4 illustrates an example for en tit y NS from time t 1 to t 2 with 3 clusters, see column 1 and 2 of Fig. 5.2 for corresp onding histograms. Fig. 5.4 (a) and Fig. 5.4 (b) illustrates the MM parameters (probability of asp ect-p olarity features) and Fig. 5.4 (c) pro vides a compact representation ab out the cluster ev olutions using the v alues of δ k,d . T o b etter understand this represen tation in Fig. 5.4 (c), we transform the link v alues as 0 (no change), -1 ( δ k,d < 0 . 9, b elief increases) and +1 ( δ k,d > 1 . 1, b elief decreases). In the con text of the examples from the IW-POD, we can explain b elief as: probability of a feature at time t + 1 is increased from its probabilit y at time t . Therefore, the b elief indicates the relativ e significance of a particular feature w.r.t. time. An increase in the b elief means that users tend to b e more attracted by it. F ollowing this, if a feature probability is nearly same at tw o different times then b elief remains unc hanged. In Fig. 5.4 , we highlight the effect of a particular asp ect, called Communic ation ( Com ), and observ e its contribution for cluster ev olution. F rom Fig. 5.4 (a) and (b) w e see that, from time t 1 to t 2 the probabilities are decreased mostly for cl. 2 and 3. This means that, either the users from these clusters lo ose interest to discuss ab out Com and fo cus on other asp ects, or those users disapp eared at time t 2. Similar to Com , w e can observ e other asp ects suc h as Eth ( cl. 1 and cl. 3) and Ent ( cl. 2 and cl. 3) whic h causes cluster evolution in this example of Fig. 5.4 . Let us analyze examples from real twitter data and observe them w.r.t. the Fig. 5.4 . If we lo ok at cl. 3 at time t 1 (b efore election), the most lik ely features are often positive and it is clear that it gathers people in fa v or of NS. The prominent asp ects are Att (p ositive and neutral), Ent (p ositive) and Inj (p ositive), such as in the tw eet - 40 p e ople @youngp op44 wil l b e pr esent at the gr e at gathering in Plac e #Conc or de for supp orting @Nic olasSarkozy ! #Str ongF r anc e #NS2012” . This cluster slightly changes later at time t 2 30 HASNA T ET AL. T able 6 R e al twitter data examples of the 3 clusters at time t 1 for entity NS. Se e Fig. 5.2 c olumn 1 for the asso ciate d histo gr ams. Cluster 1 (Gener al ly Ne gative) Ex. 1 Orig: Il veut desr´ ef ´ erendums car... y a pas de pilote dans l’avion, dit-il: quel av eu! #Sarkozy#pro jet T rans: He wan ts referendum b ecause. . . there is no pilot in the plane he says: what a confession! #Sark ozy#pro ject Ex. 2 Orig: Je ne v oterais pas #Sark ozy ! ” ” Je ne voterais pas #Sark ozy ! T rans: I won’t v ote for #Sarkozy !” ” I won’t v ote for #Sarkozy Ex. 3 Orig: Nicolas Sarkozy , le plus mauv ais pr´ esiden t de la V` eme R´ epublique T rans: Nicolas Sarkozy , the w orst president of the Fifth Republic Cluster 2 (Ne gative, sp e cial ly ”Ethic”) Ex. 1 Orig: Jamais un pr ´ esiden t n’a ´ et´ e cern´ e par tant d’affaires! demain ds @lematinc h #Bettencourt #Sark ozy T rans: Nev er b efore a presiden t was surrounded by so many cases!” tomorrow in @lematinc h #Bettencourt #Sark ozy Ex. 2 Orig: Une liste de condamn´ es de l’#UMP qui p ourrait ˆ etre bientˆ ot compl ´ et ´ ee par les noms de #Sark ozy , #Cop´ e, #W o erth T rans: A list of convicted p eople of #UMP so on completed b y names such as #Sark ozy , #Cop´ e, #W o erth (the “Bettencourt case” is a famous case in which Sarkozy w as inv olv ed) Ex. 3 Orig: Sarkozy-Kadhafi: la preuve du financement. Et l’urgence d’une enqu ˆ ete officielle #affairedetat T rans: Sark ozy-Kadhafi: the pro of of funding. And the urge of an official enquiry #stateaffair (Kadhafi is another case in which Sarkozy w as inv olv ed in some wa y) Cluster 3 (Gener al ly Positive) Ex. 1 Orig: N Sarkosy mots cl´ e..challenge, d ´ efi, action, trav ail, r´ eussite, formation, effort, individualisation ..F rance F orte. Europe F orte #NS2012 T rans: N Sarkozy k eyw ords..challenge, d ´ efi, action, work, success, training, effort, individualization ..Strong F rance. Strong Europ e #NS2012 Ex. 2 Orig: merci N.Sarkozy p our tout tu restera p our toujour mon Hero merci. merci T rans: Thank you N.Sark ozy for all y ou will sta y my hero forever thanks. thanks Ex. 3 Orig: Sarko est plus rationnel.. T rans: Sark o is more rational.. OPINION MINING FROM TWITTER DA T A 31 Fig 5.4 . Example of evolution interpr etation using link p ar ameter δ k,d for NS during t1 to t2 with 3 clusters. (a) MM p ar ameters µ t 1 k,j at time t1 (b) MM p ar ameters µ t 2 k,j at time t2 (c) Link p ar ameters δ k,j b etwe en time t1 and t2. In (c), for e ach cluster (r ow-wise), brighter/white c olor indic ates the prior b elief ab out fe atur es (asp ect-p olarity) incr e ases, darker/black c olor indic ates the prior b elief ab out fe atur es de cr e ases and gr ey c olor indic ates the prior b elief ab out fe atur es remains same. 32 HASNA T ET AL. (just after election) tow ards A tt (p ositive), Ent (p ositive) and Bal (p ositive). The shift from Inj to Bal is clearly visible on Fig. 5.4 (c), third row: blac k color for Inj means a decrease of atten tion whereas white color for Bal means there are relativ ely more comments on the balance sheet of NS. Hence, the follo wing message sho ws some nostalgia felt by man y militants: Whatever the opinion of FH, NS has b e en a gr e at pr esident. FH c an de c onstruct al l the r eforms, we wil l never for get! . T o sum up, the δ parameter helps us to fo cus on what are the main changes, ev en though the observ ation could ha ve been dra wn among the other asp ects. F ollo wing the same reasoning, all p olarities targeting the asp ect Com are black, which prov es that the p erformances of the p olitician in the media (e.g., TV, newspapers) are less imp ortant once the election is ov er. Observ ations from numerous exp erimen ts rev eal that, b esides p erforming ev olutionary clustering on the temp oral data, PLMM also pro vide reasonable in terpretation for the evolutions, thanks to the link parameters. Indeed, this clearly distinguishes PLMM from the rest of the state-of-the-art methods. Moreo v er, we notice that the interpretabilit y of PLMM (using Eq. 3.9 , 3.10 and 3.11 ) can b e separated out and externally plugged in with the results from any other discrete data clustering metho ds. 6. Conclusion and F uture P ersp ectiv es. Ov er the years, a large n um b er of temp oral data analysis metho ds hav e b een prop osed in sev eral domains. In this pap er, we only focused on the particular clustering methods whic h ha v e b een used for discrete data clustering and whic h are based on the assumption of the Multinomial distribution. W e proposed an unsup ervised method (i.e., no training from labeled data) for analyzing the temp oral data. The core element of our prop osal is the form ulation of parametric links among the m ultinomial distributions. Com- putations of these links naturally cluster the evolutionary/temporal data. F urthermore, these links can provide in terpretation for cluster evolution and also detect clusters evolution in certain cases. F or exp erimen tal v ali- dation, w e extensively used syn thetic dataset and ev aluated using the A d- juste d R and Index . As a practical application, w e applied it on a dataset of p olitical opinions and ev aluated using Perplexity measure. Results sho w that the prop osed metho d, called PLMM, is b etter than the state-of-the-art. Moreo v er, it provides an additional adv an tage through the link parameters in order to in terpret the c hanges in clusters at different time. W e also pro- vide an e xtension of the prop osed metho d for dealing with v arying n um b er of clusters which is not addressed by most of the recen t metho ds. Monitoring/trac king cluster evolution is an in teresting issue which w e do OPINION MINING FROM TWITTER DA T A 33 not explicitly and extensively manage in our prop osed method, b ecause it is not a primary ob jective in this pap er. Y et, we can partially achiev e this task b y using certain information (parametric sub-mo dels, see 3.4 ) whic h are naturally integrated with our prop osed method. That means, our prop osed metho d can b e used only as a detector of cluster ev olution. A t presen t, w e consider the complete monitoring task as a future w ork. W e b eliev e that, an extension of sev eral existing work can be added with our method to com- pletely deal with this issue. F or example, w e can exploit 7 MEC ( Oliv eira and Gama , 2010 ) whic h is a cluster evolution monitoring metho d for contin uous data. Besides, we can use lab el-b ase d diachr onic appr o ach ( Lamirel , 2012 ) b y externally providing our clustering results as an input to it. Computational complexit y is a concern for the prop osed metho d and can b e considered as a limitation. F rom a decomp osition of the computational time, we observ e that most of the time is consumed by the optimization pro cedure ( nelderme ad simplex metho d). In future, a b etter optimization metho d can b e incorporated to address this issue. Moreo v er, the time can b e further reduced by eliminating the parametric sub-mo dels which are ex- p erimen tally found as redundan t. Although we demonstrated the effectiveness of the prop osed metho d only for p olitical opinion dataset, we b eliev e that it will b e equally effectiv e for differen t datasets that consist of the form of categorical data. References. A gresti, A. (2002). Cate goric al data analysis , 2nd ed. John Wiley & Sons. Baudr y, J.-P. and Celeux, G. (2015). EM for mixtures-Initialization requires sp ecial care. Statistics and Computing 25 713-726. Beninel, F. , Biernacki, C. , Bouveyron, C. , Ja cques, J. and Lourme, A. (2012). Par ametric link mo dels for know le dge tr ansfer in statistical le arning. Know le dge T r ans- fer: Pr actic es, T yp es and Chal lenges . Nov a Science Publishers. Biernacki, C. , Beninel, F. and Bret a gnolle, V. (2002). A generalized discriminant rule when training p opulation and test p opulation differ on their descriptive parameters. Biometrics 58 387–397. Biernacki, C. , Celeux, G. and Go v aer t, G. (2000). Assessing a mixture model for clustering with the in tegrated completed lik eliho o d. IEEE TP AMI 22 719–725. Biernacki, C. , Celeux, G. and Gov aer t, G. (2003). Cho osing starting v alues for the EM algorithm for getting the highest likelihoo d in multiv ariate Gaussian mixture mod- els. Computational Statistics & Data Analysis 41 561–575. Biernacki, C. , Celeux, G. , Go v aer t, G. and Langrognet, F. (2006). Mo del-based cluster and discriminant analysis with the MIXMOD softw are. Computational Statistics & Data A nalysis 51 587–600. 7 W e conducted some initial exp eriments and found that this approach is applicable up to certain extent and should b e further improv ed to use in our case, e.g., extend it with appropriate distance computation (e.g., using sKLD). 34 HASNA T ET AL. Bishop, C. M. et al. (2006). Pattern re c o gnition and machine le arning 4 . springer New Y ork. Blei, D. M. and Laffer ty, J. D. (2006). Dynamic topic mo dels. In Pr o c. of the Int Conf on Machine L e arning 113–120. ACM. Blei, D. M. , Ng, A. Y. and Jordan, M. I. (2003). Laten t diric hlet allo cation. Journal of Machine L e arning R ese ar ch 3 993–1022. Chakrabar ti, D. , Kumar, R. and Tomkins, A. (2006). Evolutionary clustering. In Pr o c e e dings of the 12th ACM SIGKDD international c onfer enc e on Know le dge disc overy and data mining 554–560. ACM. Chi, Y. , Song, X. , Zhou, D. , Hino, K. and Tseng, B. L. (2009). On evolutionary sp ectral clustering. ACM T r ans. on Know le dge Disc overy fr om Data 3 17. Dubey, A. , Hefny, A. , Williamson, S. and Xing, E. P. (2013). A Nonparametric Mixture Mo del for T opic Mo deling ov er Time. In SDM 530–538. SIAM. Ferlez, J. , F aloutsos, C. , Lesk ovec, J. , Mladenic, D. and Grobelnik, M. (2008). Monitoring netw ork evolution using MDL. In IEEE Int. Conf. on Data Engine ering 1328–1330. IEEE. Figueiredo, M. A. T. and Jain, A. K. (2002). Unsup ervised learning of finite mixture mo dels. IEEE TP AMI 24 381–396. Fraley, C. and Rafter y, A. E. (2002). Mo del-based clustering, discriminant analysis, and density estimation. Journal of the Americ an Statistic al Asso ciation 97 611–631. Garcia, V. and Nielsen, F. (2010). Simplification and hierarchical representations of mixtures of exp onential families. Signal Pr o c essing 90 3197–3212. Hasna t, M. A. , Ala t a, O. and Tr ´ emeau, A. (2015). Mo del-based hierarchical cluster- ing with Bregman divergences and Fishers mixture mo del: application to depth image analysis. Statistics and Computing 1-20. Hasna t, M. A. , Velcin, J. , Bonnev a y, S. and Jacques, J. (2015). Sim ultaneous Clus- tering and Model Selection for Multinomial Distribution: A Comparative Study. In A dvanc es in Intel ligent Data Analysis XIV Springer. Huber t, L. and Arabie, P. (1985). Comparing partitions. Journal of classific ation 2 193–218. Jacques, J. and Biernacki, C. (2010). Extension of mo del-based classification for binary data when training and test p opulations differ. Journal of Applie d Statistics 37 749– 766. Kharra tzadeh, M. , Renard, B. and Coa tes, M. (2015). Bay esian topic mo del ap- proac hes to online and time-dep endent clustering. Digital Signal Pr o c essing . Kim, Y.-M. , Velcin, J. , Bonnev a y, S. and Rizoiu, M.-A. (2015). T emp oral Multino- mial Mixture for Instance-Oriented Evolutionary Clustering. In Pr o c. of the Eur op e an Confer enc e on Information R etrieval 593–604. Kruskal, J. B. and Wish, M. (1978). Multidimensional sc aling 11 . Sage. Lamirel, J.-C. (2012). A new approach for automatizing the analysis of research topics dynamics: application to optoelectronics research. Scientometrics 93 151–166. Li, P. , Wu, X. and Hu, X. (2012). Mining recurring concept drifts with limited lab eled streaming data. ACM T r ansactions on Intel ligent Systems and T e chnolo gy (TIST) 3 29. McLachlan, G. J. and Krishnan, T. (2008). The EM algorithm and extensions , 2. ed ed. Wiley series in pr ob ability and statistics . Wiley . Meil ˘ a, M. and Heckerman, D. (2001). An exp erimental comparison of model-based clustering metho ds. Machine L e arning 42 9–29. Melnyko v, V. and Maitra, R. (2010). Finite mixture models and mo del-based cluster- ing. Statistics Surveys 4 80–116. OPINION MINING FROM TWITTER DA T A 35 Murphy, K. P. (2012). Machine le arning: a prob abilistic p ersp ective . The MIT Press. Nelder, J. A. and Mead, R. (1965). A simplex metho d for function minimization. The c omputer journal 7 308–313. Oliveira, M. D. and Gama, J. (2010). MEC-Monitoring Clusters’ T ransitions. In ST AIRS 212–224. Sal v ador, S. and Chan, P. (2004). Determining the num ber of clusters/segmen ts in hierarc hical clustering/segmen tation algorithms. In IEEE Conf. on T ools with A rtificial Intel ligenc e 576–584. Schw arz, G. et al. (1978). Estimating the dimension of a model. The Annals of Statistics 6 461–464. Sil vestre, C. , Cardoso, M. G. and Figueiredo, M. A. (2014). Iden tifying the n umber of clusters in discrete mixture mo dels. arXiv pr eprint arXiv:1409.7419 . Spiliopoulou, M. , Ntoutsi, I. , Theodoridis, Y. and Schul t, R. (2006). MONIC: mo deling and monitoring cluster transitions. In Pr o c. of the ACM SIGKDD Int c onf. on Know le dge disc overy and data mining 706–711. ACM. Velcin, J. , Kim, Y. , Brun, C. , Dormagen, J. , SanJuan, E. , Khouas, L. , Per- adotto, A. , Bonnev a y, S. , Roux, C. , Boy adjian, J. et al. (2014). Inv estigating the Image of Entities in Social Media: Dataset Design and First Results. In Pr o c. of L anguage R esour c es and Evaluation Confer enc e (LREC) . Xu, K. S. , Kliger, M. and Hero Ii i, A. O. (2014). Adaptive evolutionary clustering. Data Mining and Know le dge Disc overy 28 304–336. Xu, T. , Zhang, Z. , Yu, P. S. and Long, B. (2008). Dirichlet pro cess based ev olutionary clustering. In Data Mining, 2008. ICDM’08. Eighth IEEE International Confer enc e on 648–657. IEEE. Xu, T. , Zhang, Z. , Yu, P. S. and Long, B. (2012). Generative models for evolutionary clustering. ACM T rans. on Know le dge Discovery fr om Data 6 7. Ypma, J. (2014). In tro duction to nloptr: an R interface to NLopt. Zhong, S. and Ghosh, J. (2005). Generative mo del-based do cument clustering: a com- parativ e study. Know le dge and Information Systems 8 374–384.
Original Paper
Loading high-quality paper...
Comments & Academic Discussion
Loading comments...
Leave a Comment