Detecting Community Structures in Hi-C Genomic Data
Community detection (CD) algorithms are applied to Hi-C data to discover new communities of loci in the 3D conformation of human and mouse DNA. We find that CD has some distinct advantages over pre-existing methods: (1) it is capable of finding a var…
Authors: Irineo Cabreros, Emmanuel Abbe, Aristotelis Tsirigos
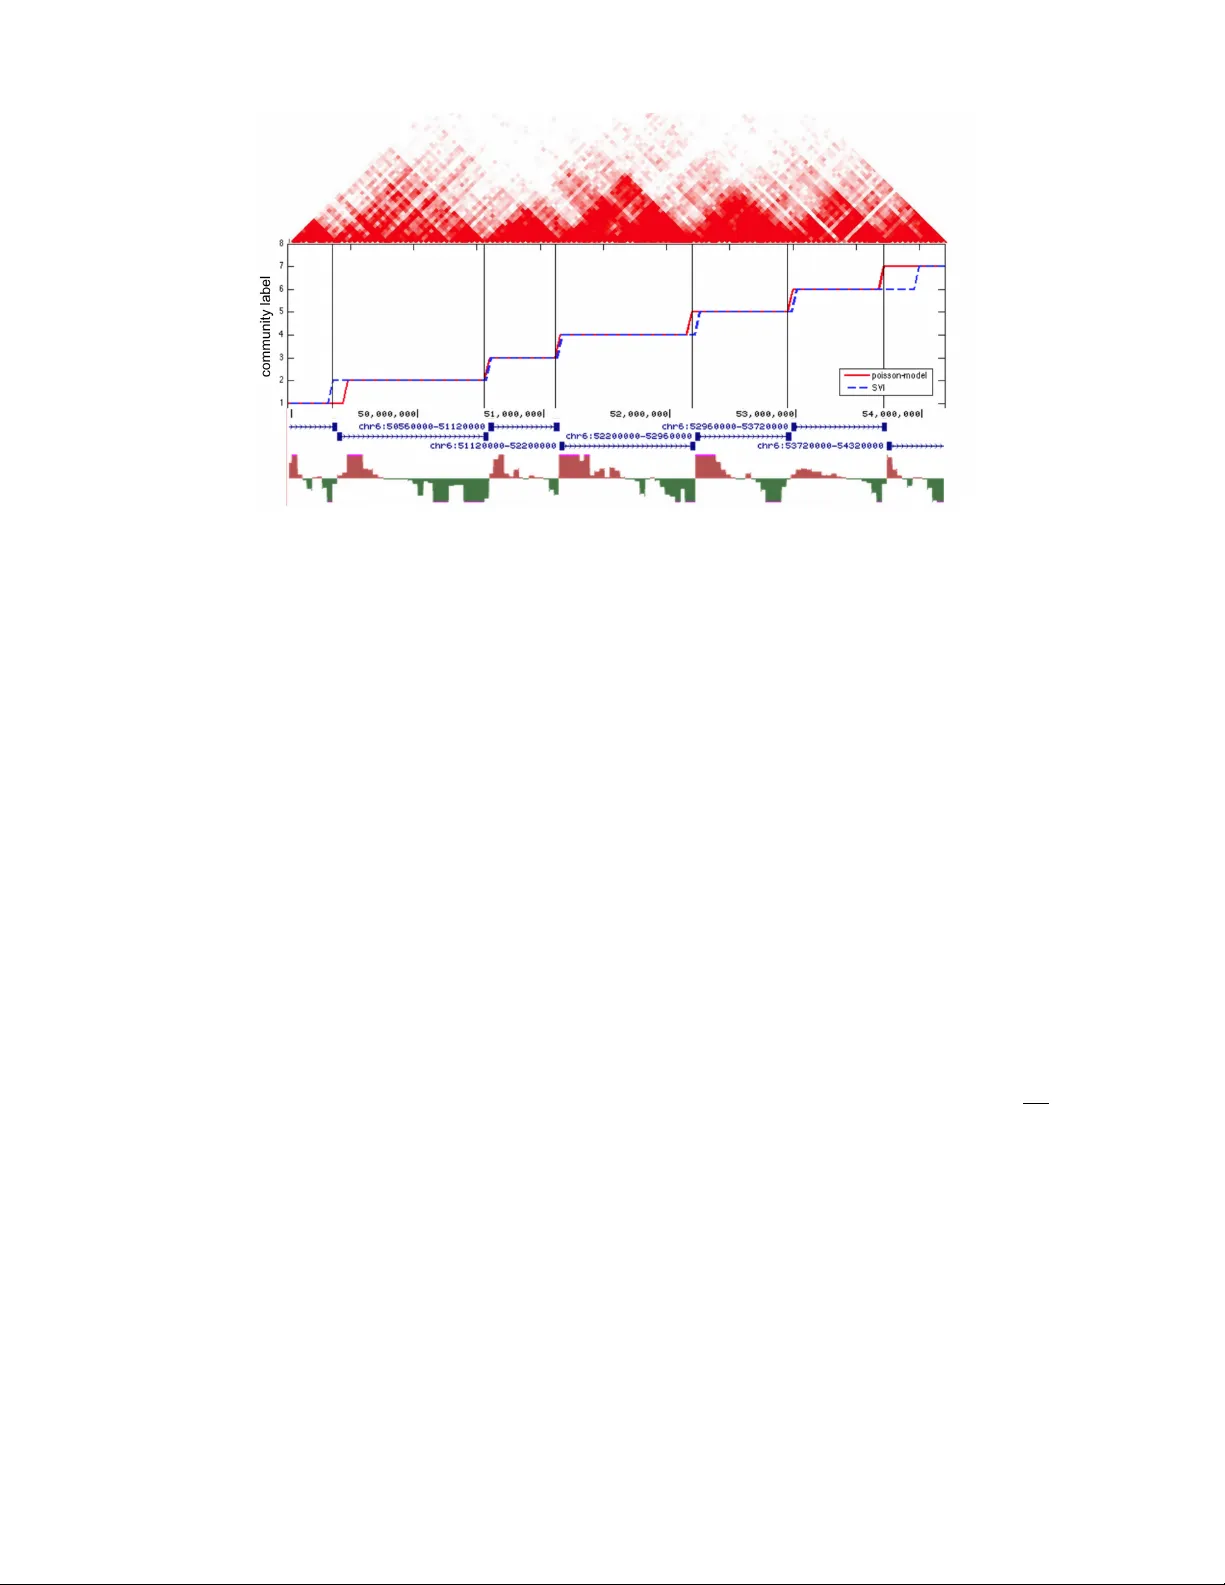
Detecting Comm unit y Structures in Hi-C Genomic Data Irineo Cabreros ∗ Emman uel Abb e † Aristotelis Tsirigos ‡ Abstract Comm unity detection (CD) algorithms are applied to Hi-C data to discov er new commu- nities of lo ci in the 3D conformation of human and mouse DNA. W e find that CD has some distinct adv antages o ver pre-existing metho ds: (1) it is capable of finding a v ariable num b er of comm unities, (2) it can detect communities of DNA lo ci either adjacen t or distant in the 1D sequence, and (3) it allows us to obtain a principled v alue of k , the n umber of comm uni- ties present. F orcing k = 2, our metho d reco v ers earlier findings of Lieb erman-Aiden, et al. (2009), but letting k b e a parameter, our metho d obtains as optimal v alue k ∗ = 6, disco vering new candidate comm unities. In addition to disco vering large comm unities that partition en tire c hromosomes, we also sho w that CD can detect small-scale top ologically asso ciating domains (T ADs) suc h as those found in Dixon, et al. (2012). CD th us provides a natural and flexible statistical framew ork for understanding the folding structure of DNA at multiple scales in Hi-C data. 1 In tro duction The 3D conformation of DNA pla ys a vital role in gene regulation through many v aried mech- anisms [1]. F or example, genes may b e silenced or expressed dep ending on whether they are p ositioned in tigh tly pac k ed (closed) or lo osely pac ked (op en) regions since exp osure to tran- scriptional machinery influences transcriptional rates. As another example, sev eral studies rep ort examples of enhancers p ositioned up to a megabase aw ay from their target genes nev- ertheless capable of mo dulating transcription rates [2, 3, 4]. This scenario is thought to b e explained by chromatin lo oping even ts that p osition distan t elements in the 1D sequence in close proximit y in the full 3D conformation [5]. F eatures of the 3D conformation of DNA hav e b een shown to b e highly conserved ev olutionarily and it has even b een demonstrated that some chromatin structures are heritable indep endent of DNA sequence itself [6]. F urthermore, the 3D conformation of DNA is of direct clinical imp ortance as defects in chromatin structure ha ve b een iden tified with premature aging, limb malformation, and cancer [7, 8, 9]. Though it is currentl y not possible to directly observ e the 3D folding structure of DNA, this w ork sho ws that communit y detection tec hniques can b e applied to Hi-C data to find clusters of loci 1 that are pro ximal in the 3D conformation of DNA. Hi-C is a recently developed method that indirectly captures information about the 3D conformation of DNA b y observing genome- wide chromatin interactions using a tec hnique of spatially constrained ligation in conjunction ∗ Program in Applied and Computational Mathematics, Princeton Universit y . Email: cabreros@princeton.edu † Program in Applied and Computational Mathematics, and Department of Electrical Engineering, Princeton Univ ersit y . Email: eabb e@princeton.edu ‡ Departmen t of Pathology , NYU Langone Medical Center. Email: Aristotelis.Tsirigos@nyumc.org 1 By “loci,” we refer segmen ts of base pairs that are adjacen t in the 1D DNA sequence. Different Hi-C tec hnologies ha v e different scales of resolution ranging from ∼ 1 Mbp to ∼ 10 kbp [10, 11]. 1 with massively parallel sequencing [10]. The output of this pro cess is a square matrix X whose ( i, j ) elemen t is the num b er of ligation ev ents observed b et ween segment i and segment j . This matrix can b e interpreted as a w eigh ted, undirected adjacency matrix of a graph whose no des represent individual DNA segments. Previous tec hniques to detect cluster the Hi-C connection matrix are catered to finding either (1) t w o large compartmen ts [10] (whic h t ypically corresp ond to op en and closed “sectors” of DNA) each of which are fragmen ted throughout an entire c hromosome or (2) an indeterminate n umber of clusters of adjacen t DNA called “top ologically asso ciating domains” (T ADs) [11, 12] 2 . W e prop ose the use of comm unity detection tec hniques as a m uch more flexible approac h to finding a v ariable n um b er comm unities b y fitting statistical mo dels of mixed-mem b ership netw orks. Detecting comm unities (or clusters) in graphs is a fundamental and long studied problem in com puter science and machine learning. The techniques apply to a large v ariet y of complex net works, such as so cial or biological net w orks, or to data sets engineered as netw orks via graphs of similarity . Extracting communities in net works has b een used in particular to find lik e-minded p eople in so cial netw orks [13, 14], to p erform recommendations [15], to segment or classify images [16, 17], to detect protein complexes [18, 19], to find genetically related sub-p opulations [20, 21], to disco ver new tumor sub classes [22], among other applications [23, 24, 25]. This pap er introduces the use of communit y detection metho ds to the net w ork obtained from the Hi-C con tact matrices, extracting communities b y fitting probabilistic mo dels suc h as mixed-mem b ership sto chastic block mo dels [26] and P oisson mo dels [27]. W e refer to App endix A for a more detailed description of the mo dels. In short, these are extensions of the standard sto c hastic blo ck mo del, introduced in [28], whic h assigns to each v ertex in the netw ork a comm unity v ariable that affects the edge probabilities. The data analyzed in this work are from Lieb erman-Aiden, et al. [10] and Dixon, et al. [11]. W e fo cus primarily on data from the former and study in particular chromosome 14 from the h uman cell line GM06990. F rom the latter, w e study a segment of c hromosome 6 from a mouse em bry onic stem cell line. Tw o algorithms are applied to these data and show results consisten t with previous findings while prop osing no vel comm unities at previously unexamined scales. The first algorithm (developed b y P . Gopalan and D.M. Blei) uses sto chastic v aria- tional inference on a mixed-mem b ership sto c hastic block (MMSB) mo del [26] and the second (dev elop ed by B. Ball, B. Karrer, and M. E. J. Newman) is an exp ectation-maximization algo- rithm applied to a Poisson mo del for netw ork generation [27]. Both algorithms are describ ed in further detail in App endix A. 2 Ov erview of our con tribution In this w ork, we introduce the application of comm unity detection techniques to Hi-C data to disco v er no v el chromatin structures in the 3D conformation of DNA. Below we outline the program of this pap er: 2 W e note that while this work was in progress, an indep endent parallel work suggested applying sev eral standard clustering metho ds (HMM, k-means, and hierarchical clustering) whic h are also capable of finding a v ariable n um b er of communities [30]. Though the precise connection b et ween these findings and our own is not fully examined, w e briefly note some prominent differences here. First, clustering metho ds are applied to a matrix C which is a highly mo dified version of the original con tact matrix. By contrast, our metho d applies directly to the thresholded connection matrix. Second, our metho d for selecting k ∗ = 6 is quite different from theirs, which relies both on the Ak aik e Information Con tent to suggest a range of viable k along with visual insp ection. Finally , our metho d directly fits a statistical netw ork mo del that closely mirrors the physical net work of in terconnected DNA lo ci underlying Hi-C data; individual lo ci b elong to (p oten tially m ultiple) comm unities and probabilistically undergo ligation even ts (i.e. form an edge) with members of their communities during the Hi-C pro cedure. 2 Figure 1: Communit y assignment matrix for k = k ∗ = 6. Eac h row of this matrix represents a comm unity and the columns index genome position. An elemen t ( i, j ) of this matrix is b eige if the CD algorithm identifies locus j as ha ving maximal membership to comm unity i and is red otherwise. • W e first show that CD offers a unified method that is capable of repro ducing the results of tw o previous techniques tailored to identifyin g particular t yp es of comm unities. – Section 3.1 shows that CD finds t wo large, genome-wide compartments of op en and closed chromatin first iden tified in the w ork of Lieb erman-Aiden, et al. – Section 3.2 w e show that CD is capable of discov ering top ologically associating do- mains (T ADs): highly lo calized comm unities of a muc h smaller scale than compart- men ts. An underlying message of b oth 3.1 and 3.2 is that the results app ear to b e robust to the particular CD algorithm used; b oth the MMSB algorithm and P oisson algorithm conv erge to either iden tical or very similar results. • In section 3.3, w e exploit the flexibility of CD to disco ver new comm unit y structures. In particular, we introduce tw o different approac hes to address the mo del selection prob- lem of c ho osing k and show that, in conjunction, they suggest the distinguished v alue k ∗ = 6 for c hromosome 14 of cell line GM06990 (a c hromosome focused on in the pap er b y Lieb erman-Aiden, et al.). Fig. 1 shows the communit y assignment matrix for this c hromosome for k = 6 and we note that it con tains b oth lo cally interacting (comm unities 2 and 4) as w ell as non-lo cally in teracting (comm unities 1, 3, 5, and 6) clusters of DNA lo ci. 3 Results 3.1 CD algorithms successfully iden tify non-lo cal compartments The analysis of Lieb erman-Aiden et al. suggests that the DNA within a single c hromosome is divided into tw o separate “compartments” [10]. In order to find these compartments, the authors first normalized the observed Hi-C contact matrix (by dividing the counts of eac h matrix elemen t ( i, j ) b y the chromosome-wide expected num b er of counts at a distance | i − j | ), 3 then computed the Pearson correlation matrix of the resultan t matrix, and finally p erformed principal comp onen t analysis (PCA) on this matrix. The first principle comp onent of the correlation matrix was then used to partition the c hromosome into tw o compartments: the first compartment defined by the loci with a p ositive co efficien t in the first principle component and the second compartmen t defined b y the lo ci with a negativ e co efficient in the first principle comp onen t. The resultant compartmen ts displa yed sev eral consistent biological c haracteristics. The first compartmen t corresponds to more gene-rich p ortions of the chromosome and higher expression lev els. Consisten t with the in terpretation that DNA within the first compartment is more accessible (i.e. has a more “op en” conformation), DNA within the first compartment w as also found to hav e a significantly lo w er interaction frequency than DNA within the second compartmen t. Although the analysis of Lieb erman-Aiden et al. w as v ery successful in identifying a bio- logically relev ant partition of DNA, it has some disadv antages to the CD algorithms discussed in this pap er. First, the underlying mo del of the CD algorithms lends a more straightfor- w ard statistical interpretation than the pro cedure used by Lieb ermann-Aiden et al.; where the former seeks MLE estimates of parameters of a well-defined statistical netw ork mo del that closely mirrors the physical scenario, it is not ob vious what assumptions are required for the mo dified PCA pro cedure to yield a v alid partitioning of the c hromosome. While the steps of the pro cedure utilized by Lieb erman-Aiden et al. are motiv ated by their ability to create clear “plaid” patterns in the connection matrix (see Fig. 12), it is not obvious a priori why this should be a desirable goal in the first place. Second, it is unclear ho w to generalize the PCA pro cedure to find more than t w o comm unities whereas b oth CD algorithms can be set to find an arbitrary num b er of communities. Fig.2 compares the result of the CD algorithm with the first principle comp onen t of c hromosome 14 (h uman DNA). Since b oth algorithms fit mixed mem b ership mo dels, we decide to simplify the presen tation by iden tifying lo cus i with a single comm unity a = argmax i θ i ( k ) rather than reporting the full mixed-mem b ership v ector for lo cus i . Though we do not exploit the mixed-membership nature of our CD algorithms, it ma y b e useful in future studies. A recen t w ork sho ws evidence for precisely choreographed c hromatin reorganizations in time (the so-called “4D” structure of DNA) [29]. It may b e the case that regions of lo ci that are highly admixed (i.e. the vector θ i has more than one large comp onen t) will b e go o d candidates as c hromatin structures that reposition themselv es dynamically . In this particular case, b oth algorithms resulted in iden tical plots. As can b e seen, the output of the CD algorithm closely follo ws the contour of the first principle comp onent, dis- co vering a very close partition to that of the PCA pro cedure. While the PCA pro cedure requires as input the P earson correlation matrix of a normalized Hi-C connection matrix, the CD algorithms tak e as input a binarized version of the original matrix X ∗ ij = 1 ( X ij > 0).This binarization is used b ecause the current implementation of the MMSB algorithm only accepts binary adjacency matrices as input (see section A.1). It should b e noted that this is not a fun- damen tal limitation of CD algorithms and that several other existing CD algorithms, including the P oisson mo del that is discussed in this pap er, allo w for w eighted adjacency matrices. W e do not use the w eighted adjacency matrix for the Poisson algorithm in this study for simplicity of comparison with the MMSB algorithm. In future work, it would b e interesting to exploit these intensities as well. This could b e done using the Poisson mo del, or with a tailored mo del that allo ws to in tegrate prop erly the intensit y v ariations o ccurring in the Hi-C contact ma- trices. W e b eliev e that rew orking these analyses incorp orating in tensit y information matrices will b e imp ortant for future inv estigations. It is also in teresting that the communities found b y the CD algorithms as w ell as PCA are non-lo cal: b oth communities include large DNA segmen ts from disparate regions of the chromosome. As can b e seen in supplemen tary Fig. 12 b oth the principle comp onen t v ector and the communit y memberships clearly demarcate the plaid pattern of the correlation matrix. 4 Figure 2: Comparison b etw een results of Lieb erman-Aiden, et al. and CD algorithms. Red line corresp onds to communit y membership: a v alue of 0.5 corresp onds to mem b ership in communit y one and a v alue of -0.5 corresp onds to membership in communit y tw o. The blue line corresp onds to the v alues of the first principle comp onent of the P earson correlation matrix. In Lieb erman-Aiden, et al. they iden tify lo ci with p ositive/negativ e v alues of the first principle comp onen t as b elonging to “compartment” A/B. It is apparent that the communit y assignments of our algorithms closely follo w the con tour of the first principle comp onent. 3.2 CD algorithms successfully iden tify lo cal T ADs Unlik e the large, non-lo cal compartmen ts studied ab ov e, Dixon et al. study small ( ∼ 1Mb) and lo cal (i.e. adjacen t in the linear DNA structure) comm unities called top ologically as- so ciating domains (T ADs). T ADs are of biological in terest b ecause they are conserved ov er sev eral cell t yp es as w ell as sev eral sp ecies suggesting that their structure is imp ortant to basic mammalian cell function [11]. Additionally , sev eral disorders such as limb malformation ha ve b een asso ciated with structural deformities in chromatin at the scale of T ADS [8]. The metho d by whic h Dixon et al. discov er top ological domains is to take adv antage of a bias in the directionality of interactions at the b oundary of T ADs. A t the downstream terminus of an in teracting unit, most in teractions will b e with upstream p ortions of DNA. Con versely at the upstream termin us of an interacting unit, most interactions will b e with downstream p ortions of DNA. Dixon et al. define a directionality index (DI) which captures the directionalit y of links at an y particular lo ci and then use a hidden Marko v mo del to infer b oundary lo cations in which the DI quickly c hanges. While the metho d described abov e is successful at iden tifying T ADs, it has one significan t disadv an tage to the metho ds of CD algorithms. Since this metho d identifies boundaries and not comm unities, it can only determine lo cal structures (i.e. it will nev er identify p ortions of the genome that are distan t from each other in the linear structure of the DNA as belonging to the same communit y). By contrast, CD algorithms (as was display ed in the previous section), naturally detect non-lo cal communit y structures. Fig. 3 shows that both CD algorithms disco ver similar (and in some cases identical) T AD b oundaries to those iden tified by the directionality index metho d. The data is from c hromosome 6 of a mouse em bryonic stem cell (MESC). In this case w e are looking at a near- diagonal region of the chromosome in which there are v ery few en tries of the raw data matrix X ij that are non-zero. Because of this, w e had to increase our threshold b efore applying CD algorithms: sp ecifically , X ∗ ij = 1 ( X ij > 10). W e also note that it would b e impractical to run 5 CD algorithms on entire genomes with k ∼ 10000 to detect all T ADs at once (setting k very high often results in empty communities). In practice, one could search for T ADs b y running CD algorithms successively on small blo cks of the DNA sequence and c ho ose k via the methods suggested in 3.3 within eac h new blo ck. Figure 3: Outputs of the SVI (dashed blue line) and P oisson (red line) CD algorithms. Though there are alw a ys k ! equiv alen t comm unity assignments (corresp onding to relabelings of the communities) w e require that the communit y lab els rise sequen tially along the 1D sequence for ease of comparison b et w een the t w o algorithms. Black v ertical lines corresp ond to the boundaries iden tified b y Dixon et al. Both algorithms are applied to a portion of the MESC genome presen ted in the pap er b y Dixon et al. With k set to 7, b oth algorithms detect communities that align well with the b oundaries disco vered b y the DI approac h. While the b oundary b etw een the 6th and 7th comm unities do not agree b etw een the tw o CD algorithms, a closer lo ok in Fig. 4 shows that b oth b oundary lo cations corresp ond to areas of sharp change in the directionalit y index. 3.3 Determining k ∗ and disco vering new comm unities A common problem of many communit y detection strategies is that the user m ust supply the algorithm with the num b er of communities k . While this is a notoriously difficult mo del selection problem in general, it is particularly subtle for this application of CD in Hi-C data. Here, it is clear that there is not a single “best” k ; there is biologically important information ab out comm unities on v arious differen t scales. F or instance if we w ere to set k = 2, Lieb erman- Aiden et al. [10] suggest that we would find information ab out the compartment structure of the entire genome. How ever, this communit y assignmen t would give us little information ab out the T AD structure of the genome. As w e ha v e shown ab o ve, CD tec hniques are flexible enough to capture communities at both of these scales. 3 So far w e hav e used our previous knowledge from existing research in order to set k . In this section, w e prop ose t wo metho ds for suggesting meaningful v alues for k to input in to CD algorithms in order to unco ver communit y structures at new scales. The first approach makes use of comparing o v er many v alues of k the log-lik eliho o d of a real Hi-C netw ork to that of a random netw ork. The second approach is a more combinatoric approac h that aims to quantify the level of redundancy in comm unity detection outputs with k and k + 1 communities. 3 Although exploration of Hi-C data at different scales of genome organization has also b een prop osed b efore [12], this computational approach can only identify communities contin uous in the linear representation of the genome as in the metho ds of Dixon, et al. 6 Figure 4: Comparison b etw een CD outputs, DI output, and original contact matrix. (T op) Original con tact matrix of a segment of c hromosome 6 from MESC. Only half of the symmetric contact matrix is displa y ed and it is oriented so that its diagonal lies flat for ease of comparison. (Middle) Identical to 3. W e see that the blac k vertical lines (the b oundaries iden tified by the DI metho d) as w ell as the jumps in the comm unit y assignments from the CD algorithms align well with triangular sections of the contact matrix that corresp ond to regions with a high level of interconnectivit y (T ADs). (Bottom) The output of the DI metho d from Dixon et al. This metho d identifies boundaries with jumps in the DI: a metric which is p ositive/negativ e for lo ci that hav e more connections do wnstream/upstream of the 1D sequence. 3.3.1 Approac h 1: asymptotic b ehavior of log-likelihoo d for large k As we increase k , we will inevitably see a consequent increase in the maxim um likelihoo d of the data. T o see this, supp ose w e ha v e found the maxim um lik eliho o d assignmen ts of lo ci for k communities. An assignment to k + 1 comm unities can b e made with equal likelihoo d b y simply assigning zero mem b ers to comm unity k + 1 and retaining the previous assignmen ts for all other communities. In order to assess whether or not an increase in likelihoo d is imp ortan t, w e ask whether or not it is distinguishable from the increase w e w ould detect in an “equiv alent” random graph. W e define a random graph A as “equiv alent” to another graph B if it has the same num b er of nodes and the same n umber of exp ected edges. Sp ecifically , if B has n nodes and m edges, then A is “equiv alent” if it is a random graph dra wn from G ( n, p ) with p = m ( n 2 ) . Since there are n 2 p ossible edges in a graph with n no des, w e see that the exp ected n umber of edges of such a graph is p n 2 = m , as required. Fig. 5 displa ys the log-lik eliho o d as a function of k for b oth chromosome 14 data from Lieb erman-Aiden et al. (in red) and an equiv alen t random graph (in black). Fig. 6 suggest that the increase in the log-lik eliho o d for large k is identical to that of an equiv alen t random graph. It app ears that after k = 6 or k = 7, the increases in log-likelihoo d are marginal. Therefore Approach 1 suggests a choice of k somewhere in the range of 6-9. W e will refine this choice using Approac h 2 (describ ed b elo w) to k = 6. 3.3.2 Approac h 2 In order to motiv ate Approac h 2, it will be useful to first consider the to y data displa yed in Fig. 7. 1 represen ts the comm unit y assignmen t matrix disco v ered when k = 2 (where, as b efore, 7 5 10 15 20 25 30 -520000 -500000 -480000 -460000 Comparison of log-likelihood k log-likelihood Figure 5: Log-likelihoo d as a function of k for Hi- C data (red) and a random graphs (black) with an equal num b er of nodes and an exp ected n um- b er of edges equal to the n umber of edges in the con tact matrix. W e see that the log-lik eliho o d of a random graph increases roughly linearly and that for large k , the log-likelihoo d of the data also app ears to increase linearly with an equal slop e. 5 10 15 20 25 30 0 2000 4000 6000 8000 10000 Comparison of change in log-likelihood k delta log-likelihood Figure 6: Change in log-likelihoo d for Hi-C data (red) and a random graph (black) b etw een k and k + 1 comm unities. Here we see that the increases in log-likelihoo d for the random graph are roughly constan t and that the increases in the log-likelihoo d of the data approach this constan t v alue for large k . 8 w e assign eac h lo cus to the communit y with the highest admixture prop ortion). Communit y assignmen t 1 disco vers tw o equal-sized comm unities: one on the left half of the genome and the other on the righ t half of the genome. 2a and 2b represent t wo possible communit y assignment matrices when w e increase k to 3. In communit y assignment 2a the original left communit y is split into tw o further sub-communities. In communit y assignment 2b, three communities are found with the middle communit y comp osed of DNA from b oth the original left and righ t comm unities. Figure 7: T oy data for p ossible transitions b et ween k = 2 and k = 3 groups. Eac h communit y is a ro w of this matrix and the columns index genome p osition. Beige indicates comm unit y assignment to that ro w. A transition from 1 to 2a is evidence for a stable comm unit y assignment in 1 whereas a transition from 1 to 2b is evidence for an “unstable” communit y assignmen t in 1. W e consider the transition from 1 to 2a as evidence that the tw o original communities w ere “stable.” The left communit y in 1 was split into t wo comm unities in 2a either arbitrarily in order to satisfy k = 3 or b ecause the left communit y had tw o sub-communities. Conv ersely , w e consider the transition from 1 to 2b as evidence that the original tw o comm unities were “unstable.” The partition in to left and right communities in 1 ma y ha ve app eared arbitrarily in order to satisfy the condition k = 2. Ho wev er, when w e increase k to 3, we see that there w ere in fact three distinct communities. W e define a metric called the “assignment instabilit y” whic h w e shall denote D ( k , k + 1) that aims to quantify this b ehavior. D ( k , k + 1) takes as inputs the communit y assignment matrices of for k and k + 1 and outputs a measure of the “stabilit y” of comm unities disco vered for k . A low v alue of D ( k , k + 1) implies that the comm unity assignments for k comm unities w e re stable while a high v alue indicates unstable assignmen ts for k comm unities. W e describe this metric and its implemen tation in app endix B. W e emphasize that D ( k , k + 1) tells us only about the comparativ e stability b etw een communit y assignmen ts A k and A k +1 . One could imagine generalizing this metric to b e of the form D ( k , k + l ) to describ e the assignment stability b etw een comm unity assignmen ts for k and k + l communities. While this ma y b e a useful thing to consider, we do not do this here since w e intend to use the assignment instabilit y metric to “fine-tune” the suggested k from Approac h 1. Our strategy will b e to use Approach 1 to scan through many v alues of k and suggest several app ear at the “pivot” of the log-lik eliho o d plot, and then apply Approac h 2 to distinguish b etw een these candidates. Fig. 8 displa ys the D ( k , k + 1) and Fig. 9 shows this same plot with the result for a random graph for comparison. The low est v alue is found for k = 6, suggesting high stability in the communities found for k = 6, consisten t with our previous finding using Approach 1. It is in teresting to note that if we had used Approac h 1 alone, the choice betw een k = 6 and 9 5 10 15 20 25 30 20 40 60 80 100 120 k D(k,k+1) Assignment instability as a function of k Figure 8: The function D ( k , k + 1) plotted for h uman c hromosome 14. Large v alues indicate unstable communit y assignmen ts while small v al- ues indicate stability . The global minimum o c- curs at k = 6 which further supp orts our choice of k ∗ = 6. W e also note that k = 22 has a larger assignmen t instabilit y than k ∗ = 6 and k = 7 only , b oth of whic h exhibit similar com- m unities. Therefore, k = 22 may b e another in- teresting scale at which meaningful comm unities emerge and the corresp onding communit y assign- men t matrix is sho wn in Fig. 14. 5 10 15 20 25 30 0 100 200 300 400 k D(k,k+1) Comparison to random graph Figure 9: The function D ( k , k + 1) plotted for h uman chromosome 14 and a random graph with the same n umber of no des and exp ected n umber of edges equal to the observed n um b er of edges. W e see that the comm unity assignments are uniformly more stable for the real data than the random graph as we w ould exp ect since any comm unity structure detected in the random graph o ccurs b y c hance. F urthermore, we see that the t wo function app ear to con verge for large k . k = 7, for example, would hav e b een arbitrary . In conjunction with Approac h 2 how ever, it is clear that k = 6 is a sup erior choice as it has the low est assignmen t instability of any k . In Fig. 13, we plot the comm unit y assignment m atrices for k = 2 alongside k = 6. W e see that the partition of c hromosome 14 found for each k display b oth stable groups in the k = 2 assignmen t (i.e. transitions of the t yp e 1 → 2a) as w ell as unstable groups (i.e. transitions of the type 1 → 2b); for k = 6, CD finds nov el communities that are not simply sub-comm unities of the original k = 2 communities discov ered b y Lieb erman-Aiden et al. Approac h 2 also highligh ts other p otential k of interest that are not immediately obvious b y utilizing Approach 1 alone. F or instance, the sharp dip at k = 22 suggest that this may also b e a natural c hoice of scale. The communit y assignment matrix for this choice is shown in supplementary Fig. 14. 4 Conclusions and F uture Directions Tw o CD algorithms are applied to Hi-C data and compared with the results from tw o sep- arate studies. W e find that b oth algorithms conv erge to similar (or iden tical) outputs for comm unity membership and agree with the indep endent metho ds of each study . When we require a partition in to t wo comm unities, we reproduce the “compartment” structures found 10 b y Lieb erman-Aiden et al. How ev er, when w e set k to k ∗ = 6, we discov er new comm unities. W e see that the methods of communit y detection enable the iden tification of a v ariable n um b er of comm unities as well as potentially non-lo cal communities: features that were not simultane- ously p ossible with either of the pre-existing methods examined here. W e further suggest t wo approac hes that leverage our ability to find v arying num b ers of communities through commu- nit y detection to suggest natural v alues for k . W e note that one particular choice for k that is suggested by b oth methods is k = 6 for chromosome 14 of the Lieberman-Aiden et al. data. Though w e ha v e utilized CD algorithms that fit admixture models throughout this w ork, w e note that we do not tak e full adv an tage of these mo dels and instead make hard assignments for each lo cus to an individual comm unity . This capability of mixed-membership models ma y b e useful in future studies in whic h one seeks individual lo ci that interact with several differen t communities. It is plausible that iden tifying such lo ci will pro v e useful for iden tifying candidate lo ci that undergo structural rep ositioning in time. A large v ariet y of blo c k mo dels ha ve b een prop osed in the literature [31, 33, 32, 34, 35], where non pairwise interactions, censored measurements, or edge lab els are allo w ed. It would th us b e interesting to further in vestigate and compare these for communit y detection in Hi-C data sets. Ac kno wledgemen t The second author would like to thank Aurelie Lozano for initiating discussions on the use of comm unity detection methods in Hi-C data, for pro viding access to a preliminary set of Hi-C data, and for stimulating discussions and comments on this man uscript. W e would also like to thank Prem Gopalan for stim ulating discussions and for providing the implemen tation of the MMSB algorithm used in this work, as w ell as Harris Lazaris for discussions on Hi-C data. References [1] J. Dekk er, Gene regulation in the third dimension. S cience, 319(5871):1793-4, 2008. [2] L. A., Lettice, S. J. Heaney , L. A. Purdie, L. Li, P . de Beer, B. A. Oostra, D. Go o de, G. Elgar, R. E. Hill, and E. de Graaff. A long-range Shh enhancer regulates expression in the developing limb and fin and is asso ciated with preaxial p olydact yly . H uman Molecular Genetics, 15;12(14):1725-35, 2003. [3] J. Sotelo, D. Esp osito, M. A. Duhagon, K. Banfield, J. Mehalko, H. Liao, R. M. Stephens, T. Harris, D. J. Munro e, and X. W u, Long-range enhancers on 8q24 regulate c-Myc. P ro ceedings of the National Academ y of Sciences, 16;107(7):3001-5, 2009. [4] M. A. Nobrega, I. Ov charenk o, V. Afzal, and E. M. Rubin. Scanning h uman gene deserts for long-range enhancers. S cience, 17;302(5644):413, 2003. [5] S. Kadauke, and G. A. Blob el. Chromatin lo ops in gene regulation. B io chimica et Biophys- ica Acta, 1789(1):17-25, 2009. [6] G. F elsenfeld, and M. Groudine. Con trolling the double helix. N ature, 421, 448-453 (2003) [7] P . Scaffidi and T. Misteli. Lamin A-Dep endent Nuclear Defects in Human Aging. S cience, 312(5776): 10591063, 2006. [8] D. G. Lupiez, K. Kraft, V. Heinrich, P . Kra witz, F. Brancati, E. Klop o cki, D. Horn, H. Ka yserili, J. M. Opitz, R. Laxov a, F. Santos-Simarro, B. Gilb ert-Dussardier, L. Wittler, M. Borschiw er, S. A. Haas, M. Osterwalder, M. F ranke, B. Timmermann, J. Hech t, M. Spielmann, A. Visel, S. Mundlos, Disruptions of T op ological Chromatin Domains Cause P athogenic Rewiring of Gene-Enhancer Interactions, C ell, 161(5): 1012-1025, 2015. 11 [9] K. J. Meaburn, P . R. Gudla, S. Khan, J. S. Lock ett, and T. Misteli. Disease-sp ecific gene rep ositioning in breast cancer. T he Journal of Cell Biology, 2009 187:801-812, 2009. [10] E. Lieb erman-Aiden, N. L. Berkum, L. Williams, M. Imak aev, T. Rago czy , A. T elling, I. Amit, B. R. La joie, P . J. Sab o, M. O. Dorschner, R. Sandstrom, B. Bernstein, M. A. Bender, M. Groudine, A. Gnirke, J. Stamatoy annop oulos, L. A. Mirny , E. S. Lander, and, J. Dekker. Comprehensiv e Mapping of Long Range In teractions Reveals F olding Principles of the Human Genome. S cience, 326.5950: 289293, 2009. [11] J. R. Dixon, S. Selv ara j, F. Y ue, A. Kim, Y. Li, Y. Shen, M. Hu, J. S. Liu, B. Ren. T op o- logical domains in mammalian genomes identified b y analysis of c hromatin int eractions. N ature, 485:376380 (2012). [12] D. Filipp ov a, R. P atro, G. Duggal, and C. Kingsford. Identification of alternativ e top o- logical domains in chromatin. Algorithms Mol. Biol. 9, 14 (2014). [13] M. Girv an and M. E. J. Newman. Communit y structure in so cial and biological netw orks. Pr o c e e dings of the National A c ademy of Scienc es , 99(12):7821–7826, 2002. [14] M. E. J. Newman, D. J. W atts, and S. H. Strogatz. Random graph mo dels of so cial net works. Pr o c. Natl. A c ad. Sci. USA , 99:2566–2572. [15] G. Linden, B. Smith, and J. Y ork. Amazon.com recommendations: Item-to-item collab o- rativ e filtering. IEEE Internet Computing , 7(1):76–80, Jan uary 2003. [16] J. Shi and J. Malik. Normalized cuts and image segmentation. IEEE T r ansactions on Pattern Analysis and Machine Intel ligenc e , 22:888–905, 1997. [17] M. Sonk a, V. Hla v ac, and R. Boyle. Image Pr o c essing, Analysis, and Machine Vision . Thomson-Engineering, 2007. [18] J. Chen and B. Y uan. Detecting functional mo dules in the y east proteinprotein interaction net work. Bioinformatics , 22(18):2283–2290, 2006. [19] E.M. Marcotte, M. Pellegrini, H.-L. Ng, D.W. Rice, T.O. Y eates, and D. Eisen b erg. De- tecting protein function and protein-protein interactions from genome sequences. Scienc e , 285(5428):751–753, 1999. [20] J. K. Pritchard, M. Stephens, and P . Donnelly . Inference of Population Structure Using Multilo cus Genotype Data. Genetics , 155(2):945–959, June 2000. [21] D. Jiang, C. T ang, and A. Zhang. Cluster analysis for gene expression data: a survey . Know le dge and Data Engine ering, IEEE T r ansactions on , 16(11):1370–1386, No v 2004. [22] T. Sorlie, C.M. P erou, R. Tibshirani, T. Aas, S. G eisler, H. Johnsen, T. Hastie, Mi.B. Eisen, M. v an de Rijn, S.S. Jeffrey , T. Thorsen, H. Quist, J.C. Matese, P .O. Bro wn, D. Bot- stein, P .E. Lonning, and A. Borrese n-Dale. Gene expression patterns of breast carcinomas distinguish tumor sub classes with clinical implications. 98(19):10869–10874, 2001. [23] M. E. J. Newman. Comm unities, mo dules and large-scale structure in net w orks. Natur e Physics , 8(1):25–31, dec 2011. [24] S. F ortunato. Communit y detection in graphs. Physics R ep orts , 486 (3-5):75–174, 2010. [25] A. Lancic hinetti and S. F ortunato. Communit y detection algorithms: A comparativ e anal- ysis. Phys. R ev. E , 80:056117, No v 2009. [26] P . Gopalan and D.M. Blei, Proc Natl Acad Sci, 110 (36) 14534-14539 (2013). [27] B. Ball, B. Karrer, and M. E. J. Newman, Ph ys. Rev, E 84, 036103 (2011). [28] P . W. Holland, K. Laskey , and S. Leinhardt. Stochastic blo c kmo dels: First steps. So cial Networks , 5(2):109–137, 1983. 12 [29] H. Chen, J. Chen, L. A. Muir, S. Ronquist, W. Meixner, M. Ljungman, T. Ried, S. Smale, and I. Ra japakse F unctional organization of the h uman 4D Nucleome. P ro ceeding of the National Academy of Sciences, 112: 8002-8007, 2015. [30] S. S. P . Rao, M. H. Huntley , N. C. Durand, E. K. Stamenov a, I. D. Bo chk o v, J. T. Robinson, A. L. Sanborn, I. Machol, A. D. Omer, E. S. Lander, E. Lieb erman-Aiden. A 3D Map of the Human Genome at Kilobase Resolution Reveals Principles of Chromatin Lo oping. C ell, 159(7): 1665-1680, 2014. [31] A. Golden b erg, A. X. Zheng, S. E. Fienberg, and E. M. Airoldi. A survey of statistical net work mo dels. F oundations and T r ends in Machine L e arning , 2(2):129–233, 2010. [32] J. Xu, M. Lelarge, and L. Massoulie. Edge lab el inference in generalized sto c hastic block mo dels: from sp ectral theory to imp ossibility results. Pr o c e e dings of COL T 2014 , 2014. [33] S. Heimlic her, M. Lelarge, and L. Massouli´ e. Communit y detection in the labelled stochas- tic blo ck mo del. , 2012. [34] B. Karrer and M. E. J. Newman. Sto chastic blo ckmodels and communit y structure in net works. Phys. R ev. E , 83:016107, Jan 2011. [35] E. Abb e, A. S. Bandeira, A. Bracher, and A. Singer. Deco ding binary no de lab els from censored edge measuremen ts: Phase transition and efficien t recov ery . IEEE Tr ansactions on Network Scienc e and Engine ering , 1(1), 2014. A Description of algorithms for detecting o v erlap- ping comm unities A.1 Algorithm 1: Sto chastic v ariational inference The mo del: The conv entional sto c hastic blo ck mo del assigns each no de to one of K comm u- nities. In the mixed-membership sto chastic blo c k mo del (MMSB) employ ed by this algorithm, eac h no de i has asso ciated with it a discreet probabilit y distribution θ i o ver the k no des. F or eac h pair of nodes ( i, j ), a random v ariable z i → j is drawn from the distribution θ i and a random v ariable z j → i is drawn from θ j . If z i → j = z j → i = k , then a link is made b et w een ( i, j ) with probabilit y β k . β k represen ts the connectivit y of group k . If z i → j 6 = z j → i = k , then a link is made with a small probabilit y . Therefore, w e ha ve: p ( X ij = 1 | z i → j , z j → i ) = β z i → j : z i → j = z j → i : z i → j 6 = z j → i where X is the adjacency matrix. In this mo del, as in the Poisson mo del describ ed b elow, the edges rather than the no des b elong to a single group. The fundamental difference b etw een b oth of these mo dels and conv entional clustering algorithms is made clear in Fig. 10 and 11. In both of the algorithms considered here, a single no de (i.e. a DNA locus) is capable of ha ving an edge from more than a single communit y , how ev er in this work we do not exploit this flexibility and instead assign each lo cus to the communit y it shares the largest n umber of edges with. The algorithm: The task is now to compute the p osterior probability p ( θ , z | X ) = p ( θ , z , X ) / p ( X ) and find the set of parameters whic h maximize this p osterior. This is a difficult problem ho w- ev er b ecause of the intractable denominator 13 Figure 10: Output for most conv en tional cluster- ing algorithms. Eac h node is assigned to a single comm unity (i.e. a color). Figure 11: Output for b oth the SVI and Poisson algorithms. Each edge is assigned to a comm u- nit y . Individual no des are capable of having an edge from more than a single communit y . p ( y ) = Z θ X z p ( θ , z , X ) Rather than computing this posterior probabilit y distribution directly , the authors in [26] recast this problem in to a mean-field v ariational inference setting. They show that minimizing the KL distance b etw een the true p osterior is equiv alent to maximizing the ob jective function L ( γ , φ ) = E [log p ( θ , z , X )] + H [ q ( θ , z )] where q is a mem b er of a v ariational family of p osterior distributions and exp ectation o ccurs o ver this function. Maximizing this function rather than maximizing the original p osterior probabilit y directly has the adv an tage that it can b e done using sev eral pre-existing optimiza- tion metho ds. The metho d that the authors use is that of stochastic optimization, in whic h a lo cal minim um is found by following a noisy approximation of the gradient. A full description of the algorithm ma y b e found in [26] and a do wnloadable implementation is a v ailable at: https://github.com/premgopalan/svinet . A.2 Algorithm 2: P oisson mo del The mo del: The mo del used in this algorithm is similar in spirit that used by the SVI algorithm. As with the SVI mo del, this mo del assigns a unique group to each edge rather than eac h no de and each node i comes with a probabilit y distribution θ i o ver the K communities. Unlik e the model used by the SVI algorithm, this mo del allo ws m ultiple edges from the same 14 comm unity to link tw o no des so that each pair of no des ( i, j ) has a mean θ i ( k ) θ j ( k ) links via communit y k . The n umber of links b etw een t wo no des from a single communit y can b e appro ximated b y a P ois( θ i ( k ) θ j ( k )) distribution. In this current implementation of the Poisson mo del, all adjacency matrices are treated as binary: X ij = 1 for all contact matrix en tries that are non-zero. This has b een done in part for simplicity of comparison b et ween the P oisson mo del and the MMSB mo del. The algorithm: Given the abov e mo del, one can write down the probabilit y of a graph G with adjacency matrix X and communit y mem b ership distributions { θ i } as P ( G | θ ) = Y i
Original Paper
Loading high-quality paper...
Comments & Academic Discussion
Loading comments...
Leave a Comment