In-Line-Test of Variability and Bit-Error-Rate of HfOx-Based Resistive Memory
Spatial and temporal variability of HfOx-based resistive random access memory (RRAM) are investigated for manufacturing and product designs. Manufacturing variability is characterized at different levels including lots, wafers, and chips. Bit-error-rate (BER) is proposed as a holistic parameter for the write cycle resistance statistics. Using the electrical in-line-test cycle data, a method is developed to derive BERs as functions of the design margin, to provide guidance for technology evaluation and product design. The proposed BER calculation can also be used in the off-line bench test and build-in-self-test (BIST) for adaptive error correction and for the other types of random access memories.
💡 Research Summary
The paper presents a comprehensive methodology for characterizing both spatial and temporal variability of hafnium‑oxide (HfOx) based resistive random‑access memory (RRAM) and for translating that variability into a quantitative bit‑error‑rate (BER) metric that can be used throughout the technology development cycle.
First, inline electrical test (I‑T) data collected during wafer‑level production are dissected into three hierarchical sources of variation: lot‑to‑lot, wafer‑to‑wafer, and chip‑to‑chip. Statistical analysis (ANOVA and multi‑level modeling) shows that lot‑level drift of process parameters dominates the overall spread, while wafer‑level non‑uniformities (temperature gradients, plasma density, gas flow) and chip‑level microscopic defects (electrode contact resistance, oxide thickness fluctuations) contribute smaller but non‑negligible components.
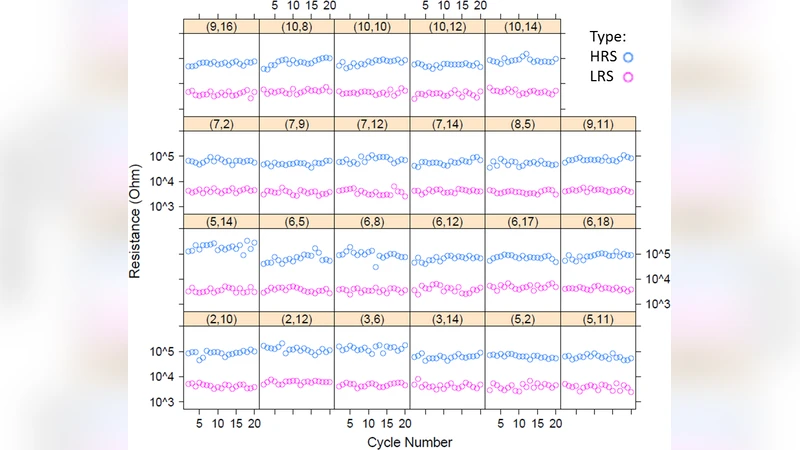
Second, the resistance values measured during write‑read cycles are fitted to log‑normal distributions for the low‑resistance state (LRS) and the high‑resistance state (HRS). The fitted means (μLRS, μHRS) and standard deviations (σLRS, σHRS) provide a statistical description of the cell’s switching behavior.
Third, a design margin M is defined as the safety gap between the two state means. Using the cumulative distribution function (Φ) of the log‑normal model, the probability that an LRS value falls below the margin (read‑as‑HRS) and the probability that an HRS value exceeds the margin (read‑as‑LRS) are expressed as:
P_error_LRS = Φ
Comments & Academic Discussion
Loading comments...
Leave a Comment