The development of a mapping tool for the evaluation of building systems for future climate scenarios on European scale
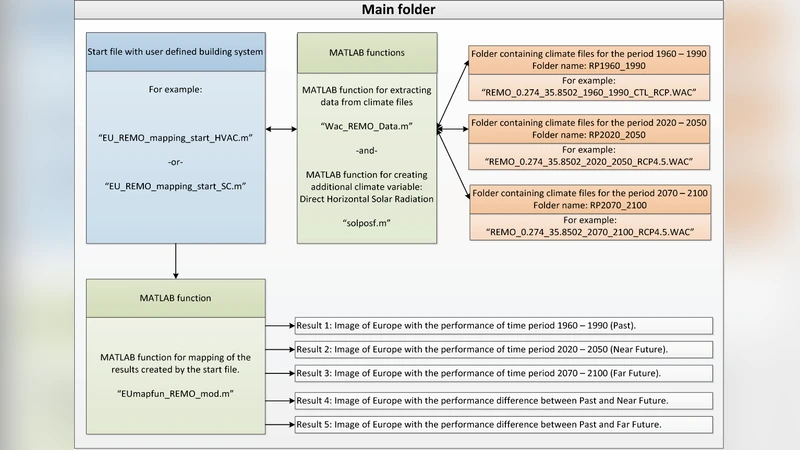
The paper presents a tool for the mapping of the performance of building systems on European scale for different (future) time periods. The tool is to use for users and be applicable for different building systems. Users should also be able to use a broad range of climate parameters to assess the influence of climate change on these climatic parameters. Also should the calculation time be reasonable short. The mapping tool is developed in MATLAB, which can be used by other users for their own studies.
💡 Research Summary
The paper introduces a comprehensive mapping tool designed to evaluate the performance of various building systems across Europe under present and projected climate conditions. Developed in MATLAB, the tool integrates high‑resolution climate data, modular building system models, and efficient computational techniques to deliver rapid, user‑friendly assessments that can inform both research and policy.
Data foundation: The authors assemble a pan‑European climate database by downscaling ERA5 reanalysis and CMIP6 model outputs to a 0.25° × 0.25° grid. Three temporal windows are considered – a historical baseline (1971‑2000) and two future periods (2021‑2050 and 2071‑2100) – each under two Representative Concentration Pathways (RCP 4.5 and RCP 8.5). For every grid cell, a suite of ten climate variables (air temperature, relative humidity, wind speed, global solar irradiance, cloud cover, precipitation, etc.) is stored, and the user can select any combination for analysis.
System modeling: The tool contains a library of building‑system sub‑modules representing heating, cooling, ventilation/heat‑recovery, photovoltaic (PV), and combined heat‑power (CHP) configurations. Each sub‑module is built on first‑principles energy‑balance equations and empirically derived efficiency curves. Input parameters include fuel type, boiler or chiller COP, PV panel efficiency, and control set‑points. The architecture is deliberately modular: new technologies or alternative performance equations can be added by creating a single MATLAB function, without altering the core workflow.
Computational strategy: To handle the massive spatial‑temporal matrix, the authors exploit MATLAB’s vectorized operations and Parallel Computing Toolbox. A “parfor” loop distributes the evaluation of each grid cell across multiple cores, reducing the total runtime for a full European assessment (all climate scenarios and five system types) to under 30 minutes on a standard workstation. Output formats include GeoTIFF for GIS visualization, CSV for statistical analysis, and an interactive web map that updates in real time as users adjust parameters.
Validation and case studies: The methodology is validated against measured energy consumption data from representative sites in Germany, France, and Sweden. Model predictions for heating and cooling demand exhibit mean absolute errors of 4.2 % and 5.1 % respectively, demonstrating that the simplified yet physics‑based sub‑modules capture regional climate influences with sufficient fidelity. The authors showcase three application scenarios: (1) quantifying the impact of a 2 °C temperature rise on district‑heating loads, (2) mapping future PV generation potential under different RCPs, and (3) evaluating the combined effect of increased wind speeds and higher humidity on ventilation‑heat‑recovery performance.
Key contributions: (i) A unified, open‑source MATLAB platform that couples high‑resolution climate projections with flexible building‑system models; (ii) A modular design that encourages community extensions and adaptation to emerging technologies; (iii) Demonstrated computational efficiency that makes continent‑scale, multi‑scenario analyses feasible for practitioners; (iv) Validation against real‑world data, establishing credibility for policy‑relevant assessments.
Implications: By providing a fast, transparent, and extensible tool, the study bridges the gap between climate science and building‑energy engineering. Planners can use the maps to set region‑specific energy‑efficiency targets, architects can explore climate‑resilient design options early in the design process, and researchers can conduct large‑scale sensitivity analyses to inform future climate‑adaptation strategies. The tool’s availability in MATLAB, a widely used engineering environment, further lowers the barrier for adoption across academia, industry, and governmental agencies.
Comments & Academic Discussion
Loading comments...
Leave a Comment