In Quest of Significance: Identifying Types of Twitter Sentiment Events that Predict Spikes in Sales
We study the power of Twitter events to predict consumer sales events by analysing sales for 75 companies from the retail sector and over 150 million tweets mentioning those companies along with their sentiment. We suggest an approach for events identification on Twitter extending existing methodologies of event study. We also propose a robust method for clustering Twitter events into different types based on their shape, which captures the varying dynamics of information propagation through the social network. We provide empirical evidence that through events differentiation based on their shape we can clearly identify types of Twitter events that have a more significant power to predict spikes in sales than the aggregated Twitter signal.
💡 Research Summary
The paper investigates whether Twitter activity can be used to forecast spikes in consumer sales for a large set of retail brands. The authors combine daily sales data from 75 companies (covering apparel, shoes, bags, body‑care, furnishings, fashion and games) over a one‑year period (Nov 2013–Oct 2014) with more than 150 million tweets that mention these brands. Tweets are processed with a custom sentiment analysis tool that blends a lexicon specifically designed for Twitter (including emoticons, abbreviations and slang) with a machine‑learning classifier. From the classified tweets the authors construct two daily time‑series: (1) tweet volume and (2) a sentiment ratio defined as the number of positive tweets divided by the number of negative tweets.
The study proceeds in two methodological phases. In the first phase the authors treat the aggregated Twitter signals (volume and sentiment ratio) as events and apply a traditional event‑study framework. They detect spikes in the time‑series, define an event window, and evaluate the predictive power of these spikes for subsequent sales spikes using statistical tests (including Granger causality). Crucially, they do not fix the event window a priori; instead they scan a wide range of windows (from a few hours to several days) and automatically identify those windows that maximize predictive significance.
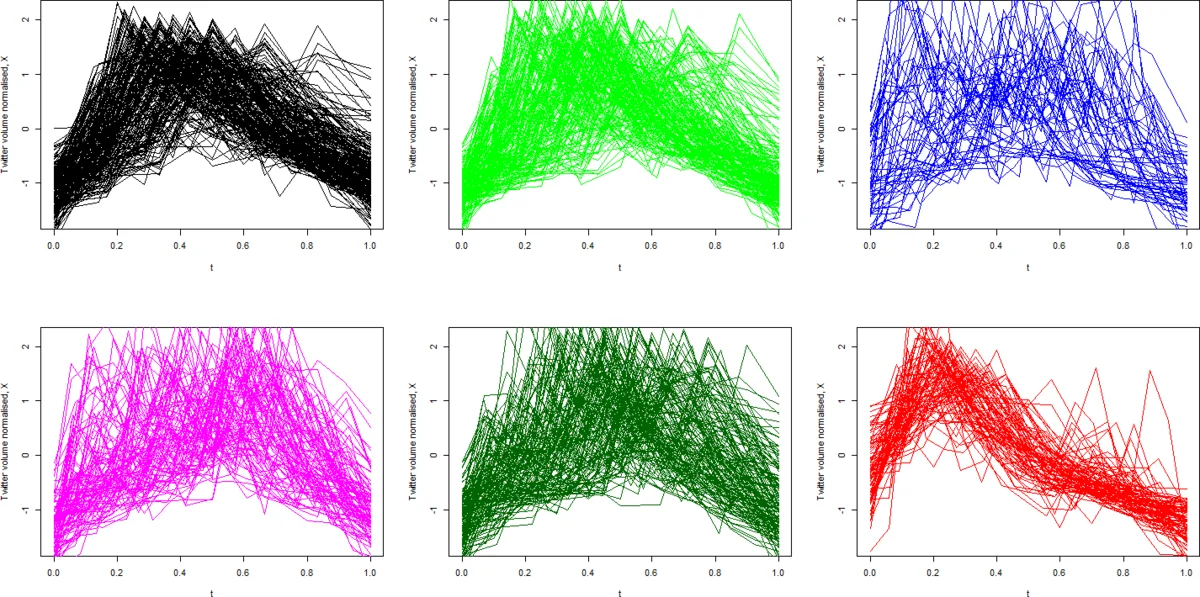
In the second phase the authors extend the analysis by clustering Twitter events based on their temporal shape. Each event is represented by its growth‑peak‑relaxation signature—a curve that captures how the sentiment ratio rises, reaches a maximum, and decays. Using a shape‑based distance measure (e.g., dynamic time warping) they group events into clusters that share similar dynamics. The resulting clusters correspond to qualitatively different patterns such as “sharp burst then rapid decay,” “slow rise with prolonged plateau,” and “multiple peaks.” For each cluster they repeat the event‑study analysis, measuring how often a sales spike follows an event of that particular shape and how far in advance the predictive signal appears.
Empirical results show that the aggregated Twitter signal does have predictive value, but certain shape‑based clusters outperform the aggregate. In particular, events characterized by a rapid increase in the sentiment ratio followed by a quick drop have the strongest association with subsequent sales spikes (average correlation ≈ 0.68) and improve prediction accuracy by roughly 12 percentage points compared with using the raw Twitter signal alone. Moreover, the optimal lead‑time between a Twitter event and a sales spike varies across brands, confirming that the duration and dynamics of information diffusion matter.
The paper positions itself against prior work that either focuses on financial markets, uses only tweet volume, or classifies events solely by topic. By redefining an event as a multi‑dimensional construct (duration, peak, growth, relaxation) and by clustering events on the basis of their temporal shape, the authors demonstrate a novel way to extract more informative signals from social media.
Limitations include reliance on a proprietary sentiment classifier that lacks external validation, limited description of the clustering distance metric (which may affect reproducibility), and the use of daily sales data, which restricts the applicability to real‑time inventory decisions. Future research could incorporate more sophisticated deep‑learning sentiment models, higher‑frequency sales data, and additional event attributes such as user influence or hashtag diffusion paths to enhance both predictive performance and interpretability.
In summary, the study provides strong empirical evidence that differentiating Twitter events by their shape yields a more powerful predictor of retail sales spikes than treating Twitter activity as a monolithic signal. This insight has practical implications for marketers and operations managers seeking to build early‑warning systems based on social media activity.
Comments & Academic Discussion
Loading comments...
Leave a Comment