Call Graph Profiling for Multi Agent Systems
The design, implementation and testing of Multi Agent Systems is typically a very complex task. While a number of specialist agent programming languages and toolkits have been created to aid in the development of such systems, the provision of associated development tools still lags behind those available for other programming paradigms. This includes tools such as debuggers and profilers to help analyse system behaviour, performance and efficiency. AgentSpotter is a profiling tool designed specifically to operate on the concepts of agent-oriented programming. This paper extends previous work on AgentSpotter by discussing its Call Graph View, which presents system performance information, with reference to the communication between the agents in the system. This is aimed at aiding developers in examining the effect that agent communication has on the processing requirements of the system.
💡 Research Summary
The paper addresses a notable gap in the tooling ecosystem for multi‑agent systems (MAS): the lack of sophisticated profiling utilities comparable to those available for conventional programming paradigms. While many agent‑oriented languages and frameworks exist, developers still rely on ad‑hoc debugging techniques and limited performance monitors. To bridge this gap, the authors present AgentSpotter, a profiling platform specifically designed for MAS, and focus on its newest visualization component – the Call Graph View.
AgentSpotter’s architecture consists of two main parts. The AgentSpotter Service runs inside the runtime environment of an agent platform (the authors use Agent Factory as a concrete example) and records a rich set of events: agent actions, ACL messages sent and received, and system‑level metrics such as CPU and memory usage. All events are written to a snapshot file (.aspot) for offline analysis. The companion AgentSpotter Station is a desktop application that loads these snapshots and offers several visualizations: a flat tabular profile, a Space‑Time Diagram (a timeline‑based view of agent activity), and the newly introduced Call Graph.
Traditional call‑graph profilers (e.g., gprof) display hierarchical relationships between functions together with the proportion of total execution time each function consumes. The authors adapt this concept to MAS by introducing the notion of “message impact.” When an ACL message Mα is sent from agent A to agent B at time α, the impact T_{Mα,B} is defined as the total processing time spent by B from receipt of Mα until the next message is received (or until the end of the session). This interval captures all computation that is causally triggered by the original message. By recursively aggregating these impacts across all messages exchanged between two agents, they obtain a pairwise impact T_{x,y}. Summing over all receivers yields the total impact of a given sender T_x, and finally summing over all agents gives the session‑wide impact T_S. The authors also provide a formula for the overall session activity time A_S, which includes idle periods before the first message.
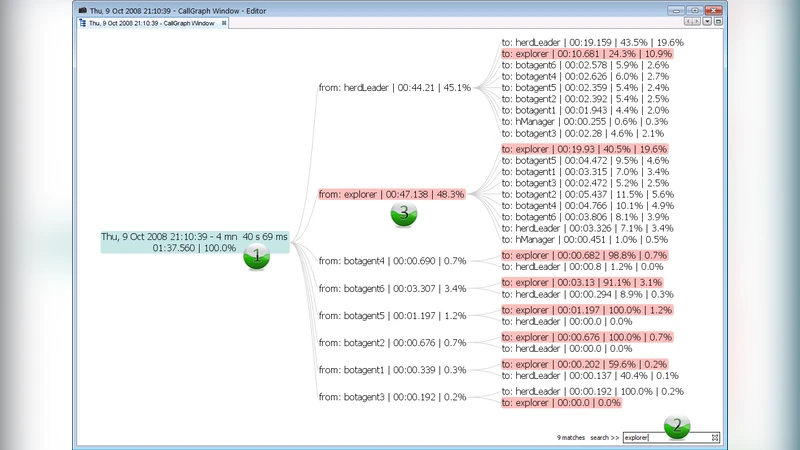
The Call Graph View visualizes this hierarchy as a fixed‑depth tree with the following levels: Session → Sender Agent → Receiver Agent → FIPA‑ACL Performative (including the message content) → Individual Message. Each node displays a label (e.g., session timestamp, agent IDs, performative, timestamps), the cumulative impact time of its children, the percentage of its parent’s impact, and the percentage of the whole session’s impact. Because MAS executions can generate thousands of messages, the UI incorporates lazy expansion, colour‑coded highlighting of the currently explored branch, keyword search, and zoom/pan capabilities to keep navigation manageable.
In the implementation section the authors describe how they instrumented Agent Factory, collected data from realistic MAS scenarios, and generated call‑graph visualizations. The case studies demonstrate that certain high‑frequency messages (e.g., “request:allocateResource”) dominate CPU consumption, allowing developers to pinpoint and optimise the corresponding interaction patterns.
The discussion acknowledges several limitations. Not all MAS are purely reactive; internal timers, environmental events, or background reasoning may also consume resources but are not captured by the current message‑impact metric. The metric also ignores other cost dimensions such as network latency, memory pressure, or I/O, suggesting that future work should incorporate multi‑dimensional profiling models. Moreover, the current approach requires platform‑specific instrumentation, which may hinder portability across diverse MAS frameworks. The authors propose extending the model to support dynamic tree depths, user‑defined aggregation levels, and real‑time analysis.
In conclusion, the paper makes a solid contribution by translating the well‑established call‑graph paradigm into the domain of multi‑agent systems. AgentSpotter’s Call Graph View provides developers with a clear, quantitative picture of how inter‑agent communication drives overall system performance, complementing existing timeline‑based tools. The work opens avenues for richer, cross‑platform MAS profiling and sets the stage for more advanced, multi‑metric performance analysis tools.
Comments & Academic Discussion
Loading comments...
Leave a Comment