Leverage Financial News to Predict Stock Price Movements Using Word Embeddings and Deep Neural Networks
Financial news contains useful information on public companies and the market. In this paper we apply the popular word embedding methods and deep neural networks to leverage financial news to predict stock price movements in the market. Experimental results have shown that our proposed methods are simple but very effective, which can significantly improve the stock prediction accuracy on a standard financial database over the baseline system using only the historical price information.
💡 Research Summary
The paper proposes a straightforward yet effective framework that combines financial news text with historical price data to predict next‑day stock price movements (up or down). Using a large corpus of Reuters and Bloomberg articles (over half a million) spanning 2006‑2013 and CRSP price data for the same period, the authors construct samples for each stock‑date pair that contain all sentences mentioning the target stock on that day. Each sample is labeled positive if the closing price the next day is higher than the previous day, otherwise negative.
Feature engineering consists of two parts. The price side uses the closing prices of the five days preceding the target date, together with their first‑ and second‑order differences, all normalized by mean and variance of the training set. The news side extracts three complementary representations:
-
Bag‑of‑Keywords (BoK) – Word2vec embeddings are trained on the training corpus. Nine manually chosen seed words (e.g., surge, fall) are used to retrieve the 1,000 most similar words in the embedding space. A TF‑IDF score for each of these words yields a 1,000‑dimensional BoK vector.
-
Polarity Score (PS) – For each keyword, point‑wise mutual information (PMI) is computed separately for positive and negative samples; the difference PMI(pos)‑PMI(neg) defines the keyword’s polarity. Dependency parsing (Stanford parser) determines whether the target stock is the grammatical subject of the keyword; if not, the polarity sign is flipped. Multiplying polarity by TF‑IDF produces another 1,000‑dimensional vector.
-
Category Tag (CT) – Ten manually defined event categories (new‑product, acquisition, lawsuit, etc.) are each seeded with a few words. Using the same word2vec model, the seed lists are expanded to the top 100 similar words per category. For a sample, the log‑count of words belonging to each category forms a 10‑dimensional CT vector.
The predictive model is a deep neural network (DNN) with four hidden layers of 1,024 ReLU units each and a softmax output layer that yields posterior probabilities for “up” and “down”. Experiments on a held‑out test set (mid‑2013) show that the baseline model using only price features attains a 48.12 % error rate. Adding BoK reduces the error to 46.02 %; combining BoK, PS, and CT yields the best result of 43.13 % error, a substantial improvement over the baseline.
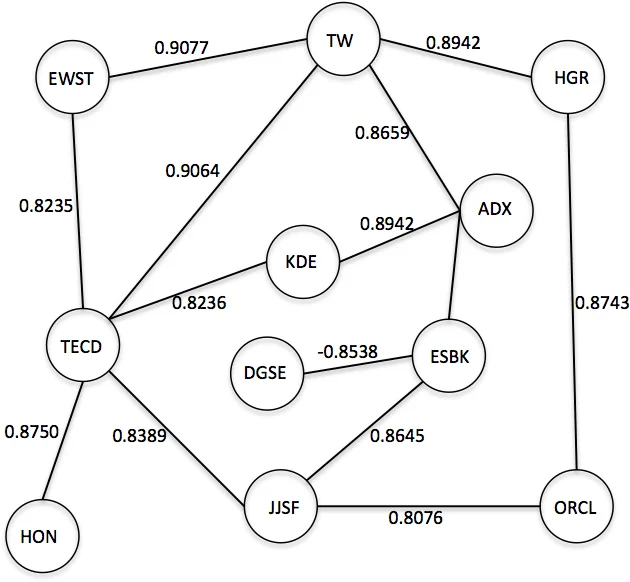
Because many stocks are never mentioned in daily news, the authors introduce a stock‑correlation graph to propagate predictions to unseen stocks. They select the top 5,000 stocks from CRSP, compute pairwise Pearson correlation of daily closing prices over the whole period, and keep edges with absolute correlation > 0.8. For each day, the DNN outputs for news‑mentioned stocks form a 5,000‑dimensional vector x (zeros for unseen stocks). Multiplying by the adjacency matrix A (x′ = A x) spreads the predictions through the graph; repeated multiplication until convergence yields scores for all stocks. By applying a confidence threshold, they can trade off coverage versus accuracy. With a high threshold (0.9) they correctly predict 52.44 % of 354 additional unseen stocks per day, while the original DNN predicts about 110 stocks per day.
The study demonstrates four key contributions: (1) embedding‑driven automatic keyword expansion, (2) syntax‑aware polarity adjustment, (3) event‑category tagging, and (4) graph‑based propagation to unseen assets. All are integrated into a relatively simple DNN architecture, yet they collectively achieve a notable reduction in prediction error on a standard financial dataset. The authors acknowledge limitations such as the manual selection of seed words, potential label noise from using next‑day price as ground truth, and the static nature of the correlation graph. Future work could explore automated seed discovery, more sophisticated labeling strategies, and dynamic graph models to further enhance performance.
Comments & Academic Discussion
Loading comments...
Leave a Comment