Educational Technology as Seen Through the Eyes of the Readers
In this paper, I present the evaluation of a novel knowledge domain visualization of educational technology. The interactive visualization is based on readership patterns in the online reference management system Mendeley. It comprises of 13 topic areas, spanning psychological, pedagogical, and methodological foundations, learning methods and technologies, and social and technological developments. The visualization was evaluated with (1) a qualitative comparison to knowledge domain visualizations based on citations, and (2) expert interviews. The results show that the co-readership visualization is a recent representation of pedagogical and psychological research in educational technology. Furthermore, the co-readership analysis covers more areas than comparable visualizations based on co-citation patterns. Areas related to computer science, however, are missing from the co-readership visualization and more research is needed to explore the interpretations of size and placement of research areas on the map.
💡 Research Summary
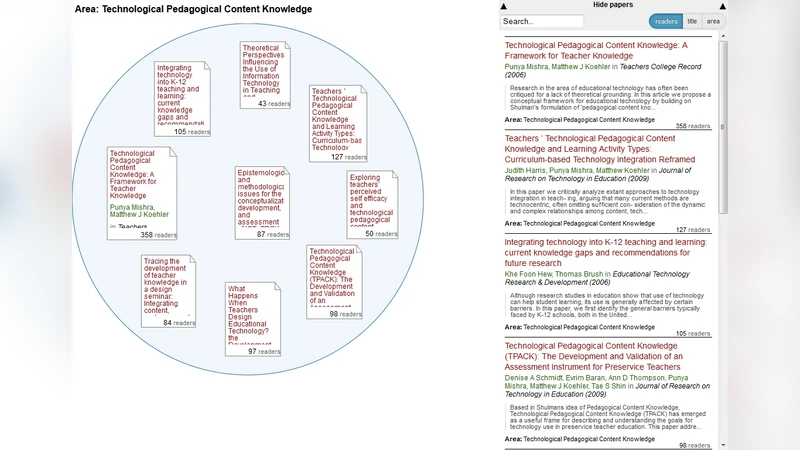
The paper introduces a novel knowledge‑domain visualization of educational technology that is built on co‑readership patterns extracted from the online reference‑management system Mendeley. Instead of the traditional citation‑based approaches, the authors construct a weighted, undirected network where the edge weight between two papers reflects how many Mendeley users have saved both documents. After cleaning a corpus of roughly five thousand education‑technology papers, they apply multidimensional scaling to obtain a two‑dimensional layout and then use k‑means clustering to identify thirteen coherent topic clusters. These clusters span psychological and pedagogical foundations, learning methods and associated technologies, as well as broader social and technological developments.
To evaluate the map, the authors conduct two complementary analyses. First, they perform a qualitative comparison with a co‑citation map generated from the same dataset. The co‑readership map shows a markedly more recent picture of the field: newer papers and emerging sub‑topics appear prominently, whereas the co‑citation map emphasizes older, highly cited works. Moreover, the co‑readership visualization captures a broader set of areas, especially those rooted in education and psychology, which are often under‑represented in citation‑driven maps. However, domains that are traditionally associated with computer science and engineering are largely absent, a gap the authors attribute to the composition of Mendeley’s user base, which leans heavily toward education and social‑science scholars.
Second, the authors interview eight experts in educational technology. The interviewees confirm that the co‑readership map provides a useful, up‑to‑date overview of research trends and that its richer granularity in pedagogical and psychological topics is valuable for both scholars and practitioners. At the same time, they raise concerns about the interpretability of visual cues: the size of a cluster could be read as “research activity” or “community interest,” but no standardized metric currently exists, and the spatial distance between clusters, while intuitively suggesting thematic proximity, lacks quantitative validation. The experts also note the missing computer‑science clusters and suggest that integrating additional data sources (e.g., other reference managers, citation indexes) could mitigate this bias.
In summary, the study demonstrates that co‑readership‑based visualizations can complement traditional citation‑based maps by offering a timelier, more inclusive representation of the educational technology landscape. Nevertheless, the approach is limited by user‑population bias and by the current lack of clear, empirically grounded interpretations for node size and inter‑cluster distances. Future work should aim to combine multiple altmetric sources, develop robust metrics for visual encoding, and explore methods to systematically incorporate under‑represented technical domains, thereby producing a more balanced and analytically rigorous map of the field.
Comments & Academic Discussion
Loading comments...
Leave a Comment