SANTA: quantifying the functional content of molecular networks
Linking networks of molecular interactions to cellular functions and phenotypes is a key goal in systems biology. Here, we adapt concepts of spatial statistics to assess the functional content of molecular networks. Based on the guilt-by-association …
Authors: Alex J. Cornish, Florian Markowetz
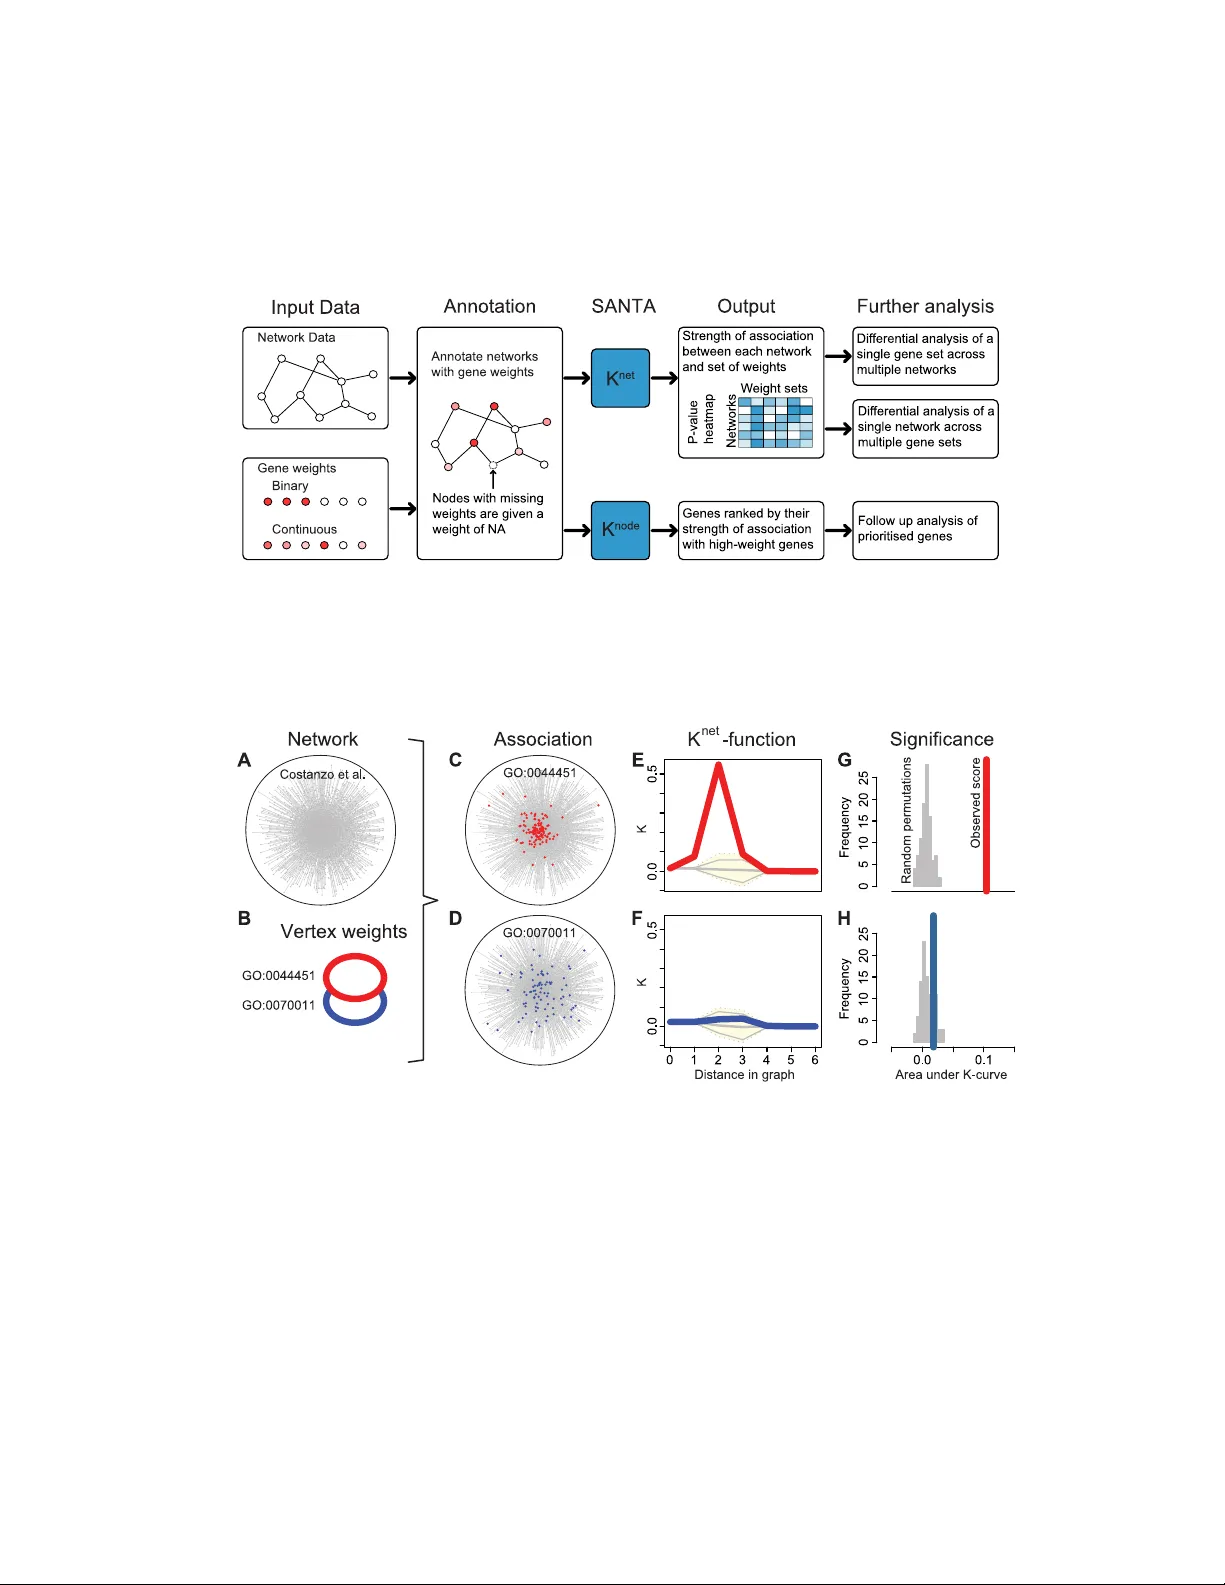
1 SANT A: quan tifying the functional con ten t of molecular net w orks Alex J. Cornish 1 and Florian Mark ow etz 2 ∗ 1 Departmen t of Life Sciences, Imp erial College London, London, United Kingdom 2 Cancer Research UK Cam bridge Institute, Univ ersity of Cambridge, Cam bridge, Cambridgeshire, United Kingdom ∗ E-mail: florian.mark ow etz@cruk.cam.ac.uk Abstract Linking net works of molecular interactions to cellular functions and phenot yp es is a k ey goal in sys- tems biology . Here, we adapt concepts of spatial statistics to assess the functional con tent of molecu- lar netw orks. Based on the guilt-b y-asso ciation principle, our approac h (called SANT A) quantifies the strength of asso ciation b etw een a gene set and a netw ork, and functionally annotates molecular netw orks lik e other enric hment metho ds annotate lists of genes. As a general association measure, SANT A can (i) functionally annotate exp erimentally derived netw orks using a collection of curated gene sets, and (ii) annotate exp erimen tally derived gene sets using a collection of curated netw orks, as well as (iii) pri- oritize genes for follo w-up analyses. W e exemplify the efficacy of SANT A in sev eral case studies using the S. c er evisiae genetic in teraction net work and genome-wide RNAi screens in cancer cell lines. Our theory , simulations and applications show that SANT A provides a principled statistical w a y to quantify the asso ciation b et ween molecular netw orks and cellular functions and phenot yp es. SANT A is a v ailable from h ttp://bio conductor.org/pac k ages/release/bio c/h tml/SANT A.html. Author Summary Molecular netw orks are maps of the tens of thousands of interactions that o ccur b et ween the comp onen ts of biological systems. Types of interactions include physical, genetic and functional interactions b et ween genes, gene products and metabolites. Netw ork-based approac hes to molecular biology are increasingly b eing used to b etter understand cellular functions. Currently , gene set metho ds can b e used to function- ally annotate the hits from high-throughput studies; ho wev er, no metho ds exist to functionally annotate molecular in teraction netw orks. This greatly limits our ability to quantify the often subtle functional adaptions that occur in netw orks as they re-wire to respond to external stim uli. Here, we extend well- tested concepts from spatial statistics to define a general asso ciation measure b et ween net works and gene sets. Lik e Gene Set Enrichmen t Analysis, our approach measures concordan t c hanges, but does this on net works, rather than on lists of genes. W e v alidate it both in simulations and real-world case studies. W e apply our approach to genetic in teraction netw orks mapp ed under different conditions and created using different metho ds, and demonstrate how it extends the previous analyses of data sets, allowing us to b etter understand the high-level changes that o ccur within cells. In tro duction High-throughput studies, like measuring differen tial expression in RNA-seq experiments or morphologi- cal changes in RNAi screens, produce genome-wide data that are often difficult to in terpret. F unctional annotation of hits in such studies relies mostly up on gene set analysis metho ds, which measure an asso- ciation betw een hits and pre-defined gene sets [1, 2] b y quantifying ov erlap [3] or concurren t trends [2]. These approaches generally treat hits as indep enden t; only very few exploit an internal structure [4]. 2 Recen tly , many high-throughput studies hav e pro duced netw orks of physical [5, 6] or genetic [7 – 9] inter- actions, rather than lists of hits. These netw orks can b e even harder to interpret than lists of hits. While more and more net works are b eing generated, rigorous statistical metho ds to annotate their functional con tent are lacking, thereby making it difficult to identify and quan tify any high-level changes. The need for rigorous functional analysis of netw orks b ecomes esp ecially evident when trying to quantify the often subtle functional adaptions observ ed in netw orks sp ecific to external stim ulation [10, 11], differen t phenot yp es [9], cell t yp es [12, 13], or diseases [14, 15]. Here, we dev elop metho dology , called SANT A, for the rigorous and unbiased functional annotation of molecular netw orks. The basic input to SANT A are a netw ork and a gene set and the output is the statistical significance of their asso ciation (Figure 1). Lik e Gene Set Enric hment Analysis [2], SANT A measures concordant c hanges in phenot yp e, but extends this concept to net works rather than lists of genes. Our work is directly motiv ated by a study describing the functional con tent of the S. c er evisiae genetic interaction netw ork b y Costanzo et al. [7]. The iconic first figure of this pap er shows a net work connecting genes with similar genetic in teraction profiles and no des highligh ted according to their mem- b ership to functional groups defined by the Gene On tology . Costanzo et al. find that genes displaying tigh tly correlated profiles form discernible clusters corresponding to distinct biopro cesses and that the relativ e distance b et ween distinct clusters appears to reflect shared functionalit y [7]. This is an imp ortan t observ ation, b ecause it sho ws whic h cellular functions are associated with the genetic in teraction netw ork. If the netw ork had b een generated under different exp erimen tal conditions that activ ate different pro- cesses in the cell, these functional associations would most probably hav e c hanged. Using SANT A, it is p ossible to quan tify the significance of these c hanges in functional asso ciation in a principled statistical w ay , something not previously p ossible. SANT A rigorously implements an intuitiv e asso ciation measure The roadmap for functional analysis of netw orks provided b y Costanzo et al. [7] relies on assessing the clustering of selected nodes on the net work. How ever, their analysis w as done b y ey e and dep ends not only on the gene set and the net work but also on the visualisation algorithm used. Cluste ring on a netw ork is an intuitiv e measure of functional conten t, but without rigorous statistical metho ds the significance of observ ed patterns can not b e assessed ob jectively . T o address this problem, w e ha ve adapted well-tested concepts from spatial statistics [16] to define an ob jective and quantitativ e asso ciation measure b et ween net works and gene sets. SANT A (spatial analysis of network asso ciations) is built on the guilt-by-association principle: if a gene set sho ws a surprising degree of clustering on a net work, w e call them ‘associated’ (Figure 2C); if the gene set is randomly distributed o ver the netw ork, we call them ‘not asso ciated’ (Figure 2D). Previous researc h Enrichmen t analysis is a w ell-developed field and Khatri et al [4] recen tly described three ‘generations’ of statistical metho ds, from ov er-representation analysis and functional class scoring, to path wa y-top ology based approac hes. While metho ds in the last category [17 – 19] use path wa y topology to compute gene-level statistics, none of them can b e directly applied to measure the functional con tent of a netw ork. Two related approac hes, the compactness score of PathExpand [20] and EnrichNet [21], compare the clustering of tw o sets of genes on a net work, but not the significance of the clustering of a single set. While the compactness score can b e adapted to measure the significance of clustering, it fo cusses on the lo cal structure of the netw ork and can be less effectiv e than SANT A to detect global effects, as we show b elo w. Other approac hes o v erlay in teraction netw orks with genome-wide measurements and iden tify enriched subnetw orks [22 – 24], to which enrichmen t analysis can then b e applied in a consecutive step [25]. Again, subnetw ork iden tification do es not directly measure the association b et ween gene sets and net works, and we show the effect of this difference in a comparison study . In summary , no approac h c urren tly exists that, like SANT A, globally assesses the functional conten t of a net work. In the following, w e describe the metho dology underlying SANT A and test its efficacy by applying it to both sim ulated and real data. Gene set enrichmen t metho ds hav e had a big impact on 3 biological researc h and are used in almost every analysis of experimentally derived gene lists. The case studies we presen t in this pap er show that SANT A has the potential to hav e a similar impact on all functional studies of net work data. Results Adapting Ripley’s K-F unction for net works Spatial statistics mo del spatial correlation structures b etw een observ ations (analogous to how time series analysis mo dels the correlation b et w een time points) [26]. One area of spatial statistics analyses p oin t patterns and asks if p oin ts in R 2 are occurring at random or cluster together in an y w ay . A basic tool for the analysis of p oin t patterns is Ripley’s K -function [16], which can b e estimated b y computing how man y other p oin ts are captured by drawing a circle of radius s around eac h p oin t: K ( s ) = 1 λn X i X j 6 = i I ( d ( i, j ) < s ) (1) where n is the num b er of p oin ts, λ is the densit y (num b er of p oin ts p er unit area), d ( i, j ) is the distance b et ween tw o p oin ts in R 2 , and I ( d ( i, j ) < s ) is an indicator function with v alue 1 if the distance d ( i, j ) b et ween points i and j is smaller than s , and 0 otherwise. If the p oin ts are densely clustered, most of them will b e found for small v alues of s , while for uniformly spread p oin ts the K ( s ) function ac hieves larger v alues only for large v alues of s . Applications of the K -function in computational biology include detecting host factors inv olved in virus infection by observing the clustering of infected cells in siRNA screening images [27]. In our scenario, w e measure observ ations at fixed locations (the nodes in the graph) instead of random lo cations in the plane. How ever, we can still adapt basic spatial statistics metho dology: In the following paragraphs we will define a K -function for w eighted netw orks, called K net , by first defining distance measures on graphs (instead of R 2 ) and then weigh ting eac h node by the strength of its phenotype. T o adapt K ( s ) to netw orks, we formalised the problem using a node-lab eled and edge-weigh ted graph G = ( V , E ), where V is a set of n no des (vertices) and E ⊆ V × V a set of m (undirected) edges b et ween pairs of nodes ( i, j ). Node weigh ts { p v | v ∈ V } corresp ond to the strength of a gene’s phenotype ( p v ∈ R , v ∈ V ) or whether the gene is part of a particular functional group ( p v ∈ { 0 , 1 } , v ∈ V ) and e dge weigh ts { w e | e ∈ E } corresp ond to the strength or significance of interactions. Graph distances Distances betw een non-neigh b ouring no des in this graph can b e measured in man y w ays, including shortest path lengths, diffusion kernels [28] and the mean first-passage time [29], which are all implemented in the SANT A soft w are pac k age. There are subtle differences in the asp ects of the net work structure incorp orated within each measure. F or example, a shortest-path approach will only take in to c onsideration the one path with the shortest length, no matter how many other paths exist b et ween t wo nodes. A diffusion k ernel, on the other hand, takes in to account all paths and will yield a smaller distance the better connected t wo no des are. The results pro duced b y SANT A are generally robust across distance measures (Figure S3), meaning that it often do es not matter which metho d is c hosen b y the user. The shortest path distance method requires the least computational time and therefore w e will mainly use this method in the paper. Efficient algorithms lik e Dijkstra’s or Jonsohn’s exist to compute shortest paths b et w een all pairs of nodes [30] and are conv eniently implemented in softw are pack ages like ‘igraph’ [31]. Ho wev er, the diffusion-k ernel based distance measure is used to identify enriched subnetw orks, as this metho d is seen to pro duce denser subnetw orks. Man y of the graph distance algorithms assume that small edge-w eights corresp ond to stronger func- tional asso ciation betw een the tw o no des. Man y netw orks, ho wev er, are built by correlation analysis, where stronger functional asso ciations are shown by a larger w eight. Thus, in practice, the edge weigh ts 4 in a given molecular netw ork often need to b e rew eighed to be used as graph distances { d e | e ∈ E } . Due to differences betw een the metho ds used to create each molecular net work, it is necessary to use a differen t approach when reweighing the edges of each net work. Edges are reweighed so that the strongest in teractions ha ve a graph distance of 0 and the weak er the interaction the greater the distance (see Metho ds). No de w eigh ts Exchanging the planar distance d ( · , · ) in Equation (1) with a graph distance d g ( · , · ) directly results in a version of the K -function that is applicable if the node weigh ts are in { 0 , 1 } . How ev er, in many real situations, e.g. differential expression analysis or large-scale RNAi screens, the no de weigh ts are real n um b ers. In this case it is not only of in terest how many ‘hits’ are close to each no de, but also how str ong these hits are. W e implemen t this notion b y w eighting the contribution of each no de by the relativ e weigh t it carries compared to the other no des. This results in a function K net of the form K net ( s ) = 2 ( ¯ pn ) 2 X i p i X j ( p j − ¯ p ) I ( d g ( i, j ) ≤ s ) (2) where p i is the phenotype observed at no de i and ¯ p = 1 n P n i =1 p i . This re-weigh ting is very similar in spirit to the re-weigh ting of the Kolmogorov-Smirno v statistic in GSEA [2]. Generally , we plot K net from 0 to the maximal distance within the graph (the diameter), in which case K net forms a curve starting and ending at 0 (Figure S1). No de-wise K-function The inner sum of Equation (2) offers a natural wa y to prioritise nodes and iden tify candidate genes for the mechanisms underlying the observed phenotype. W e define this node-wise K -score as the A UK of the no de-wise K -function, defined as: K node i ( s ) = 2 ¯ pn X j ( p j − ¯ p ) I ( d g ( i, j ) ≤ s ) (3) Computing significance by p ermutation T o chec k how significant observ ed K net results are, we compare them to curv es obtained by applying K net to sets of randomly p ermuted hits. These sets of p erm uted hits are obtained b y randomly redistributing the no de w eights across the no des. When p erm uting the no de weigh ts, it is not alwa ys p ossible to maintain the degree of each node, therefore, no de degree is not considered when p ermuting the weigh ts. Since w e w ant to quantify the amount of clustering, we are in terested in observed K net -curv es that ascend steeper than random curves. T o quantify this, we compute for all curves (the observ ed K net and the N perm random permutations) the ar e a under the K net -curve , or A UK v alue. An empirical p-v alue for the observ ed A UK is calculated using a Z-test. Figure 2 exemplifies the application of K net to t wo GO terms and the y east genetic interaction netw orks. Sim ulation studies SANT A successfully identifies clustering on sim ulated netw orks F unctional annotation is an exploratory task without a general gold standard. In order to test the abilit y of SANT A to correctly iden tify clustered distributions of no de w eights on netw orks, w e conducted a num b er of controlled sim- ulations. In each of these simulations, we created a net work con taining a cluster of high weigh t vertices of a known strength and applied the K net -function in order to determine whether it would successfully iden tify the clustering. Eac h of the netw orks contained 500 no des and was created using the Barabasi-Albert mo del of pref- eren tial attac hment [32]. A seed node w as c hosen at random. All no des in the netw ork w ere rank ed b y 5 their distance (using the shortest paths method) to the seed node and the s closest no des c hosen to b e the sample set. A hit set was the created by c ho osing 5 nodes at random from the sample set. Different v alues of s (10, 20, 50, 100 and 500) w ere chosen to sim ulate differen t clustering strengths. A v alue of s equal to the num b er of nodes in the netw ork is the same as randomly sampling no des from the en tire net work. As exp ected, SANT A iden tified more significan t clustering when applied to hit sets created with smaller v alues of s (Figure 3A). When no des are randomly sampled from the entire netw ork, the p-v alues returned by SANT A were uniformly distributed (Figure 3B), as exp ected when the null h yp othesis is true. SANT A incorp orates the global structure of a net work for functional association One of the main adv antages of the K net -function is that it considers the global top ology of a netw ork when measuring the significance of clustering. This can be demonstrated b y comparing the K net -function to an adapted v ersion of the compactness score [20]. The compactness score of a gene set is the mean distance b et ween pairs of no des in the gene set. It is used b y the PathExp and to ol to compare the clustering strength of different sets of nodes [20]. By comparing the compactness score of an observed set of nodes to the compactness scores of permuted sets of no des, it is possible to produce an empirical p-v alue describing clustering significance, m uch like the K net -function. Man y real-world net works follo w a p o wer-la w degree distribution and contain nodes with b oth a small and large num b er of interacting partners [32]. If the genes in a gene set all hav e a large num b er of in ter- acting partners, then the presence of interactions b et ween the genes in the gene set could be considered less significan t, as there is a greater likelihoo d that they w ould be observ ed b y c hance. Therefore, it is nec- essary to incorp orate the global structure of the netw ork and consider the num b er of no des lo cated near eac h no de when quantifying clustering significance. Figure 4 demonstrates that while the K net -function incorp orates the global structure of the netw ork, the compactness score do es not. The K net -function can also b e applied to contin uous distributions of no de weigh ts, while the compactness score can only b e applied to binary sets, limiting its application. F or these reasons, the K net -function is better suited to measuring the significance of clustering of no de weigh ts on real-world netw ork. SANT A pro vides a complementary metho d of iden tifying enriched subnetw orks Next, we compared SANT A to approaches that o verla y molecular netw orks with additional no de information and iden tify a high-scoring subnetw ork, using simulated and real data. A widely used example is BioNet [24], whic h identifies enriched subnet works of nodes b y fitting a b eta-uniform mixture (BUM) mo del to the net work in order to score no des. Positiv e-scoring nodes are then aggregated and a minim um spanning tree calculated betw een these p ositiv e no des. How ever, the presence of negative-scoring nodes b et ween clusters can preven t BioNet from identifying multiple clusters. As the K node -function considers each no de individually , it is able to return high-scoring no des spread across multiple clusters. W e conduced a n umber of sim ulations in order to compare the abilities of K node and BioNet to iden tify high-scoring no des lo cated within m ultiple clusters on a netw ork. In each simulation, a netw ork con taining 1000 no des w as created using the Barabasi-Alb ert model of preferential attac hment [32]. 2, 3 or 4 no des from distant parts of the netw ork w ere selected to seed the clusters. F or each seed node, 10 nodes were selected at random under a probability distribution that ensured that the probabilit y of b eing chosen decreased exp onentially with the distance from the seed no de ( P ( i ) ∼ 10 − d g ( k,i ) , where k is the seed no de). The selected no des b ecame the high-w eight nodes and w ere assigned no de weigh ts from a truncated normal distribution with a mean of 0 and a standard deviation of 1 × 10 − 6 , within the interv al [0 , 1]. Unselected no des were assigned no de weigh ts from the uniform distribution, again within the interv al [0 , 1]. K node and BioNet were then applied to the net work. If x high-weigh t nodes are applied to the netw ork, K node is said to hav e successfully identified a high-weigh t no de if it is rank ed within the top x no des. BioNet successfully identifies a high-w eight no de if it is contained within the 6 returned enriched subnetw ork. Figure 5 sho ws that K node w as able to successfully iden tify a greater prop ortion of labelled no des than BioNet when 3 or more clusters w ere added to the netw ork. BioNet tended to successfully identify nodes from a single cluster, but missed no des contained within others. This highligh ts an adv antage of SANT A ov er metho ds iden tifying a single top scoring subnetw ork. Real-w orld case studies SANT A identifies functionally-informative enriched subnet works W e also compared the K node - function to BioNet by rerunning the v alidation experiment conducted by BioNet. Gene expression data from tw o subtypes of diffuse large B-cell lymphomas (DLBCL) was combined with surviv al data [33]. P- v alues were pro duced using Co x regression and these w ere con v erted into no de w eights which were used to annotate the HPRD interaction net w ork [34]. BioNet and the K node -function w ere applied in order to identify enriched subnetw orks. BioNet returned a mo dule containing 38 genes and 49 in teractions. In order to make a fair comparison, the 38 genes ranked highest by K node w ere c hosen to form the K node mo dule. This mo dule is denser than the BioNet netw ork and contains 86 interactions. Only 7 genes w ere iden tified by b oth BioNet and K node . The BioNet module is enric hed with genes inv olved in the onco- genic NF κ B path wa y [24]. Fisher’s exact test was used to iden tify functional gene sets enric hed within the mo dules [35]. While the K node mo dule is not enriched with NF κ B pathw ay genes, the cancer-asso ciated GO term ‘regulation of ap optosis’ was identified as the most strongly-enriched gene set ( p < 1 × 10 − 7 ). These results demonstrate that the K node function represen ts a complemen tary method of enriched subnet work identification. How ever, the main purp ose w e en vision for SANT A is to annotate the func- tional con tent of netw orks and the next case studies fo cus on this task. Correlations in GI profile pro duce functionally more informative netw orks F or further v al- idation, w e applied SANT A to the global genetic in teraction (GI) net work of S. c er evisiae , where there is evidence that protein function is more closely related to the global similarity b et ween GI profiles than to individual in teractions [7]. T o measure this effect w e contrasted the functional conten t of a net work of high correlations b etw een GI profiles with a netw ork of individuals GIs. This w as done b y quantifying the strength of asso ciation of sets of functionally related genes with eac h of the netw orks using the K net - function. Sets of functionally related genes w ere obtained from the Gene On tology (GO). T o ensure that the functional sets were not to o thinly or thickly spread, only GO terms asso ciated with b et ween 20 and 100 netw ork genes were tested. Figure 6A shows that GO terms indeed tend to cluster more strongly on the correlation netw ork than on the netw ork of individual GIs, demonstrating that similarity b et ween GI profiles is a stronger indication of shared protein function. This effect was indep endent of the GO term size and strongest for sp ecific cellular functions like ‘structural constituent of rib osome’, ‘cytosolic small rib osomal subunit’ and ‘piecemeal microautophagy of nucleus’ (T able S1). Y east interaction netw orks functionally rewire under external stress Most studies hav e mapp ed GIs in cells under normal lab oratory conditions [7, 8, 36]. How ever, it has been demonstrated that GIs can b e condition-dep endan t [37]. Mapping GI netw orks under multiple conditions is therefore likely to reveal new information ab out how a cell reorganises itself to cope with environmen tal conditions. T o measure these effects, we used SANT A to analyse the c hanges in functional conten t that o ccur in S. c er evisiae GI net works under external p erturbation by the DNA-damaging agen t meth yl methane-sulfonate (MMS) [10] and UV radiation [38]. W e again used the asso ciation strength of GO term-asso ciated gene sets to quan- tify functional enric hment within each net work. By comparing the asso ciation strengths of the GO terms b et w een the treated and untreated net works, it is p ossible to iden tify pathw ays and processes that are up- and do wn-regulated in response to the c hanges in environmen tal condition. GO terms were applied to eac h netw ork if they asso ciated with b etw een 20 and 100 genes. 7 W e found sev eral GO terms that asso ciated more strongly with the MMS-treated net work than the un treated netw ork (Figure 6B and T able S2). GO terms related to the resp onse to DNA-damage, including ‘DNA repair’, ‘response to DNA damage stimulus’ and ‘co v alen t c hromatin modification’, asso ciated more strongly with the MMS-treated netw ork. This result is exp ected and found in the original publication, thereb y providing further v alidation for SANT A. Comparing the functional enrichmen t of the UV-treated net work replicates the finding of the original publication as well as iden tifying subtle c hanges not reported in the publication (Figure 6B and T able S3) [38]. The top 10 GO terms most strongly enric hed within the UV-treated netw ork are related to DNA- damage repair or cell cycle progression; pro cesses known to b e affected by exp osure to UV radiation [39]. Ho wev er, the K net -function is also able to identify processes affected b y UV-treatment not rep orted in the original publication. ‘Chomatin silencing at telomere’ asso ciates more strongly with the un treated net work ( p < 1 . 6 × 10 − 8 ) than the treated netw ork ( p < 3 . 4 × 10 − 5 ). It has previously b een demonstrated that some of the proteins inv olved in transcriptional silencing at the telomeres, suc h as Sir and Ku , are also inv olved in DNA-damage repair [40] and are disp ersed from the telomeres in resp onse to DNA damage [41]. Our results provide further supp ort for this hypothesis and demonstrate that the K net - function is able to provide insight into the functional repurp osing of cells that cannot be provided by curren t metho ds. The strength of gene set asso ciation w as independent of gene set size (Figure S2). Asso ciation strength is also robust across distance metho ds (Figure S3). SANT A identifies functional adaptions not seen in the original analysis and thereby also provid es a metho d of hypothesis generation. The adv antage of SANT A is that it directly contrasts the functional conten t of the t wo netw orks, which improv es on the indirect enric hment analysis of differing edges in the original analysis [10]. In teraction netw orks provide differen t levels of information ab out cancer cell line main- tenance Different netw orks describ e different asp ects of cellular machinery: co-expression netw orks describ e transcriptional effects, protein interaction netw orks describe complexes and genetic in teraction net works describ e epistatic buffering relationships. Iden tifying the type of net work that asso ciates most with genes of in terest can p oin t to the mechanism underlying observed phenot yp es. T o exemplify this idea, we used SANT A to asso ciate RNAi screens in cancer cell lines [42] to a curated netw ork of physical in teractions [43] and to a functional interaction net work created b y com bining 21 data sources from 4 sp ecies [44], with the aim of identifying the netw ork that b est explains the phenotype. The colon and o v arian cancer cell line RNAi hits w ere seen to asso ciate more strongly with the functional in teraction net work (Figure 6C), indicating that is is p ossible to create a net work that better explains the mec hanisms that main tain cancer cell line viability by combining m ultiple data source. Discussion SANT A is a general approach for functional annotation that extends enrichmen t analysis from gene sets to netw orks. SANT A com bines the guilt-b y-asso ciation principle, which is one of the most p o werful paradigms for function prediction, with w ell-tested concepts adapted from spatial statistics. In this w ay , SANT A provides a rigorous implementation of an intuitiv e measure of functional annotation. W e ha ve applied SANT A to sev eral datasets from different organisms and our results sho w how SANT A rigorously addresses the basic question of whic h functional pro cesses are reflected in a netw ork. In y east, our results on genetic interactions supp ort the idea that a strong correlation of GI profiles b et w een tw o genes is a greater indicator of shared function than the presence of a single GI. The reason for this increase in functional information is most probably that individual GIs don’t b ear muc h evidence for underlying mec hanisms, while ha ving many GI partners in common is strong evidence for genes acting in the same pathw a y or complex [45]. Additionally , Costanzo et al. [7] noted that their netw ork captured only 35% of the previously reported in teractions, indicating that a large num b er of false p ositiv es and 8 false negativ es may be present within GI netw orks. Net works of correlation in GI profile may be more robust to the high n umber of errors that are present when GIs are mapp ed. Extending these results to netw orks rewired under external stim ulation, we show how SANT A quan- tifies subtle functional changes. In human, we show ed how SANT A can contribute to understanding the mec hanisms underlying large RNAi screens. T esting the asso ciation of hits with many different netw orks (transcriptional, proteomic, genetic) can help us to understand which cellular mec hanisms underly the phenot yp es. In summary , our results supp ort that SANT A accurately quantifies the functional con tent of net works, p oin ts to mechanisms underlying observed phenotypes, and pro vides a natural wa y to compare functional c hanges across netw orks. W e exp ect SANT A to con tribute mostly to the functional annotation of net works deriv ed under differen t environmen tal conditions (like the GI netw orks we used as case studies here). Ho wev er, SANT A is a v ery general approach and the examples we presented here also show other uses: it can also b e used to annotate RNAi hits (if different functional netw orks are a v ailable) and prioritise individual hits o ver others (using K node ). In the future, we see man y further opportunities for applying SANT A. F or example, new metho ds of automated, single-cell phenot yping measure genetic interaction net works across a broad sp ectrum of phenot yp es [9] and a functional annotation method like SANT A could hav e great impact on understanding whic h cellular pro cesses are reflected in which phenot yp e. Another p oten tial application for SANT A lies in netw ork-based medicine, where drug dev elopment for complex diseases is dev eloping tow ards targeting dynamic net work states [46–48] and net work-based analysis has iden tified cancer subtypes [49]. F unctional annotation of these net works will further our understanding of the biology underlying these diseases. Gene set enric hment analysis is the first step in the unbiased analysis of most exp erimen tally deriv ed gene lists and w e exp ect SANT A to hav e a similar impact on all functional studies of netw ork data. Metho ds Shortest paths distance measure There are a n um b er of differen t metho ds a v ailable to calculate the distance betw een a pair of nodes in a netw ork. One of the simplest metho ds inv olv es iden tifying the shortest path connecting the no de pair and using the length of this path. The shortest paths distance measure can b e applied to netw orks with or without w eighted edges. In unw eighted netw orks, the shortest path is equal to the n umber of edges included within the shortest path. In weigh ted net works, it is the sum of the edge w eights along the shortest path. A num b er of different algorithms are a v ailable to compute the shortest path b et ween t wo no des. Whic h algorithm is most efficient dep ends on the t yp e of net work b eing analysed. If no edge weigh ts are presen t, then the breadth-first search algorithm is ideal. If edge weigh ts are present and each edge weigh t is non-negativ e, then Dijkstra’s algorithm is more efficient [30]. Diffusion k ernel-based distance measure The diffusion k ernel-based distance measure is another metho d of calculating distances b et ween pairs of no des [28]. An adv antage of the diffusion k ernel-based metho d ov er the shortest-paths metho d is that whilst the shortest-paths metho d calculates the distance along a single path, the diffusion k ernel-based metho d incorp orates distances along m ultiple paths. Like the shortest paths method, the diffusion k ernel- based method can also b e applied to net works with or without edge w eights. One in terpretation of the metho d is the contin uous time limit of a random w alk across the net work, resulting in highly-connected no des b eing asso ciated with smaller no de pair distances. 9 The negativ e graph Laplacian ( H ) is used to create a diffusion kernel for the netw ork. H is a square matrix of size V × V with entries: H unw eighted ij = 1 when i ∼ j − d i when i = j 0 when i / j (4) H weigh ted ij = w ij when i ∼ j − P j w ij when i = j 0 when i / j, (5) H is sp ecified for netw orks with and without edge weigh ts. i ∼ j indicates that no de i and node j are connected by an edge and i / j indicates that they are not directly connected. d i is the num b er of edges asso ciated with no de i (the degree of no de i ). w ij is the weigh t of the edge connecting nodes i and j . The diffusion kernel can then b e defined b y calculating the matrix exp onential ( D ): D = lim n →∞ 1 + β H n n = exp( β H ) (6) The fact that H is diagonalizable ( H = U ∆ U − 1 ) mak es it easier to compute D . If ∆ is a diagonal matrix with entries ( δ i ) i =1 ,...,n , then D = exp( β H ) = U exp( β ∆) U − 1 . exp( β ∆) is a diagonal matrix with en tries (exp( β δ i )) i =1 ,...,n [28]. Mean first-passage time-based distance measure Mean first-passage time (MFPT) can also b e used to compute the distances b et ween pairs of no des [29]. The MFPT-based measure is similar to the diffusion k ernel-based measure in that it can b e compared to completing a random walk across the netw ork. The MFPT of a walk from no de i to no de j ( m i,j ) represen ts the exp ected n umber of steps required to reach no de j for the first time: m i,j = ∞ X n =1 n f ( n ) i,j (7) where f ( n ) i,j is the probability that the random w alk reac hes no de j for the first time after n steps. The MFPT b et w een each no de pair can b e computed analytically using the equations: M = ( I − Z + EZ dg ) D (8) Z = ( I − e π T − A ) − 1 (9) where I is the identit y matrix, E is a matrix with equal dimensions containing only 1s, e is a column v ector containing only 1s, π is a column vector of the stationary distributions of the Marko v chain, A is the Mark ov chain transition matrix and D is a diagonal matrix with elements: d v v = 1 π ( v ) (10) 10 Costanzo et al. yeast GI netw orks Costanzo et al. tested for genetic in teractions (GI) betw een 5.4 million gene pairs in S. c er evisiae using syn thetic genetic arra y (SGA) analysis [7]. Using this data, we created t wo interaction netw orks: the first from ra w GI scores ( ) and the second from correlations in in teraction profile. The ra w interaction net work contains b oth p ositiv e ( > 0 . 16) and negativ e ( < − 0 . 12) interactions (78,701 in teractions b et w een 4,326 genes). GI scores were conv erted into edge distances by calculating: d e = − log 10 | | | | max (11) The correlation net work w as created b e computing, for eac h gene pair, P earson’s correlation co efficien t for the resp ectiv e rows of the complete GI matrix. P airs of genes were connected in the netw ork if their in teraction profile correlation coefficient exceeded a threshold. Using a threshold of P C C > 0 . 125 ensured that the correlation netw ork con tained a similar num b er of interactions to the raw netw ork (76,434 in teractions b et w een 4,326 genes). Correlation co efficients ( c e ) were con verted into edge distances by calculating: d e = − log 10 c e (12) Bandy opadh ya y et al. y east GI net works 174,000 gene pairs w ere tested for interactions in MMS-treated and un treated S. c er evisiae [10]. Mo dified T-tests were used to compare the gro wth rate of the observ ed double mutan t against the rate exp ected giv en that no interaction exists. W e previously demonstrated that a strong correlation in GI profiles is a greater indicator of shared function than raw interactions. Therefore, w e created a correlation net work for each condition by computing P earson’s correlation co efficien t for eac h gene pair. A threshold of P C C > 0 . 3 for the MMS-treated net work and P C C > 0 . 25942 for the untreated net work w as applied to ensure that each net work con tained an equal num b er of in teractions (3067 interactions betw een 419 genes). Correlation coefficients w ere conv erted into edge distances using Equation 12. Sriv as et al. y east GI netw orks 45,000 gene pairs were tested for interaction in S. c er evisiae treated with high doses of UV radiation (80 J /m 2 ) and un treated S. c er evisiae . Modified T-tests were used to pro duce interaction scores ( S ) for eac h of the gene pairs. T o o few gene pairs were tested to build a GI correlation net work and therefore net works of raw in teractions w ere created. Pairs of genes w ere connected in the net works if S > 1 . 25 or S < − 1 . 25. The UV-treated netw ork contains 5,799 interactions b et ween 1,406 genes and the un treated net work contains 6,270 interactions b et ween 1,406 genes. In teraction scores were con verted into edge distances b y calculating: d e = − log 10 | S | | S | max (13) In tAct ph ysical and genetic interaction netw ork In tAct is an op en source database for molecular interaction data [43]. H. sapien data from the database w as downloaded on 2013-05-02 to create the biological netw ork used in Figure 7. This net work con tains 6,856 genes and 21,291 in teractions. No confidence scores w ere a v ailable for the in teractions and therefore no edge distances are asso ciated with the netw ork. 11 HPRD ph ysical in teraction netw ork The Human Protein Reference Database is a database of ph ysical and functional in teractions betw een genes and proteins [34]. The HPRD net work was downloaded from the R pac k age DLBCL, version 1.3.7 [50]. T o allow for comparison of the K node function to BioNet, only the largest cluster of interacting genes w as used. The final HPRD netw ork contains 7,756 interactions b et ween 2,034 genes. HumanNet functional in teraction net work HumanNet is a functional netw ork that combines 21 sources of genomic and proteomic data from four sp ecies to build a human-specific biological netw ork [44]. These sources of data include gene co-citation, gene co-expression, curated physical and genetic in teractions, high-throughput ph ysical and genetic in- teractions, co-o ccurrence of protein domains and bacterial orthologs from C. ele gans , D. melano gaster , H. sapien and S. c er evisiae . V ersion 1 of the database w as used to create the biological net work used in Figure 7. Log lik eliho od scores w ere provided for eac h of the interactions. T o reduce the density of the net work, interactions with log likelihoo d scores less than 2 were remo ved from the netw ork. This net work contains 8,475 genes and 58,636 interactions. Log lik eliho o d scores LLS e w ere con verted in to edge distances b y calculating: d e = − log 10 LLS e LLS e max (14) Cancer cell line RNAi hits RNAi tec hnology can b e used to iden tify genes essen tial to the surviv al of cancer cell lines. Cheung et al. p erformed genome-wide RNAi screens of 102 cell lines across 6 cancer t yp es: o esophageal squa- mous cell carcinoma, glioblastoma (GBM), non-small-cell-lung cancer (NSCLC), pancreatic cancer, ov ar- ian cancer and colon cancer [42]. 11,194 genes were targeted. The w eight of evidence approac h was used to compute essentialit y scores for eac h shRNA for eac h set of cancer cell lines [42]. GENE-E ( http://www.broadinstitute.org/cancer/software/GENE-E/index.html ) w as used to collapse the shRNA-wise essentialit y scores into gene-wise p-v alues. P-v alues are pro duced by p erm uting the shRNA scores 10,000 times in order to create artificial genes. The second b est score of the shRNA within these artificial genes is then compared to the second best observ ed shRNA score. Gene-wise p-v alues s v w ere con verted into no de weigh ts p v b y calculating: p v = − log 10 s v (15) DLBCL gene expression and surviv al data Gene expression data for t wo subtypes of diffuse large B-cell lymphomas (DLBCL): germinal cen ter B-lik e phenot yp e (GCB, 112 tumors) and activ ated B-like phenot yp e (ABC, 82 tumours), was obtained from the R pack age DLBCL, version 1.3.7 [50]. This pack age also contains data on patient surviv al. The data originally comes from a study of patien t surviv al after chemotherap y [51]. P-v alues for differential expression and risk asso ciation were pro duced using Cox regression. These p-v alues were combined using second-order statistics in order to pro duce gene-wise asso ciation scores which could be applied to the net works. Gene-wise p-v alues were conv erted in to no de weigh ts using Equation 15. Gene On tology database The Gene On tology (GO) database consists of a hierarchical structure of gene annotations [1]. An- notations from this database w ere used in Figure 6. The GO database consists of 3 top-lev el ontolo- 12 gies: molecular functions, biological pro cesses and cellular comp onen ts, all of whic h w ere used in each figure. S. c er evisiae GO term annotations were retrieved from the Sac char omyc es Genome Database ( www.yeastgenome.org ) using the R pac k age org.Sc.sgd.db, version 2.10.1 [52]. Compactness score The compactness score C is defined as the mean shortest path distance b etw een pairs of no des in a set P on graph G [20]. C ( P ) = 2 P i,j ∈ P ; i 0 . 98), demonstrating that the results pro duced by SANT A are generally robust across distance metho ds. 22 T ables Supplemen tary T able 1. GO terms differentially associated with a net work of raw GIs and GI profile correlations. K net w as used to test the strength of asso ciation b et ween sets of genes asso ciated with v arious GO terms and the tw o netw ork types. This table contains the GO terms that asso ciated most strongly ( p < 1 × 10 − 8 ) with one or b oth of the netw orks. GO terms are ranked by their differen tial asso ciation strength ( D ), with the terms asso ciated more strongly with the netw ork of GI profile correlations p ositioned tow ards the top and the terms asso ciated more strongly with the net work of raw GIs p ositioned tow ards the b ottom. A greater num b er of GO term genes asso ciated more strongly with the net work of GI profile correlations. Supplemen tary T able 2. GO terms differen tially asso ciated with the un treated and MMS-treated GI net works. K net w as used to test the strength of asso ciation b et ween sets of genes asso ciated with v arious GO terms and the tw o netw ork types. The table contains the GO terms that asso ciated most strongly ( p < 0 . 001) with one or b oth of the netw orks. GO terms are ranked by their differen tial asso ciation strength ( D ), with the terms asso ciated more strongly with the treated netw ork p ositioned tow ards the top and the terms asso ciated more strongly with the untreated net work p ositioned tow ards the b ottom. Supplemen tary T able 3. GO terms differen tially asso ciated with the un treated and UV-treated GI net works. K net w as used to test the strength of asso ciation b et ween sets of genes asso ciated with v arious GO terms and the tw o netw ork types. The table contains the GO terms that asso ciated most strongly ( p < 0 . 001) with one or b oth of the netw orks. GO terms are ranked by their differen tial asso ciation strength ( D ), with the terms asso ciated more strongly with the treated netw ork p ositioned tow ards the top and the terms asso ciated more strongly with the untreated net work p ositions tow ards the b ottom.
Original Paper
Loading high-quality paper...
Comments & Academic Discussion
Loading comments...
Leave a Comment