Impact of the spatial context on human communication activity
Technology development produces terabytes of data generated by hu- man activity in space and time. This enormous amount of data often called big data becomes crucial for delivering new insights to decision makers. It contains behavioral information on different types of human activity influenced by many external factors such as geographic infor- mation and weather forecast. Early recognition and prediction of those human behaviors are of great importance in many societal applications like health-care, risk management and urban planning, etc. In this pa- per, we investigate relevant geographical areas based on their categories of human activities (i.e., working and shopping) which identified from ge- ographic information (i.e., Openstreetmap). We use spectral clustering followed by k-means clustering algorithm based on TF/IDF cosine simi- larity metric. We evaluate the quality of those observed clusters with the use of silhouette coefficients which are estimated based on the similari- ties of the mobile communication activity temporal patterns. The area clusters are further used to explain typical or exceptional communication activities. We demonstrate the study using a real dataset containing 1 million Call Detailed Records. This type of analysis and its application are important for analyzing the dependency of human behaviors from the external factors and hidden relationships and unknown correlations and other useful information that can support decision-making.
💡 Research Summary
The paper investigates how the spatial context of a city influences human communication activity, using a combination of geographic information from OpenStreetMap (OSM) and a large set of Call Detail Records (CDRs). First, the authors extract 31,514 points of interest (POIs) from OSM in the city of Trento, Italy, and classify them into eight high‑level activity categories: eating, shopping, health, entertainment, education, transportation, outdoor/sport, and working. Each POI is further broken down into 78,068 sub‑activities, and a spatial grid of 50 m × 50 m cells is built. For every cell, a TF‑IDF weighted activity vector is created, representing the relative importance of each activity category within that cell.
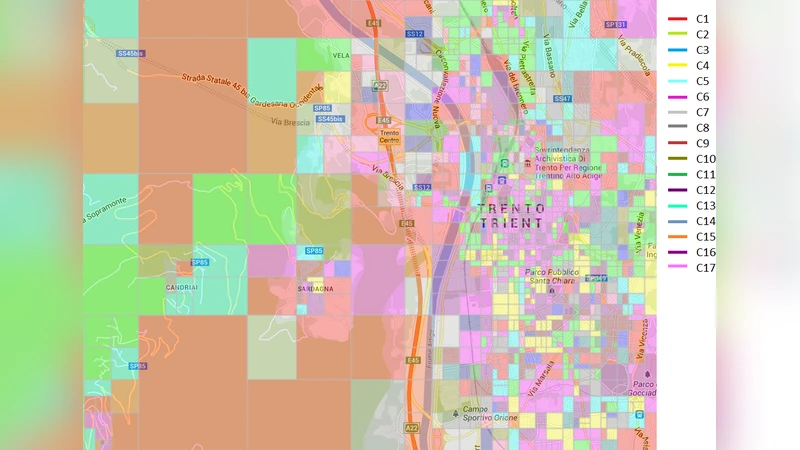
To discover meaningful area clusters, the authors compute cosine similarity between all cell vectors, construct a weighted adjacency matrix, and derive the normalized graph Laplacian. Using the eigengap heuristic, they automatically determine the optimal number of clusters (k) and then apply spectral clustering followed by k‑means on the first k eigenvectors. This yields 17 distinct clusters (C₁ … C₁₇), each characterized by a specific activity profile (e.g., central business districts, residential zones, transport hubs).
The second part of the methodology maps the CDR data onto these clusters. Since exact cell coverage is unavailable, the authors approximate the coverage area of each cellular tower with Voronoi polygons. For each polygon, they compute the proportion of overlap with the activity cells and allocate call counts accordingly, weighting by the overlap fraction. Temporal patterns of call volume are then extracted for each cluster. By excluding public holidays and special events, they calculate the mean (μ) and standard deviation (σ) of call volume for each time slot, defining a normal range as μ ± α·σ. Observations outside this range are labeled as “exceptional” communication patterns.
Cluster quality is assessed intrinsically using silhouette coefficients. Two similarity measures are employed: (1) cosine‑based distances between activity vectors, and (2) Euclidean distances between the temporal call‑volume series. The transport‑related cluster (C₁₁) achieves silhouette scores of 0.67 based on activity vectors and 0.77 when temporal patterns are considered, indicating a well‑separated and compact cluster. Other clusters display varying degrees of cohesion, with typical weekday patterns being fairly homogeneous across clusters, while weekend patterns show greater diversity.
Results reveal clear relationships between activity context and communication behavior. For instance, C₁₁ (transport/travel) exhibits higher call volumes on weekdays and lower on weekends, reflecting commuting patterns, whereas C₁ (outdoor/recreation) shows the opposite trend. Specific peaks, such as a 3 am surge on Saturdays in C₁₁, are interpreted as late‑night travel after Friday evenings. The authors also demonstrate that certain clusters (e.g., C₁₄) have recurring early‑morning peaks linked to transport and working activities.
The discussion acknowledges several limitations: (a) the approximation of cell coverage via Voronoi polygons may introduce spatial inaccuracies; (b) POI categorization relies on manual labeling and may be subjective; (c) CDRs capture only voice calls (no SMS, data usage), limiting the behavioral richness. Future work is suggested to integrate additional data sources such as GPS traces, social media posts, and transaction records, and to develop real‑time predictive models for smart‑city applications.
In conclusion, the study presents a novel framework that fuses open‑source geographic context with large‑scale telecommunication data to uncover how human activities shape communication patterns across space and time. The approach provides actionable insights for urban planners, transport authorities, and emergency responders, illustrating the potential of big‑data analytics for context‑aware decision support in modern cities.
Comments & Academic Discussion
Loading comments...
Leave a Comment