Patterns in Illinois Educational School Data
We examine Illinois educational data from standardized exams and analyze primary factors affecting the achievement of public school students. We focus on the simplest possible models: representation of data through visualizations and regressions on single variables. Exam scores are shown to depend on school type, location, and poverty concentration. For most schools in Illinois, student test scores decline linearly with poverty concentration. However Chicago must be treated separately. Selective schools in Chicago, as well as some traditional and charter schools, deviate from this pattern based on poverty. For any poverty level, Chicago schools perform better than those in the rest of Illinois. Selective programs for gifted students show high performance at each grade level, most notably at the high school level, when compared to other Illinois school types. The case of Chicago charter schools is more complex. In the last six years, their students’ scores overtook those of students in traditional Chicago high schools.
💡 Research Summary
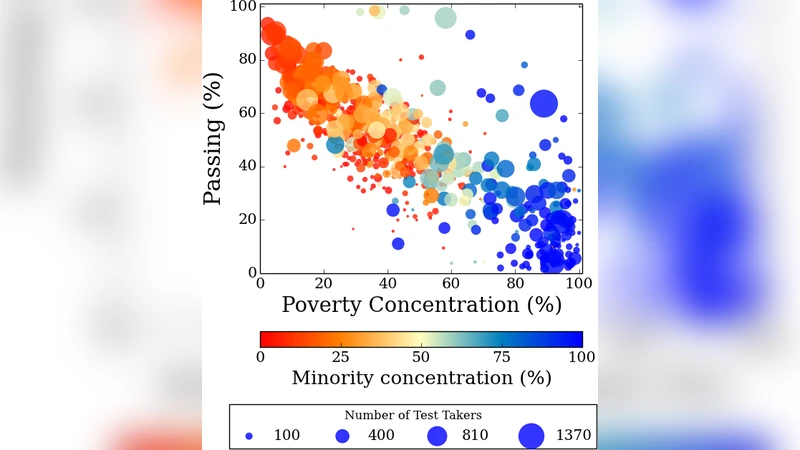
The paper investigates how standardized test performance in Illinois public schools relates to poverty concentration, school type, and geographic location, with a particular focus on Chicago. Using publicly available data from the Illinois State Board of Education, the authors plot the 2013 Mathematics PSAE passing rates of 670 high schools against the percentage of students eligible for free or reduced‑price lunch—a conventional proxy for school‑level poverty. In the scatter plots, point size encodes the number of test‑takers and color encodes the proportion of minority students, allowing a visual assessment of the intertwined effects of poverty and ethnicity.
When Chicago schools are excluded, the remaining Illinois schools display a remarkably tight linear relationship: as poverty concentration rises, the passing fraction falls in a near‑straight line (approximately a 0.6‑point drop in passing rate for each percent increase in poverty, with a standard deviation of about 5 %). This simple regression captures the bulk of the variation, and statistical tests confirm the relationship is highly significant (p < 0.001).
Chicago, however, does not follow this statewide trend. The city’s 115 high schools cluster at high poverty levels (most above 50 %) but exhibit a wide spread of passing rates—from below 20 % to above 80 %. By overlaying school‑type symbols, the authors show that the dispersion is linked to the diversity of educational programs in Chicago: traditional neighborhood schools, career/military academies, magnet schools, charter schools, and selective‑enrollment (gifted) programs.
Selective‑enrollment schools, which admit students based on prior test scores or entrance exams, consistently outperform all other Chicago schools, often achieving >90 % passing rates despite high poverty levels. Certain magnet schools (e.g., Van Steuben High, DeVry Advantage High) also exceed the state‑wide poverty‑performance line, while others (e.g., Crane Medical Prep) fall far below it, possibly due to reporting errors. Among charter schools, the Noble Street Charter System stands out with a 63.6 % passing rate at an 89 % poverty concentration, markedly higher than the state regression predicts.
The analysis is repeated for lower grades (3‑8) using the ISAT assessments. Again, schools outside Chicago follow a linear decline with poverty, and simple regression lines with comparable slopes and modest scatter are reported. Within Chicago, the same heterogeneity by school type persists.
A temporal dimension is added by tracking charter high‑school performance over six years. The data reveal that charter schools have gradually closed the gap with, and in recent years have surpassed, traditional Chicago high schools in PSAE passing rates. The authors attribute this trend to charter schools’ greater operational autonomy—longer school days, flexible staffing, and specialized curricula—though they acknowledge that causality cannot be definitively established from the aggregate data.
Methodologically, the study deliberately avoids multivariate regression models, arguing that the sheer volume of data points and the clarity of visual patterns make complex statistical techniques unnecessary for uncovering the main relationships. Nevertheless, the authors apply simple linear regression to quantify the observed trends and to demonstrate statistical significance.
Limitations are openly discussed. The analysis relies on school‑level aggregates, which mask individual‑student variation and omit important covariates such as teacher quality, per‑pupil spending, parental involvement, and community resources. The free/reduced‑lunch metric, while standard, does not capture all dimensions of socioeconomic disadvantage, and some low‑income families may be under‑represented if they do not apply for the program.
In conclusion, the paper confirms that across Illinois, poverty concentration is the dominant predictor of standardized test success, but Chicago’s unique mix of selective programs and a growing charter sector creates a distinct pattern where schools can achieve high performance even at elevated poverty levels. The authors advocate for the use of straightforward visual analytics as a tool for policymakers and the public to grasp educational disparities and to design targeted interventions that address the underlying socioeconomic drivers of achievement gaps.
Comments & Academic Discussion
Loading comments...
Leave a Comment