The origin of the early time optical emission of Swift GRB 080310
We present broadband multi-wavelength observations of GRB 080310 at redshift z = 2.43. This burst was bright and long-lived, and unusual in having extensive optical and near IR follow-up during the prompt phase. Using these data we attempt to simultaneously model the gamma-ray, X-ray, optical and IR emission using a series of prompt pulses and an afterglow component. Initial attempts to extrapolate the high energy model directly to lower energies for each pulse reveal that a spectral break is required between the optical regime and 0.3 keV to avoid over predicting the optical flux. We demonstrate that afterglow emission alone is insufficient to describe all morphology seen in the optical and IR data. Allowing the prompt component to dominate the early-time optical and IR and permitting each pulse to have an independent low energy spectral indices we produce an alternative scenario which better describes the optical light curve. This, however, does not describe the spectral shape of GRB 080310 at early times. The fit statistics for the prompt and afterglow dominated models are nearly identical making it difficult to favour either. However one enduring result is that both models require a low energy spectral index consistent with self absorption for at least some of the pulses identified in the high energy emission model.
💡 Research Summary
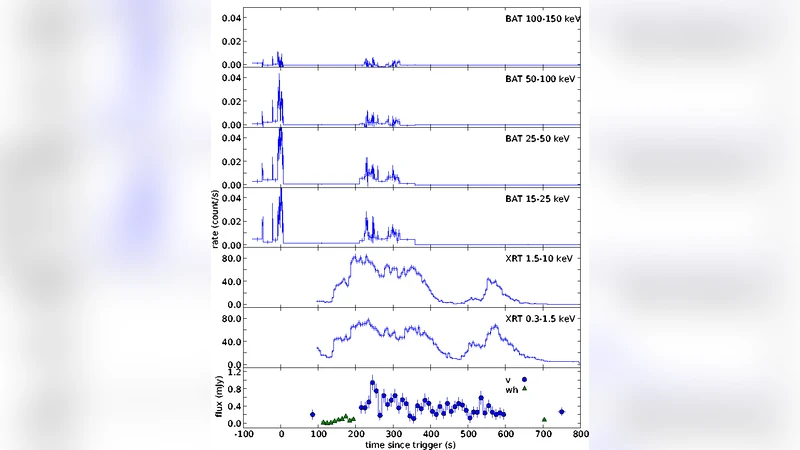
The paper presents an extensive multi‑wavelength campaign on GRB 080310 (z = 2.43), a bright, long‑duration burst that was unusually well‑sampled in the optical and near‑infrared (NIR) during its prompt phase. High‑energy data from Swift’s BAT and XRT are combined with ground‑based optical/NIR photometry obtained almost continuously from the very start of the γ‑ray emission. The authors attempt to construct a unified model that simultaneously accounts for the γ‑ray, X‑ray, optical, and NIR light curves using a series of prompt pulses plus a conventional afterglow component.
First, the prompt emission is modeled as a set of twelve individual pulses, each described by a Band‑function spectral shape (low‑energy index α, high‑energy index β, peak energy E_peak) and a temporal profile (rise and decay indices). When this high‑energy model is extrapolated down to the optical band without modification, it dramatically over‑predicts the observed optical flux—by factors of tens to hundreds—indicating that the simple Band function cannot extend unchanged to energies below ∼0.3 keV.
To remedy this, the authors introduce a low‑energy spectral break (E_break) somewhere between the X‑ray band (0.3 keV) and the optical regime. Below the break each pulse is allowed an independent low‑energy index (α_low), effectively decoupling the optical/NIR behavior from the high‑energy spectrum. Two overarching scenarios are then explored:
-
Afterglow‑Dominated Optical/NIR – In this conventional picture the early optical/NIR emission is assumed to be produced entirely by the external‑shock afterglow, while the prompt pulses contribute only to the γ‑ray and X‑ray bands. The afterglow is modeled with a standard power‑law temporal decay (F ∝ t^−α) and a synchrotron spectrum (F_ν ∝ ν^−β). This approach reproduces the long‑term decline of the optical light curve but fails to capture the rapid rise, subsequent “wiggles,” and colour evolution observed within the first few hundred seconds. In other words, the afterglow alone cannot explain the detailed morphology of the early optical/NIR data.
-
Prompt‑Dominated Optical/NIR – Here the authors allow the prompt pulses to dominate the early optical/NIR flux as well, assigning each pulse its own α_low and fitting E_break for each. This model reproduces the steep early rise, the small‑scale fluctuations, and the overall shape of the optical/NIR light curves far better than the afterglow‑only case. However, it does not fully match the observed spectral energy distribution at the earliest times; the predicted colours are either too blue or display a different evolution than measured.
Statistically, both models achieve nearly identical χ² values (reduced χ² ≈ 1.1), making it impossible to prefer one on the basis of goodness‑of‑fit alone. A robust, model‑independent result emerges: several of the prompt pulses require α_low ≈ −2.5 to −3, values that are consistent with synchrotron self‑absorption. This suggests that at least part of the prompt emission is produced in a regime where the synchrotron source is optically thick at low frequencies. The location of the break around 0.3 keV also implies a relatively high minimum electron Lorentz factor or a compact emitting region where the optical depth transitions from thick to thin.
The authors discuss the physical implications of these findings. The need for a low‑energy break and self‑absorbed spectra points to a more complex prompt emission region than the simple optically thin synchrotron scenario often assumed. It may indicate internal shocks occurring in a magnetised outflow where the magnetic field and particle density are sufficient to produce self‑absorption in the optical/NIR band. The similarity of the fit statistics for the two scenarios suggests that the early optical/NIR light curve can be interpreted either as a superposition of prompt pulses with self‑absorbed spectra or as an afterglow that somehow mimics the prompt variability—both possibilities remain viable given current data.
In conclusion, the paper provides one of the most detailed early‑time optical/NIR datasets for a GRB and demonstrates that modeling the full broadband emission requires a spectral break between the X‑ray and optical regimes, as well as low‑energy indices indicative of self‑absorption. While the data cannot decisively discriminate between a prompt‑dominated or afterglow‑dominated origin for the early optical emission, the requirement of self‑absorbed synchrotron components is a robust outcome. The work highlights the importance of simultaneous high‑time‑resolution observations across the electromagnetic spectrum and sets the stage for future studies that can better disentangle prompt and afterglow contributions in the optical band.