The Structure of NGC 1976 in the Radio Range
High angular resolution radio continuum images of NGC 1976 (M42, Orion A) at frequency=330 MHz (wavelength=91 cm), 1.5 GHz (20 cm) and 10.6 GHz (2.8 cm), have been aligned, placed on a common grid, smoothed to common resolutions of 80" (=0.16 pc at 420 pc) and 90" (=0.18 pc) and compared on a position-by-position basis. The results are not consistent with a single value of Te. Rather, there is a significant variation, from Te =6000K in the low intensity, extended region to Te=8500K in the higher intensity, more compact region. The best fit to the data is a multi-layer model obtained from radio recombination line (RRL) data. An estimate of temperature fluctuations from the model yields t2=0.003. This is a factor of 10 lower than fluctuation values from optical O++ line data.
💡 Research Summary
The paper presents a detailed investigation of the electron temperature structure of the Orion Nebula (NGC 1976) using high‑resolution radio continuum images at three frequencies: 330 MHz (λ = 91 cm), 1.5 GHz (λ = 20 cm), and 10.6 GHz (λ = 2.8 cm). The authors first align the three data sets, place them on a common grid, and smooth them to common angular resolutions of 80″ (≈0.16 pc) and 90″ (≈0.18 pc) at the assumed distance of 420 pc. By plotting the brightness of each pixel at one frequency against the brightness at another frequency (the “intensity‑intensity” method), they directly test the hypothesis of a single, isothermal electron temperature (Te) across the nebula.
The intensity‑intensity diagrams reveal that a single Te cannot reproduce the data. Low‑intensity, extended emission is consistent with Te ≈ 6000 K, whereas high‑intensity, compact regions require Te ≈ 8500 K. This temperature gradient is incompatible with simple isothermal models but matches expectations from multi‑layer radiative‑transfer models that have been built on radio recombination line (RRL) observations.
To interpret the continuum data, the authors revisit the classic RRL‑based models of Lockman & Brown (1975), Shaver (1980), and especially the Wilson & Jaeger (1987) (WJ) model, which employs a face‑on slab geometry composed of several layers with different electron densities (Ne) and temperatures. The original WJ model consisted of five layers; for better agreement with the new continuum data it was expanded to nine layers, with the outer three layers’ temperatures reduced by 8 % relative to the original values. This “improved WJ” model reproduces the observed 330 MHz–1.5 GHz intensity‑intensity relation and also matches the 1.5 GHz–10.6 GHz comparison, where the differences between models become modest because the optical depth at frequencies above ~1.5 GHz is low (τ < 0.1).
The paper also discusses three standard methods for deriving Te from radio data: (1) solving the Rayleigh‑Jeans brightness equation in the optically thick limit (τ ≫ 1), (2) fitting the integrated flux density spectrum over a wide frequency range, and (3) the intensity‑intensity method pioneered by Dicker et al. (2009). The authors adopt method (3) because it does not require assumptions about geometry or optical depth, though they deliberately avoid introducing a DC offset or calibration scaling, which distinguishes their approach from Dicker et al.
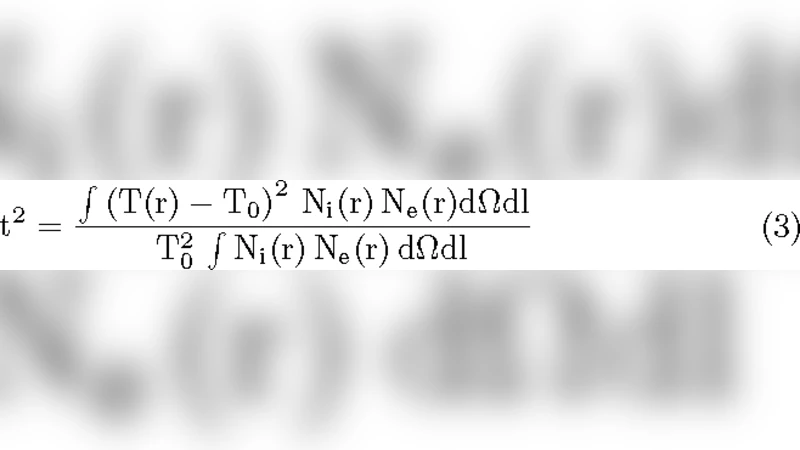
Using the improved multi‑layer model, the authors compute the temperature fluctuation parameter t² defined by Peimbert (1967). For a small angular scale comparable to the 80″–90″ resolution, they obtain T₀ ≈ 8250 K and t² ≈ 3 × 10⁻³; when integrating over the whole nebula, T₀ ≈ 7600 K and t² ≈ 10⁻². These values are an order of magnitude smaller than those derived from optical collisionally excited
Comments & Academic Discussion
Loading comments...
Leave a Comment