Automated analysis of Fermi-LAT data to trigger ground-based gamma-ray observations
The Fermi Gamma-ray Space Telescope regularly surveys the entire sky in the energy range between 0.3 and 100 GeV with an homogeneous coverage. This makes Fermi a very useful guide for ground-based Cherenkov-telescope arrays like VERITAS, that are sensitive at energies above 100 GeV. The VERITAS collaboration uses information from Fermi-LAT to select potential targets and identify flaring objects in the GeV band. We describe three different analysis pipelines that automatically process and analyze Fermi-LAT data on a daily basis to look for flaring objects: daily light curves of selected targets, an all-sky analysis to identify new flaring sources, and an algorithm that looks for clusters of high-energy photons in time and arrival direction.
💡 Research Summary
The paper presents three automated analysis pipelines developed by the VERITAS collaboration to exploit the all‑sky monitoring capability of the Fermi Large Area Telescope (LAT) for rapid triggering of ground‑based very‑high‑energy (VHE) observations. The LAT surveys the entire sky every three hours in the 0.3–100 GeV band, providing homogeneous coverage that can serve as an early warning system for Cherenkov telescopes such as VERITAS, which operate above ∼100 GeV. Traditional Fermi alerts (Astronomer’s Telegrams, blogs, public light curves) are released 1–3 days after a flare, often missing the peak of the activity. To reduce this latency, VERITAS has implemented three complementary, fully automated pipelines that run daily on the latest LAT data using the Fermi Science Tools v9r18.
-
Blazar Light‑Curve Pipeline – A predefined list of blazars is monitored. For each source, a time‑averaged spectral fit is performed over 20 MeV up to the highest photon energy associated with the source. Photons within 15° of the target are selected, and a source model based on the 1FGL catalog includes all neighbors out to 20°. Parameters for sources beyond 10° are fixed after an initial fit; those within 15° remain free. If the photon file exceeds 50 MB, a binned likelihood analysis replaces the unbinned approach to keep memory usage manageable. The resulting best‑fit model yields daily and weekly integral fluxes above 300 MeV and 1 GeV. The spectral index is held fixed to the time‑averaged value, and only the flux is refit for each short interval. Points with TS < 0.1 are set to zero; sources with TS < 4 are iteratively removed to avoid convergence problems. Flare significance is quantified by (S = (\phi_i - \phi_{\rm avg}) / \sqrt{\sigma_i^2 + \sigma_{\rm avg}^2}), allowing rapid identification of >2σ or >3σ excursions.
-
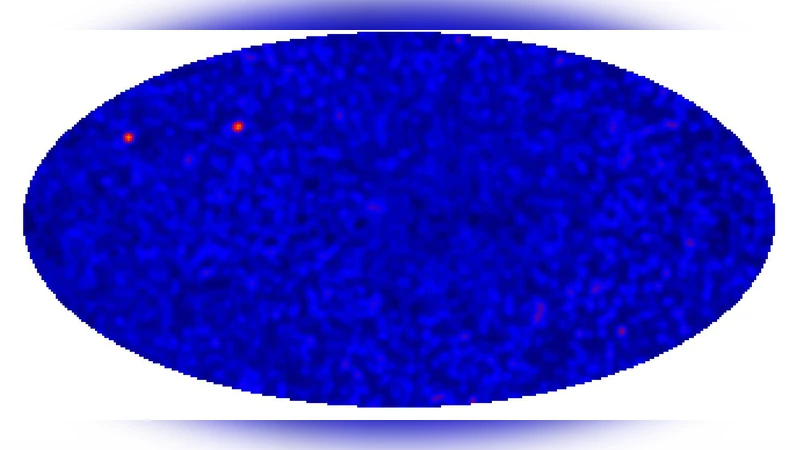
All‑Sky Variability Pipeline – This method builds a static 21‑month exposure‑corrected sky map (1°×1° bins) using all photons with E > 1 GeV. Every day a new map is generated from the most recent three days of data. A variability parameter (V = (\phi_{3d} - \phi_{21m}) / \phi_{21m}) is computed per pixel. High‑V pixels indicate localized excesses relative to the long‑term average and are flagged as candidate flares. The pipeline also produces 1‑day, 7‑day, and 30‑day integration maps to capture a range of variability timescales. For each hotspot, a dedicated likelihood analysis yields a refined spectrum and a 10‑day light curve above 1 GeV, which can be extrapolated to TeV energies to assess VERITAS detectability.
-
High‑Energy Photon Cluster Pipeline – Focused on rapid, high‑energy variability, this analysis selects photons with E > 3 GeV and retains only those within the 95 % containment radius of a known source (energy‑dependent PSF for front‑ and back‑converting events). The filtered photons are plotted as a function of arrival time and energy over the previous 15 days. When multiple photons arrive within a short window (typically ≤2 days), an automated alert is sent to VERITAS observers, prompting immediate follow‑up. This approach is especially effective for sources that exhibit brief, intense flares such as flat‑spectrum radio quasars.
All three pipelines are orchestrated by Python scripts wrapped in Perl, enabling fully unattended daily execution. The system downloads the latest LAT data, performs the analyses, and disseminates results via web dashboards and email alerts. By reducing the latency between a GeV flare detection and a VERITAS observation from days to a few hours, the framework maximizes the probability of simultaneous GeV–TeV detection, thereby enhancing the scientific return of multi‑wavelength campaigns. The authors note that the methodology is readily adaptable to other ground‑based γ‑ray facilities, offering a general solution for rapid response to transient high‑energy phenomena.
Comments & Academic Discussion
Loading comments...
Leave a Comment