In-Orbit Performance of MAXI Gas Slit Camera (GSC) on ISS
We report the in-orbit performance of the Gas Slit Camera (GSC) on the MAXI (Monitor of All-sky X-ray Image) mission carried on the International Space Station (ISS). Its commissioning operation started on August 8, 2009, confirmed the basic performances of the effective area in the energy band of 2–30 keV, the spatial resolution of the slit-and-slat collimator and detector with 1.5 degree FWHM, the source visibility of 40-150 seconds for each scan cycle, and the sky coverage of 85% per 92-minute orbital period and 95% per day. The gas gains and read-out amplifier gains have been stable within 1%. The background rate is consistent with the past X-ray experiments operated at the similar low-earth orbit if its relation with the geomagnetic cutoff rigidity is extrapolated to the high latitude. We also present the status of the in-orbit operation and the calibration of the effective area and the energy response matrix using Crab-nebula data.
💡 Research Summary
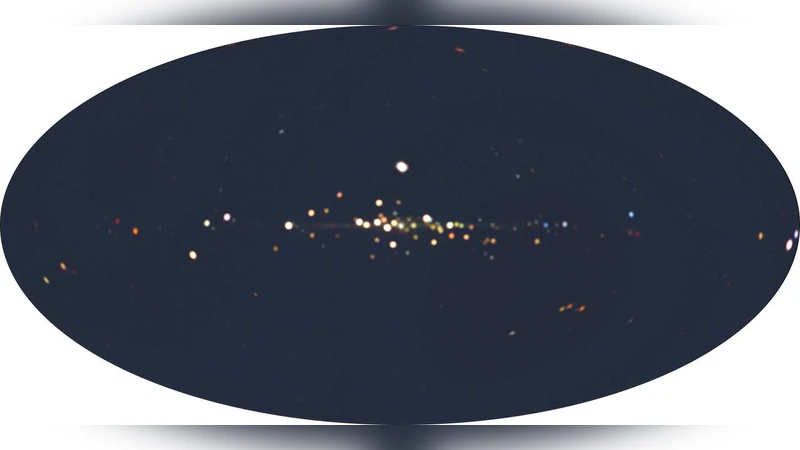
The paper presents a comprehensive assessment of the in‑orbit performance of the Gas Slit Camera (GSC) aboard the MAXI mission on the International Space Station. The GSC consists of twelve xenon‑filled proportional counters (total detection area ≈ 5350 cm²) coupled with a slit‑and‑slat collimator that provides a 1.5° (FWHM) angular resolution over a 160° field of view. Commissioning began on 8 August 2009; after the high‑voltage ramp‑up to the nominal 1650 V, basic functions were verified and the first all‑sky image was obtained on 15 August.
A dedicated Radiation‑Belt Monitor (RBM) comprising two 0.2 mm Si‑PIN detectors monitors the cosmic‑ray flux in the horizontal (RBM‑H) and zenith (RBM‑Z) directions. The RBM count rates show a clear anti‑correlation with the geomagnetic cutoff rigidity (COR), confirming that the dominant background component is energetic cosmic rays. At high latitudes the RBM‑H rate exceeds RBM‑Z by up to an order of magnitude, reflecting the anisotropic distribution of trapped particles that circulate horizontally around the magnetic poles.
Background characterization uses the on‑board lower‑discriminator (LD) hit rate and the anti‑coincidence filter. The LD‑hit rate tracks the RBM rate, and after anti‑coincidence filtering the residual event rate is roughly 1/30 of the LD‑hit rate, comparable to the Ginga‑LAC performance. Spectra sorted by COR reveal prominent Ti‑K (4.6 keV) and Cu‑K (8.1 keV) fluorescence lines from the detector housing and collimator; these lines serve as in‑flight energy calibrators. For COR > 8 GV the continuum above 8 keV is dominated by high‑energy cosmic particles, while for COR < 2 GV the cosmic X‑ray background (CXB) dominates below 5 keV. The background level is ≈ 2 mCrab at 4 keV and ≈ 10 mCrab at 10 keV, comparable to Ginga‑LAC and slightly higher than RXTE‑PCA.
Spatially, the background shows a dip at the centre of each anode wire due to the support structure of the beryllium window. After subtracting the modeled CXB contribution the residual background is flat with a modest increase toward the wire ends, where anti‑coincidence efficiency declines.
During the early mission several high‑voltage incidents occurred: GSC 6, GSC 9, GSC A, GSC B, and later GSC 3 suffered carbon‑wire fractures, leading to sudden voltage drops. To mitigate further damage, the operating voltage was limited to ≤ 1550 V for affected units, and an automatic Radiation‑Zone (RZ) map was employed to shut down the counters when the ISS traversed high‑radiation regions (initially only the South Atlantic Anomaly, later extended to latitudes > 40°). Consequently the overall observation efficiency dropped to ~40 % of the design value, but the remaining detectors continued to provide reliable data.
Energy calibration relies on an internal 55Fe source (5.9 keV) mounted on each counter and on the Ti‑K and Cu‑K fluorescence lines observed in the background. The gas gain has remained stable within 1 % over the first year, and the energy resolution at 5.9 keV stays at ~18 % (FWHM). The PHA‑to‑PI conversion factors across the entire anode length vary by less than 1 % annually, enabling precise spectral analysis. Position reconstruction uses the ratio of pulse heights from the two ends of each carbon‑anode wire; ground‑based calibration data confirm that the 1‑D position response is stable in orbit.
Finally, observations of the Crab Nebula were used to refine the effective area and generate the instrument response matrix (RMF and ARF). The calibrated response reproduces the Crab spectrum within the expected systematic uncertainties and is now incorporated into the MAXI data processing pipeline.
In summary, the GSC has achieved its design goals: an effective area consistent with the 2–30 keV band specifications, a 1.5° spatial resolution, source visibility of 40–150 s per scan, sky coverage of 85 % per 92‑minute orbit (95 % per day), and stable detector gains. Background behavior aligns with expectations based on COR, and the in‑flight calibration using internal sources and Crab observations ensures reliable spectral and timing measurements for the MAXI all‑sky monitoring program.
Comments & Academic Discussion
Loading comments...
Leave a Comment