Statistical Estimation and Clustering of Group-invariant Orientation Parameters
We treat the problem of estimation of orientation parameters whose values are invariant to transformations from a spherical symmetry group. Previous work has shown that any such group-invariant distribution must satisfy a restricted finite mixture re…
Authors: Yu-Hui Chen, Dennis Wei, Gregory Newstadt
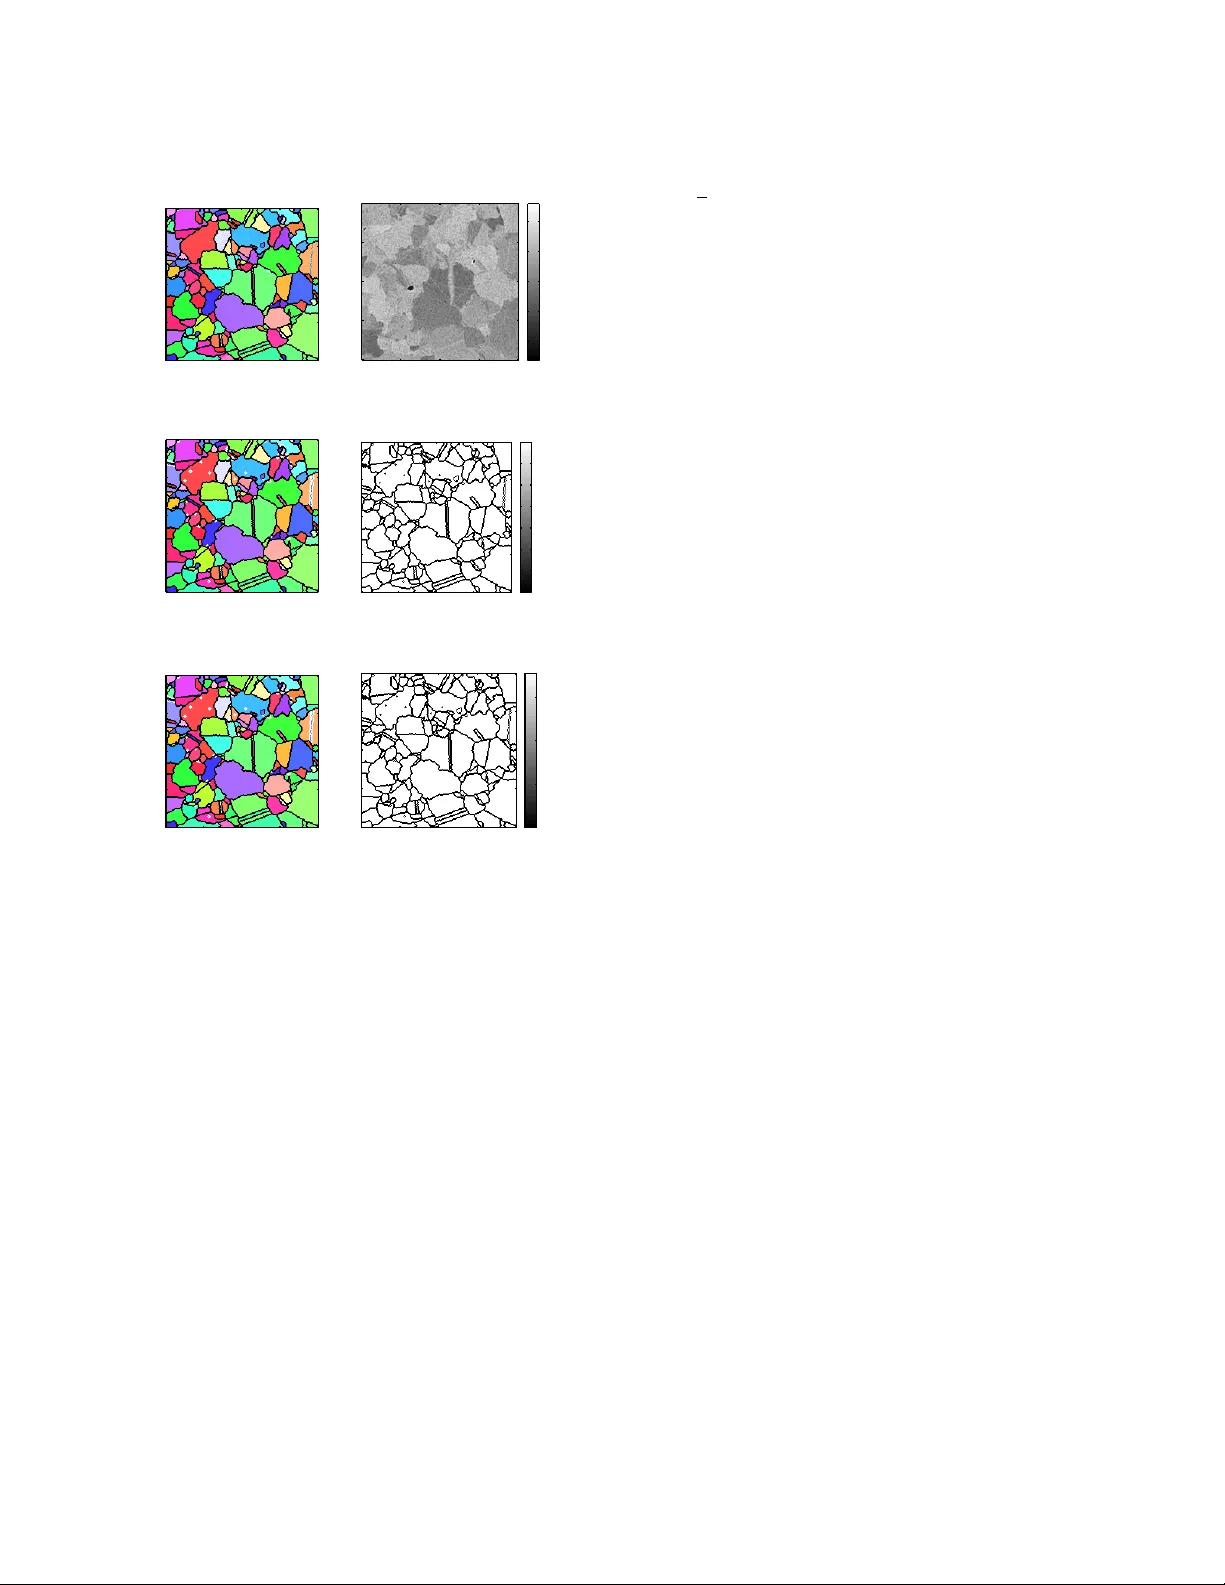
Statistical Estimation and Clustering of Group-in v ariant Orientation P arameters Y u-Hui Chen ∗ , Dennis W ei † , Gregory Ne wstadt ‡ , Marc DeGraef § , Jef frey Simmons ¶ and Alfred Hero ∗ ∗ Univ ersity of Michigan, Ann Arbor, MI USA † IBM Research, Thomas J. W atson Research Center, Y orktown Heights, NY USA ‡ Google Inc., Pittsb urgh, P A USA § Carnegie Mellon University Pittsb urgh, P A USA ¶ US Air F orce Research Laboratory (AFRL), Dayton, OH USA Abstract —W e treat the problem of estimation of orientation parameters whose values are invariant to transformations fr om a spherical symmetry group. Pr evious w ork has shown that any such group-in variant distrib ution must satisfy a restricted finite mixture repr esentation, which allows the orientation pa- rameter to be estimated using an Expectation Maximization (EM) maximum likelihood (ML) estimation algorithm. In this paper , we introduce two parametric models for this spherical symmetry group estimation pr oblem: 1) the hyperbolic V on Mises Fisher (VMF) mixture distribution and 2) the W atson mixture distribution. W e also intr oduce a new EM-ML algorithm for clustering samples that come from mixtur es of group-in variant distributions with differ ent parameters. W e apply the models to the problem of mean crystal orientation estimation under the spherically symmetric group associated with the crystal form, e.g., cubic or octahedral or hexahedral. Simulations and experiments establish the advantages of the extended EM-VMF and EM- W atson estimators f or data acquir ed by Electron Backscatter Diffraction (EBSD) micr oscopy of a polycrystalline Nickel alloy sample. I . I N T R O D U C T I O N This paper considers estimation of parameters of distribu- tions whose domain is a particular non-Euclidean geometry: a topological space divided into M equiv alence classes by actions of a finite spherical symmetry group. A well kno wn example of a finite spherical symmetry group is the point group in 3 dimensions describing the soccer ball, or football, with truncated icosahedral symmetry that also corresponds to the symmetry of the Carbon-60 molecule. This paper formulates a general approach to parameter estimation in distributions defined over such domains. W e use a restricted finite mixture representation introduced in [1] for probability distributions that are in variant to actions of any topological group. This representation has the property that the number of mixture components is equal to the order of the group, the distributions in the mixture are all parameterized by the same parameters, and the mixture coefficients are all equal. This is practically significant since many reliable algorithms hav e been dev eloped for parameter estimation when samples come from finite mixture distributions [2], [3]. W e apply the representation to an important problem in materials science: analysis of mean orientation in polycrys- tals. Crystal orientation characterizes properties of materials including electrical conductivity and thermal conductivity . Polycrystalline materials are composed of grains of varying size and orientation, where each grain contains crystal forms with similar orientations. The quality of the material is mainly determined by the grain structure i.e. the arrangement of the grains, their orientations, as well as the distribution of the precipitates. Thus accurate estimation of crystal orientation of the grains is useful for predicting ho w materials fail and what modes of f ailure are more likely to occur [4]. The mean orientation of the grain, characterized for e xample by its Euler angles, can only be specified modulo a set of angular rotations determined by the symmetry group associ- ated with the specific type of crystal, e.g. he xagonal, cubic. This multiplicity of equiv alent Euler angles complicates the dev elopment of reliable mean orientation estimators. The prob- lem becomes ev en harder when the orientations are sampled from a region encompassing more than one grain such that the orientations cluster o ver dif ferent mean directions. In such a case, we would like to identify whether the orientations are multi-modally distributed and also estimate the mean direction for each cluster . In our pre vious work [1], we introduced the finite mixture of V on Mises-Fisher (VMF) distrib ution for observations that are in variant to actions of a spherical symmetry group. W e applied the expectation maximization (EM) maximum likelihood (ML) algorithm, called EM-VMF , to estimate the group-in variant parameters of this distribution. In this paper, we develop a hyperbolic representation simplification of the EM-VMF algorithm that reduces the computation time by a factor of 2 . W e also introduce a ne w group in variant distribution for spherical symmetry groups, called the G -in variant W atson distribution, which like VMF is a density parameterized by location (angle mean) and scale (angle concentration) over the p -dimensional sphere. An EM algorithm is presented for estimation of the parameters, called the EM-W atson algorithm. Furthermore, mixture-of- G -inv ariant W atson (mGIW) and von Mises-Fisher (mGIV) distrib utions are introduced to perform clustering on the G -in variant sphere. An EM algorithm is presented for estimation of the parameters of the mGIW and mGIV distributions. W e illustrate how the Generalized Likelihood Ratio T est (GLR T) can be used to detect the presence of multiple modes in a sample and how it can be combined with the EM algorithm for mGIW and mGIV distributions to cluster multiple orientations on the sphere. The performance of the proposed EM orientation estimators is e valuated by simulation and compared to other estimators. The EM orientation estimators are then illustrated on Electron Backscatter Diffraction EBSD data collected from a Nickel alloy whose crystal form induces the m 3 m [5] cubic point symmetry group. W e establish that the EM orientation esti- mators result in significantly improv ed estimates of the mean direction in addition to providing an accurate estimate of concentration about the mean. Furthermore, with the extended mixture models, we are able to identify and cluster multi- modally distributed samples more accurately than the K-means algorithm. The paper is organized as follows. Section II describes group inv ariant random variables and gi ves the mixture repre- sentation for their densities. Section III specializes to random variables inv ariant relativ e to actions of the spherical symmetry group and develops the G -in variant VMF and W atson distrib u- tions along with EM-ML parameter estimator . The clustering methods based on the G -in v ariant distributions along with the GLR T are elaborated in Section IV. The crystallography application and data simulation are presented in Section V and the experiment results are shown in Section VI. Section VII has concluding remarks. I I . G R O U P - I N V A R I A N T R A N D O M V A R I A B L E S Consider a finite topological group G = { G 1 , . . . , G M } of M distinct actions on a topological space X , G i : X → X and a binary operation ”*” defining the action composition G i ∗ G j , denoted G i G j . G has the properties that composition of multiple actions is associati ve, for every action there exists an inv erse action, and there exists an identity action [6]. A real valued function f ( x ) on X is said to be inv ariant under G if: f ( G x ) = f ( x ) for G ∈ G . Let X be a random variable defined on X . W e hav e the follo wing theorem for the probability density f ( x ) of X . Theor em 2.1: The density function f : X → R is in variant under G if and only if ∃ h : X → R s.t. f ( x ) = 1 M M X i =1 h ( G i x ) . (1) This theorem is a slight generalization of [1, Thm. 2.1] in that the density h ( . ) is not necessarily the same as f ( . ) . The proof is analogous to that of [1, Thm. 2.1]. Theorem 2.1 says that any density f ( x ) that is in variant under group G can be represented as a finite mixture of a function and its translates h ( G i x ) under the group’ s actions G i ∈ G . As pointed out in [1], Thm. 2.1 has important implications on G -in variant density estimation and parameter estimation. In particular it can be used to construct maximum likelihood estimators for parametric densities. Let h ( x ; θ ) be a density on X that is parameterized by a parameter θ in a parameter space Θ . W e extend h ( x ; θ ) to a G -in variant density f by using Thm. 2.1, obtaining: f ( x ; θ ) = 1 M M X i =1 h i ( x ; θ ) , (2) where h i ( x ; θ ) = h ( G i x ; θ ) . This density is of the form of a finite mixture of densities h i ( x ; θ ) of kno wn parametric form where the mixture coef ficients are all identical and equal to 1 / M . Maximum likelihood (ML) estimation of the parameter θ from an i.i.d. sample { x i } n i =1 from any G -in variant density f can now be performed using finite mixture model methods [7] such as the Expectation-Maximization (EM) algorithm [2] or the restricted Boltzman machine (RBM) [3]. I I I . M L W I T H I N A S P H E R I C A L S Y M M E T RY G RO U P As in [1] we specialize Thm. 2.1 to estimation of parameters for the case that the probability density is on a sphere and is in variant to actions in a spherical symmetry group. In Section V this will be applied to a crystallography example under spherical distribution likelihood models for the mean crystal orientation. In general, the measured and mean ori- entations can be represented by Euler angles [8], Rodrigues V ectors [9], or Quaternions [10]. As in [1], we use the quaternion representation to enable orientations to be modeled by spherical distrib utions since the quaternion representation is a 4 D vector on the 3 -sphere S 3 , i.e. q = ( q 1 , q 2 , q 3 , q 4 ) such that k q k = 1 . Any of the aforementioned orientation representations ha ve inherent ambiguity due to crystal symmetries. For example, if the crystal has cubic symmetry , its orientation is only uniquely defined up to a 24-fold set of proper rotations of the cube about its symmetry axes. These actions form a point sym- metry group, called 432 , a sub-group of m 3 m . In quaternion space, since each orientation corresponds to two quaternions with different sign { q , − q } , these rotations reflections, and in versions can be represented as a spherical symmetry group G of quaternionic matrices { P 1 , . . . , P M } , with sign symmetry such that P i = − P i − M / 2 ∀ M / 2 < i ≤ M , where M = 48 for cubic symmetry . Based on the symmetry group G , we can define the distance between two quaternions under G as: d G ( q 1 , q 2 ) = min P ∈G arccos ( q T 1 Pq 2 ) (3) T wo quaternions q 1 , q 2 are called symmetry-equiv alent to each other if they are mapped to an equiv alent orientation under G , i.e. d G ( q 1 , q 2 ) = 0 . A fundamental zone (FZ), also called the fundamental domain, is a conic solid subset of the sphere that can be specified to disambiguate an y particular orientation x . Howe ver , as will be seen in Sec. V, reduction of the entire data sample { x i } n i =1 to a FZ destroys information necessary for maximum likelihood estimation: the entire G - in variant density (2) must be used. In the following two subsections, we introduce two G -in variant spherical distribu- tions: v on Mises-Fisher and W atson distributions [11] to model orientations in quaternion space. A. Hyperbolic G -in variant von Mises-F isher Distrib ution First we revie w the G -inv ariant v on Mises-Fisher distribu- tion presented in [1]. The v on Mises-Fisher (VMF) distribution arises in directional statistics [11] as an analogue of the multiv ariate Gaussian distrib ution on the ( p − 1) -dimensional sphere S ( p − 1) ⊂ R p , where p ≥ 2 . The VMF distribution is parameterized by the mean direction µ ∈ S ( p − 1) and the concentration parameter κ ≥ 0 : φ ( x ; µ , κ ) = c p ( κ ) exp ( κ µ T x ) , (4) where c p ( κ ) = κ p/ 2 − 1 (2 π ) p/ 2 I p/ 2 − 1 ( κ ) and I p ( · ) is the modified Bessel function of the first kind of order p . Given an i.i.d. sample { x i } n i =1 from the VMF distribution, the ML estimator has the closed-form expressions [11] ˆ µ = γ k γ k , ˆ κ = A − 1 p k γ k n , (5) where γ = P n i =1 x i and A p ( u ) = I p/ 2 ( u ) I p/ 2 − 1 ( u ) . Let G be a group of symmetric actions { P 1 , . . . , P M } acting on the quaternionic representation of orientation on the 3 -dimensional sphere S 3 . W e e xtend the VMF distribution (4) using the mixture representation in Thm 2.1: f v ( x ; µ , κ ) = 1 M M X m =1 φ ( P m x ; µ , κ ) (6) = 1 M M X m =1 φ ( x ; P m µ , κ ) (7) where in going from (6) to (7) we used the inner product form µ T x in (4) and the symmetry of P m . The e xpression (7) for the e xtended VMF distribution is in the form of a finite mixture of standard VMF distributions on the same random variable x having different mean parameters µ m = P m µ b ut ha ving the same concentration parameter κ . The finite mixture (7) for the G -in variant density f v ( x ; µ , κ ) is in a form for which an EM algorithm [2] can be imple- mented to compute the ML estimates of µ and κ . Denot- ing the parameter pair as ω = { µ , κ } , the EM algorithm generates a sequence { ω ( k ) } of estimates that monotonically increase the likelihood. These estimates are gi ven by ω ( k +1) = arg max ω E S | X , ω ( k ) [log L ( ω ; { x i , s i } )] , where s i is a latent variable assigning x i to a particular mixture component in (7) and L ( ω ; { x i , s i } ) is the likelihood function of ω given the complete data { x i , s i } n i =1 . Specifically , E S | X , ω [log L ( ω ; { x i , s i } )] (8) = n X i =1 M X m =1 r i,m (log c p ( κ ) + κ ( P m µ ) T x i ) , where r i,m = P ( s i = m | x i , ω ) . The EM algorithm takes the form: E-step: r i,m = φ ( x i ; P m µ , κ ) P M l =1 φ ( x i ; P l µ , κ ) , m ∈ { 1 , 2 , . . . , M } . (9) M-step: ˆ µ = γ k γ k , ˆ κ = A − 1 p k γ k n , (10) γ = n X i =1 M X m =1 r i,m P T m x i . (11) The hyberbolic G -inv ariant von Mises-Fisher distribution is obtained by exploiting the sign symmetry in G . In particular , (11) in the M-step can be re-written as: γ = n X i =1 M X m =1 r i,m P T m x i = n X i =1 M / 2 X m =1 r i,m P T m x i − r i, M 2 + m P T m x i = n X i =1 M / 2 X m =1 sinh ( κ ( P m µ ) T x i ) P M / 2 l =1 cosh ( κ ( P l µ ) T x i ) P T m x i , (12) where sinh , cosh are the hyperbolic sinusoidal functions. Equation (9) in E-step is simplified as: r 0 i,m = sinh ( κ ( P m µ ) T x i ) P M / 2 l =1 cosh ( κ ( P l µ ) T x i ) , m ∈ 1 , 2 , . . . , M 2 . (13) In Section VI we demonstrate the computational impro ve- ment of the hyperbolic form of the EM algorithm obtained by substituting (12), (13) into (10), (9) respecti vely . B. G -in variant W atson Distrib ution As described at the beginning of this section, each orienta- tion corresponds to two quaternions with different sign, which is equiv alent to an axis of the sphere. For axial data it is more natural to use the W atson distribution [12], which models the probability distribution of axially symmetric vectors on the ( p − 1) -dimensional unit sphere, i.e. ± x ∈ S p − 1 are equi valent. Similar to VMF , the distribution is parametrized by a mean direction ± µ ∈ S p − 1 , and a concentration parameter κ ∈ R that is no longer necessarily non-negati ve. Its probability density function is W p ( x ; µ , κ ) = 1 M ( 1 2 , p 2 , κ ) exp κ ( µ T x ) 2 , (14) where M is the Kummer confluent hypergeometric function defined in [13]. According to (14), the positiv e-negativ e pair of group actions { P m , − P m } contribute the same value in the density function. The set of the group action pairs G 0 = {{ P m , − P m }} M / 2 m =1 is the quotient group G / I , where I = { I p , − I p } ⊂ G and I p is the identity matrix of dimension p . Therefore, G 0 is also a group and we can use Thm 2.1 to extend the W atson distribution to the mixture representation under G 0 : f w ( x ; µ , κ ) = 1 M 0 M 0 X m =1 W p ( x ; P m µ , κ ) , (15) where M 0 = M / 2 . The ML estimates of µ and κ can also be calculated by the EM algorithm. The E-step for the W atson mixture distribution is r i,m = exp { κ (( P m µ ) T x i ) 2 } P M 0 l =1 exp { κ (( P l µ ) T x i ) 2 } , m ∈ { 1 , 2 , ..., M 0 } . (16) For the M-step, we take a similar approach as [11] as follows: E S | X , ω [log L ( ω ; { x i , s i } )] = n κ µ T ˜ T µ − log M 0 M 1 2 , p 2 , κ , (17) where ˜ T = 1 n P n i =1 P M 0 m =1 r i,m ( P T m x i x T i P m ) is the scatter matrix of x 1 , ..., x n . Let ˜ t 1 , ..., ˜ t p be the eigen values of ˜ T with ˜ t 1 ≥ ... ≥ ˜ t p , (18) and let ± t 1 , ..., ± t p be the corresponding unit eigen vectors. Since we want to find µ which maximizes (17) such that µ T µ = 1 , the estimator of µ for fixed κ has the following form: ˆ µ = t 1 , ˆ κ > 0 , ˆ µ = t p , ˆ κ < 0 . (19) Similarly by fixing µ and setting to zero the deriv ative of (17) with respect to κ , we ha ve: Y p ( κ ) = M 0 ( 1 2 , p 2 , κ ) M ( 1 2 , p 2 , κ ) = P n i =1 P M 0 m =1 r i,m ( µ T P T m x i ) 2 n ⇒ ˆ κ = Y − 1 p P n i =1 P M 0 m =1 r i,m ( µ T P T m x i ) 2 n ! , (20) The final estimates of µ and κ are obtained by checking both cases ( ˆ κ > 0 , ˆ κ < 0 ) and choosing the one which is consistent for (19)(20). I V . C L U S T E R I N G W I T H A S P H E R I C A L S Y M M E T RY G RO U P In this section we extend the parameter estimation problem to the situation where there are multiple group-inv ariant distri- butions with different parameters that gov ern the samples. This problem arises, for example, in poly-crystaline materials when estimating the mean crystal orientation over a region contain- ing more than one grain (perhaps undetected). This problem can be solved by first applying some standard clustering meth- ods, e.g. K-means [14], and then estimating the parameters for each cluster . Howe ver , clustering methods based on the distance relation between the samples are complicated by the presence of spherical symmetry because it is necessary to dis- tinguish modes that are due only to symmetry from those that distinguish dif ferent clusters. Therefore, we propose a model- based clustering algorithm which accommodates symmetry to handle this problem. Consider the situation where the samples { x i } n i =1 follow a mixture of G -in v ariant density functions. For the VMF distribution, the mixture density has the following form: g v ( x ; { µ c , κ c , α c } ) = C X c =1 α c M X m =1 1 M φ ( x ; P m µ c , κ c ) ! , (21) where C is the number of clusters assumed to be fixed a priori, µ c , κ c are the parameters for the c -th cluster and α c are the mixing coef ficients where P C c =1 α c = 1 and α c > 0 for all c . The parameters of (21) can be estimated by the EM algorithm: E-step: r i,c,m = α c φ ( x i ; P m µ c , κ c ) P C h =1 α h P M l =1 φ ( x i ; P l µ h , κ h ) (22) M-step: α c = n X i =1 M X m =1 r i,c,m , ˆ µ c = γ c k γ c k , ˆ κ c = A − 1 p k γ c k nα c , (23) γ c = n X i =1 M X m =1 r i,c,m P T m x i , (24) where r i,c,m is the probability of sample x i belonging to the c -th cluster and the m -th symmetric component. For the W atson distribution, the mixture of G -in variant W atson density is g w ( x ; { µ c , κ c , α c } ) = C X c =1 α c M 0 X m =1 1 M 0 W p ( x ; P m µ c , κ c ) (25) The E-step is similar to (22) with φ replaced by W p function. The M-step can be computed with a similar approach as in Section III-B with the follo wing modifications: ˜ T c = 1 nα c n X i =1 M 0 X m =1 r i,c,m ( P T m x i x T i P m ) , (26) ˆ κ c = Y − 1 p P n i =1 P M 0 m =1 r i,c,m ( µ T c P T m x i ) 2 nα c ! , (27) where α c = P n i =1 P M m =1 r i,c,m . A. Multi-modality T ests on G -in variant Spherical Distrib utions Giv en sample set { x i } n i =1 on S p − 1 , the objectiv e is to determine whether the n samples are drawn from one single distribution or a mixture of C distributions. For polycrystalline materials, the result of this determination can be used to discov er undetected grains within a region. W e propose to use a multi-modal hypothesis test based on the G -inv ariant distributions to solve this problem. The two hypotheses are H 0 : The samples are from a single G -in v ariant distribution f ( x ; { µ , κ } ) ; and H 1 : The samples are from a mixture of C distributions g ( x ; { µ c , κ c , α c } C c =1 ) . The Generalized Like- lihood Ratio T est (GLR T) [15] has the follo wing form: Λ GLR = max { µ c ,κ c ,α c } C c =1 ∈ Θ 1 g ( { x i } n i =1 ; { µ c , κ c , α c } C c =1 ) max { µ ,κ }∈ Θ 0 f ( { x i } n i =1 ; { µ , κ } ) ≷ H 1 H 0 η (28) where Θ 0 , Θ 1 are the parameter spaces for the two hypotheses. The f and g functions for VMF and W atson distributions are defined in (7), (15) and (21), (25) respectiv ely and the test statistic Λ GLR can be calculated by the proposed EM algorithm. According to Wilks’ s theorem [16] as n approaches ∞ , the test statistic 2 log Λ GLR will be asymptotically χ 2 - distributed with degrees of freedom equal to ( p + 1)( C − 1) , which is the difference in dimensionality of Θ 0 and Θ 1 . Therefore, the threshold η in (28) can be determined by a giv en significance lev el α . V . A P P L I C A T I O N TO C RY S T A L L O G R A P H I C O R I E N TA T I O N Crystal orientation and the grain distribution in polycrys- talline materials determine the mechanical properties of the material, such as, stiffness, elasticity , and deformability . Lo- cating the grain regions and estimating their orientation and dispersion play an essential role in detecting anomalies and vulnerable parts of materials. Electron backscatter diffraction (EBSD) microscopy ac- quires crystal orientation at multiple locations within a grain by capturing the Kikuchi dif fraction patterns of the backscatter electrons [17]. A Kikuchi pattern can be translated to crystal orientation through Hough T ransformation analysis [18] or Dictionary-Based indexing [19]. The process of assigning mean orientation values to each grain is known as indexing. Crystal forms possess point symmetries, e.g. triclinic, tetrag- onal, or cubic, leading to a probability density of measured orientations that is inv ariant over an associated spherical symmetry group G . Therefore, when the type of material has known symmetries, e.g., cubic-type symmetry for nickel or gold, the G -inv ariant VMF and W atson models introduced in Section III can be applied to estimate the mean orientation µ g and the concentration κ g associated with each grain. Furthermore, the clustering method along with the multi- sample hypothesis test in Section IV can be used to detect the underlying grains within a region. A. Simulation of Crystallo graphic Orientation T o simulate the crystallographic orientations, we first draw random samples from VMF and W atson distrib utions with p = 4 . The random variable x in a spherical distribution can be decomposed [11]: x = t µ + p 1 − t 2 S µ ( x ) , (29) where t = µ T x and S µ ( x ) = ( I p − µµ T ) x / k ( I p − µµ T ) x k . Let f ( x ; µ ) be the p.d.f. of the distribution where µ is the mean direction. According to the normal-tangent decom- position property , for any rotationally symmetric distribu- tion, S µ ( x ) is uniformly distributed on S p − 2 µ ⊥ , the ( p − 2) - dimensional sphere normal to µ , and the density of t = x T µ is given by: t 7→ cf ( t )(1 − t 2 ) ( p − 3) / 2 . (30) For VMF distrib ution, substituting (29) into (4) and combin- ing with (30), we have the density of the tangent component t as: f v ( t ) = C v exp { κt } (1 − t 2 ) ( p − 3) / 2 C v = κ 2 ( p/ 2 − 1) I p/ 2 − 1 ( κ )Γ p − 1 2 Γ 1 2 − 1 . (31) Similarly , the density of the tangent component of W atson distribution is: f w ( t ) = C w exp { κt 2 } (1 − t 2 ) ( p − 3) / 2 C w = Γ( p 2 ) Γ( p − 1 2 )Γ( 1 2 ) 1 M ( 1 2 , p 2 , κ ) . (32) Random samples from the density functions (31) and (32) can be easily generated by rejection sampling. The generated quaternions from VMF and W atson distributions are then mapped into the Fundamental Zone (FZ) with the symmetric group actions to simulate the wrap- around problem we observe in real data, i.e. observations are restricted to a single FZ. For cubic symmetry , the FZ in quaternion space is defined in the follo wing set of equations: | q 2 /q 1 | ≤ √ 2 − 1 | q 3 /q 1 | ≤ √ 2 − 1 | q 4 /q 1 | ≤ √ 2 − 1 | q 2 /q 1 + q 3 /q 1 + q 4 /q 1 | ≤ 1 | q 2 /q 1 − q 3 /q 1 + q 4 /q 1 | ≤ 1 | q 2 /q 1 + q 3 /q 1 − q 4 /q 1 | ≤ 1 | q 2 /q 1 − q 3 /q 1 − q 4 /q 1 | ≤ 1 | q 2 /q 1 − q 3 /q 1 | ≤ √ 2 | q 2 /q 1 + q 3 /q 1 | ≤ √ 2 | q 2 /q 1 − q 4 /q 1 | ≤ √ 2 | q 2 /q 1 + q 4 /q 1 | ≤ √ 2 | q 3 /q 1 − q 4 /q 1 | ≤ √ 2 | q 3 /q 1 + q 4 /q 1 | ≤ √ 2 (33) where q i is the i -th component of quaternion q . V I . E X P E R I M E N TA L R E S U L T S A. G -in variant EM-ML P arameter Estimation on Simulated Data Sets of n i.i.d. samples were simulated from the VMF or W atson distributions using the method described in Sec.V -A with giv en µ = µ o , κ = κ o for the m 3 m point symme- try group associated with the symmetries of cubic crystal lattice planes. The number of samples for each simulation was set to n = 1000 and κ o was swept from 1 to 100 while, for each simulation run, µ o was selected uniformly at random. The experiment was repeated 100 times and the av erage values of ˆ κ and the inner product ˆ µ T µ o are sho wn in Fig. 1 and 2. In the figures we compare performance for the following methods: (1) the naive ML estimator for the standard VMF or W atson model that does not account for the point group structure (labeled ”ML Estimator”). (2) Mapping each of the samples x i tow ard a reference direction x r (randomly selected from { x i } n i =1 ), i.e. x i 7→ P m x i , where P m = arg min P ∈G arccos ( x T r Px ) , to remo ve possible 0 20 40 60 80 100 0.92 0.94 0.96 0.98 1 κ o µ T µ o Ground Truth ML Estimator Modified ML EM−VMF EM−Watson (a) VMF Simulated Data 0 20 40 60 80 100 0.92 0.94 0.96 0.98 1 κ o µ T µ o Ground Truth ML Estimator Modified ML EM−VMF EM−Watson (b) W atson Simulated Data Fig. 1. Mean orientation estimator comparisons for G -in variant densities. Shown is the average inner product µ T o ˆ µ of four estimators ˆ µ when µ o is the true mean orientation as a function of the true concentration parameter κ o for the data simulated from VMF (Fig. 1(a)) and from W atson (Fig. 1(b)) distribution. The naive estimator (”ML Estimator” in blue line) does not attain perfect estimation (inner product = 1 ) for any κ o since it does not account for the spherical symmetry group structure. The modified ML (green dashed line) achiev es perfect estimation as κ o becomes large. The proposed EM-ML methods (”EM-VMF”, ”EM-W atson”) achieve perfect estimation much faster than the other methods even under model mismatch (EM-VMF for W atson simulated data and vice versa). ambiguity . Then performing ML for the standard VMF or W atson distrib ution (labeled ”Modified ML”). (3) Applying our proposed EM algorithm directly to the n samples using the mixture of VMF distrib ution (9)-(11) (labeled ”EM-VMF”) (4) Applying our proposed EM algorithm to the mixture of W atson distrib ution (16)-(20) (labeled ”EM-W atson”). Figure 1 sho ws the inner product v alues µ T o ˆ µ . The proposed EM-VMF and EM-W atson estimators hav e similar perfor- mance in that they achiev e perfect recovery of the mean orientation ( µ T o ˆ µ = 1 ) much f aster than the other methods as the concentration parameter κ o increases (lo wer dispersion of the samples about the mean) no matter whether the data is gen- erated from VMF (Fig. 1(a)) or W atson distribution (Fig. 1(b)), indicating the robustness of the proposed approaches under model mismatch. Notice that when κ o is small ( κ o < 20 for VMF data and κ o < 10 for W atson data), none of the methods can accurately estimate the mean orientation. The reason is that when κ o is small the samples become nearly uniformly distributed over the sphere. The threshold κ o value at which performance starts to de grade depends on the choice of point symmetry group and the distribution used to simulate the data. In Fig. 2 it is seen that the biases of the proposed EM-VMF [1] and EM-W atson κ estimators are significantly lower than that of the other methods compared. While the modified ML performs better than the nai ve ML estimator, its bias is significantly worse than the proposed EM-VMF and EM-W atson approaches. Figure 3 sho ws the computation time of the estimation algorithms presented in Fig. 1 and Fig. 2. The computation time for all methods decreases as κ o becomes larger . When κ o is small ( κ o < 20 for VMF data and κ o < 10 for W atson data), because the samples are almost uniformly distrib uted around the sphere, it is difficult for the EM algorithms to con verge to the optimal solution and they therefore require maximum number of iterations to stop, forming the plateaus 0 20 40 60 80 100 0 20 40 60 80 100 120 κ o ˆ κ Ground Truth ML Estimator Modified ML EM−VMF (a) VMF Simulated Data 0 20 40 60 80 100 0 20 40 60 80 100 120 κ o ˆ κ Ground Truth ML Estimator Modified ML EM−Watson (b) W atson Simulated Data Fig. 2. Concentration parameter estimator bias as a function of the true concentration κ o for data simulated from VMF (Fig. 2(a)) [1] and from W atson (Fig. 2(b)) distributions. The bias of the nai ve ML (blue solid line) is large o ver the full range of κ o . The modified ML (green dashed line) estimates κ more accurately when κ o is small. Our proposed EM-VMF and EM-W atson estimators (black dotted line and magenta dashed line) hav e lower bias than the other estimators. 0 50 100 0 0.5 1 1.5 2 2.5 3 3.5 κ o C om pu ta ti on Tim e EM−VMF EM−Watson EM−VMF−Hyper (a) VMF Simulated Data 0 50 100 0 0.5 1 1.5 2 2.5 3 3.5 κ o C om pu ta ti on Tim e EM−VMF EM−Watson EM−VMF−Hyper (b) W atson Simulated Data Fig. 3. Computation time for calculating the result in Fig. 1 and Fig. 2. EM- W atson (magenta dashed line) has less computation time than EM-VMF (black dotted line) because it uses only half of the symmetry operators. EM-VMF- Hyper (cyan circle line) which uses the hyperbolic sinusoidal simplification of EM-VMF reduces the computation time by more than a factor of 2 . in Fig. 3. Notice that EM-W atson requires less time than EM- VMF e ven though it has more complicated E and M-steps. The reason is that EM-W atson uses only half of the symmetry operators, which corresponds to the size of the quotient group G / I as described in Section III-B. By applying the hyperbolic sinusoidal simplification in Section III-A (labeled ”EM-VMF- Hyper”), we can further reduce the computation time by more than a f actor of 2 compared to the original EM-VMF . B. G -in variant Clustering on Simulated Data In this section, we demonstrate the performance of our pro- posed EM approaches for clustering. Sets of n i.i.d. samples were simulated from the VMF or W atson distributions with κ = κ o and one of two mean directions ( µ 1 , µ 2 ) to generate two clusters of samples. The spherical symmetry group is m 3 m as before. The number of samples for each set was set to n = 1000 and κ o was swept from 1 to 100 while, for each set, µ 1 , µ 2 was selected uniformly at random. The experiment was repeated 100 times and the average v alues of the inner product ( ˆ µ T 1 µ 1 + ˆ µ T 2 µ 2 ) / 2 are sho wn in Fig. 4. In the figure we compare performances of the following methods: (1) Cluster the samples by standard K-means algorithm with the distance defined by the arc-cosine of the inner product and then use the naiv e ML within each cluster to estimate the mean directions (labeled ”K-means”). (2) Cluster the samples by K-means with the distance defined as (3) and then use the aforementioned modified ML estimator (labeled ”Modified K-means”). (3) Apply our proposed multi-cluster EM-VMF algorithm to the n samples directly (22)-(24) (labeled ”EM- VMF”) (4) Apply our multi-cluster EM-W atson algorithm to the n samples directly (26)-(27) (labeled ”EM-W atson”). Figure 4 sho ws the a verage inner product v alues ( ˆ µ T 1 µ 1 + ˆ µ T 2 µ 2 ) / 2 from the mean direction estimation. The proposed EM-VMF and EM-W atson are able to correctly cluster the samples and achie ve perfect recov ery of the tw o mean orien- tations much faster than the other K-means approaches. Notice that the region where all the methods fail is lar ger than the single cluster case since multiple clusters increase the difficulty of parameter estimation. Again, no matter whether the samples are simulated from VMF or W atson distribution, our proposed approaches perform equally well under both cases. T o further test the ability to detect multiple clusters given a set of samples, we generate 1000 sets of samples. Each set has 1000 samples and is assigned randomly to label 0 or 1 . If the set is labeled 0 , the samples are generated from a single distribution; If the set is labeled 1 , then the samples in the set are randomly generated from two distributions with different means. The GLR T is used with the four aforementioned clus- tering methods to test whether the samples in each set are uni- modal or multi-modal. The Recei ver Operating Characteristic (R OC) curves of the test results are sho wn in Fig. 5. The naiv e K-means with ML estimator which does not consider the symmetry group actions fails to distinguish whether the multiple modes are from actual multiple distributions or due to the wrap-around effect from the fundamental zone mapping. Therefore, this approach tends to o ver -estimate the goodness of fit of the H 1 model for true negati ve cases and under- estimate it for true positi ve cases, resulting in a result that is e ven w orse than random guessing. The modified K-means performs better than K-means but worse than our proposed EM-VMF and EM-W atson algorithms. C. EM-ML orientation estimation for IN100 Nic kel Sample W e next illustrate the proposed EM-VMF and EM-W atson orientation estimators on a real IN100 sample acquired from US Air Force Research Laboratory (AFRL) [19]. The IN100 sample is a polycrystalline Ni superalloy which has cubic symmetry in the m 3 m point symmetry group. EBSD orienta- tion measurements were acquired on a 512 × 384 pixel grid, corresponding to spatial resolution of 297 . 7 nm. The Kikuchi diffraction patterns were recorded on a 80 × 60 photosensiti ve detector for each of the pixels. Figure 6 (a) shows a 200 × 200 sub-region of the full EBSD sample where the orientations are shown in the in verse pole figure (IPF) coloring obtained from the OEM EBSD imaging software and (b) is the back-scattered electron (BSE) image. Note that the OEM-estimated orientations in some grain regions of the IPF image are very inhomogeneous, having a mottled appearance, which is likely due to a fundamental 0 20 40 60 80 100 0.92 0.94 0.96 0.98 1 κ o µ T µ o Ground Truth K−means Modified K−means EM−VMF EM−Watson (a) VMF Simulated Data 0 20 40 60 80 100 0.92 0.94 0.96 0.98 1 κ o µ T µ o Ground Truth K−means Modified K−means EM−VMF EM−Watson (b) W atson Simulated Data Fig. 4. Mean orientation estimator comparisons for samples generated from two different means. Shown is the average inner product ( ˆ µ T 1 µ 1 + ˆ µ T 2 µ 2 ) / 2 of four methods when µ 1 , µ 2 are the true mean orientations as a function of the true concentration parameter κ o for the data simulated from VMF (Fig. 4(a)) and from W atson (Fig. 4(b)) distributions. The K-means with naive estimator (”K-means” in blue line) does not attain perfect estimation for any κ o . A modified K-means with ML estimator (”modified K-means” in green dashed line) achieve perfect estimation as κ o becomes lar ge. The proposed EM-VMF and EM-W atson methods (”EM-VMF”, ”EM-W atson”) achieves perfect estimation much faster than the other methods. 0 0.5 1 0 0.2 0.4 0.6 0.8 1 F als e P os it iv e R at e T rue P osi ti v e Ra te κ = 50 Random Guessing K−means Modified K−means EM−VMF EM−Watson (a) VMF Simulated Data 0 0.5 1 0 0.2 0.4 0.6 0.8 1 F als e P os it iv e R at e T rue P osi ti v e Ra te κ = 50 Random Guessing K−means Modified K−means EM−VMF EM−Watson (b) W atson Simulated Data Fig. 5. R OC curve for detecting bi-modally distributed samples. The samples are uni-modal or bi-modal distributed from VMF (Fig. 5(a)) or W atson (5(b)) distributions with κ o = 50 . The naive K-means with ML estimator cannot cluster the samples well and estimate the mean directions accurately , resulting in poor detection which is ev en worse than random guessing. The modified K-means (green dashed line) performs better than K-means but is still unsatisfactory . Our proposed EM-VMF (black dots) and EM-W atson (magenta dashed line) methods ha ve very good performance in this detection task. zone wrap-around problem. As an alternativ e, we apply a combination of the proposed EM estimators (EM-VMF or EM- W atson) and the GLR T (28) with C = 2 and significance lev el α = 0 . 05 to detect multi-modal distrib utions within each OEM-segmented region. Figure 6 (c)(e) show the estimates of the mean orientations of the re gions/sub-regions, where the sub-regions surrounded by white boundaries indicate those that hav e been detected as deviating from the distribution of the majority of samples from the same region. The multi-modally distributed re gions may be due to undetected grains, inaccurate segmentation, or noisy orientation observations. T o distinguish the latter situations from the first in which the region really consists of two grains, the misalignment/noise test introduced in [20] can be used. Figures 6 (d)(f) show the estimated con- centration parameter κ for the regions/sub-re gions. Note that the estimated κ are large for most of the regions/sub-regions because those regions which hav e multi-modally distributed samples are detected and their concentration parameters are estimated separately for each sub-region. Original Direction 50 100 150 200 50 100 150 200 (a) IPF from OEM BSE image 50 100 150 200 50 100 150 200 0 0.2 0.4 0.6 0.8 (b) BSE from OEM Detected Grains 50 100 150 200 50 100 150 200 (c) EM-VMF ˆ µ Estimated κ 50 100 150 200 50 100 150 200 0 200 400 600 800 1000 1200 (d) EM-VMF ˆ κ Detected Grains 50 100 150 200 50 100 150 200 (e) EM-W atson ˆ µ Estimated κ 50 100 150 200 50 100 150 200 0 200 400 600 (f) EM-W atson ˆ κ Fig. 6. A 200 × 200 sub-region of the IN100 sample. (a) is the IPF image for the Euler angles extracted from EBSD by OEM imaging software. IPF coloring in some grains is not homogeneous, likely due to symmetry ambiguity . (b) is the BSE image of the sample. (c)(e) show the estimates of the mean orientations of the regions/sub-regions using a combination of the proposed EM estimators, EM-VMF and EM-W atson respectiv ely , and the GLR T (28) to detect multi-modal distrib utions within each OEM- segmented region. The sub-regions surrounded by white boundaries indicate those that have been detected as deviating from the distribution of the majority of samples from the same region. (d)(f) show the estimated concentration parameter κ for the regions/sub-regions. Note that the estimated κ are large for most of the regions/sub-regions because those regions which have multi- modally distributed samples are detected and their concentration parameters are estimated separately for each sub-re gion. V I I . C O N C L U S I O N A hyperbolic G -in v ariant von Mises-Fisher distribution was shown to be equiv alent to the distribution proposed in [1]. The advantage of the hyperbolic form is parameter estimation can be performed with substantially fe wer computations. A different group in variant orientation distribution was intro- duced, called the G -in variant W atson distrib ution, and an EM algorithm was presented that iterativ ely estimates its orienta- tion and concentration parameters. W e introduced multi-modal generalizations of these G -inv ariant distributions using mixture models and sho wed that these can be used to ef fectiv ely cluster populations of orientations that ha ve spherical symmetry group in variances. The mixture of VMF and W atson models were applied to the problem of estimation of mean grain orientation parameters in polycrystalline materials whose orientations lie in the m 3 m point symmetry group. Application of the finite mixture representation to other types of groups would be worthwhile future work. A C K N O W L E D G M E N T The authors are grateful for inputs from Megna Shah, Mike Jackson and Mike Groeber . A OH would like to acknowl- edge financial support from USAF/AFMC grant F A8650-9-D- 5037/04 and AFOSR grant F A9550-13-1-0043. MDG would like to acknowledge financial support from AFOSR MURI grant F A9550-12-1-0458. R E F E R E N C E S [1] Y . Chen, D. W ei, G. Newstadt, M. De Graef, J. Simmons, and A. Hero, “Parameter Estimation in Spherical Symmetry Groups, ” Signal Pr ocess- ing Letters, IEEE , vol. 22, no. 8, pp. 1152–1155, Aug. 2015. [2] A. P . Dempster , N. M. Laird, and D. B. Rubin, “Maximum likelihood from incomplete data via the EM algorithm, ” J ournal of the Royal Statistical Society . Series B (Methodological) , pp. 1–38, 1977. [3] K. Sohn, D. Y . Jung, H. Lee, and A. O. Hero, “Efficient learning of sparse, distributed, con volutional feature representations for object recognition, ” in Computer V ision (ICCV), 2011 IEEE International Confer ence on . IEEE, 2011, pp. 2643–2650. [4] M. De Graef and M. E. McHenry , Structure of materials: an intr oduction to crystallography , dif fraction and symmetry . Cambridge University Press, 2007. [5] [6] G. Birkhoff and S. Mac Lane, A brief survey of modern algebra . Macmillan, 1963. [7] G. McLachlan and D. Peel, “Finite Mixture Models, ” 2004. [Online]. A vailable: http://cds.cern.ch/record/997567 [8] D. Eberly , “Euler angle formulas, ” Geometric T ools, LLC, T echnical Report , 2008. [9] O. Rodrigues, Des lois g ´ eom ´ etriques qui r ´ egissent les d ´ eplacements d’un syst ` eme solide dans l’espace: et de la variation des cor donn ´ ees pr ovenant de ces d ´ eplacements consid ´ er ´ es ind ´ ependamment des causes qui peuvent les pr oduir e . publisher not identified, 1840. [10] S. L. Altmann, “Rotations, quaternions, and double groups, ” 2005. [Online]. A v ailable: http://cds.cern.ch/record/1436474 [11] K. V . Mardia and P . E. Jupp, “Directional statistics, ” 1999. [Online]. A vailable: http://cds.cern.ch/record/1254260 [12] G. W atson, “Equatorial distributions on a sphere, ” Biometrika , pp. 193– 201, 1965. [13] H. Bateman, A. Erdlyi, W . Magnus, F . Oberhettinger, and F . G. Tricomi, Higher transcendental functions . McGraw-Hill New Y ork, 1955, vol. 3. [14] J. A. Hartigan and M. A. W ong, “ Algorithm AS 136: A k-means clustering algorithm, ” Applied statistics , pp. 100–108, 1979. [15] A. O. Hero, “Statistical methods for signal processing, ” MATRIX , vol. 2, p. 6, 2000. [16] S. S. W ilks, “The large-sample distribution of the likelihood ratio for testing composite hypotheses, ” The Annals of Mathematical Statistics , vol. 9, no. 1, pp. 60–62, 1938. [17] K. Saruwatari, J. Akai, Y . Fukumori, N. Ozaki, H. Nagasawa, and T . K ogure, “Crystal orientation analyses of biominerals using Kikuchi patterns in TEM, ” Journal of Mineralogical and P etr ological Sciences , vol. 103, no. 1, pp. 16–22, 2007. [18] N. C. K. Lassen, Automated determination of crystal orientations from electr on backscattering patterns . Institut for Matematisk Modellering, Danmarks T ekniske Universitet, 1994. [19] S. U. Park, D. W ei, M. De Graef, M. Shah, J. Simmons, and A. O. Hero, “EBSD image segmentation using a physics-based forward model. ” in ICIP , 2013, pp. 3780–3784. [20] Y .-H. Chen, D. W ei, G. Ne wstadt, J. Simmons, and others, “Coer- civ e Region-level Registration for Multi-modal Images, ” arXiv pr eprint arXiv:1502.07432 , 2015.
Original Paper
Loading high-quality paper...
Comments & Academic Discussion
Loading comments...
Leave a Comment