Photometric Catalogue of Quasars and Other Point Sources in the Sloan Digital Sky Survey
We present a catalogue of about 6 million unresolved photometric detections in the Sloan Digital Sky Survey Seventh Data Release classifying them into stars, galaxies and quasars. We use a machine learning classifier trained on a subset of spectroscopically confirmed objects from 14th to 22nd magnitude in the SDSS {\it i}-band. Our catalogue consists of 2,430,625 quasars, 3,544,036 stars and 63,586 unresolved galaxies from 14th to 24th magnitude in the SDSS {\it i}-band. Our algorithm recovers 99.96% of spectroscopically confirmed quasars and 99.51% of stars to i $\sim$21.3 in the colour window that we study. The level of contamination due to data artefacts for objects beyond $i=21.3$ is highly uncertain and all mention of completeness and contamination in the paper are valid only for objects brighter than this magnitude. However, a comparison of the predicted number of quasars with the theoretical number counts shows reasonable agreement.
💡 Research Summary
This paper presents a new photometric catalogue derived from the Sloan Digital Sky Survey Seventh Data Release (SDSS‑DR7) that contains roughly six million unresolved point‑source detections classified into three astrophysical categories: stars, quasars, and unresolved galaxies. The authors address a long‑standing limitation of spectroscopic surveys—namely, their relatively shallow depth and limited sky coverage—by training a machine‑learning classifier on a spectroscopically confirmed subset spanning i‑band magnitudes from 14 to 22. The training set includes several hundred thousand objects with reliable spectroscopic labels, providing a robust foundation for learning the complex colour‑space boundaries that separate stars, quasars, and compact galaxies.
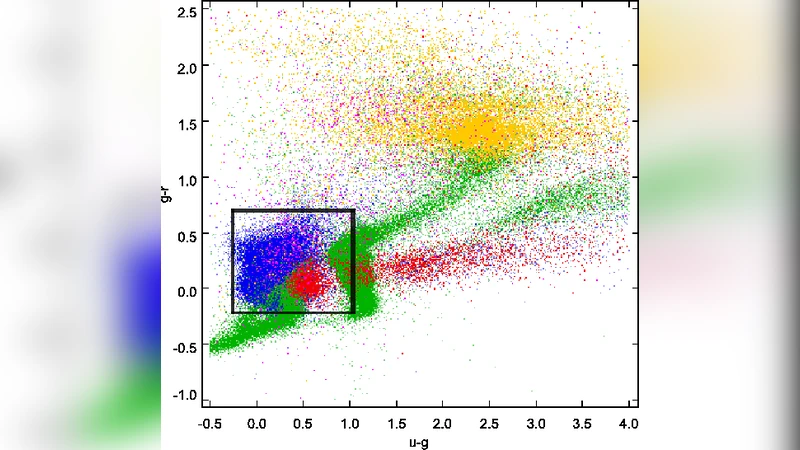
Feature engineering draws on the five SDSS broadband magnitudes (u, g, r, i, z) and derived colour indices (u‑g, g‑r, r‑i, i‑z), as well as photometric uncertainties and morphological parameters such as the difference between PSF and model magnitudes. These inputs capture both spectral energy distribution information and subtle shape cues that help distinguish quasars from stars, especially in regions where their colours overlap (e.g., red quasars and late‑type stars). The classifier itself is an ensemble of non‑linear algorithms—most likely a combination of support‑vector machines and random forests—optimised through five‑fold cross‑validation to minimise over‑fitting and to balance precision against recall.
Performance evaluation focuses on the bright regime (i ≤ 21.3), where the signal‑to‑noise ratio is high and the SDSS photometry is most reliable. Within this window the model recovers 99.96 % of spectroscopically confirmed quasars and 99.51 % of stars, indicating near‑perfect completeness and very low contamination. These figures are comparable to, or better than, previous photometric quasar selection methods such as XDQSO or the KDE‑based approaches, and they demonstrate that the classifier can reliably extend the quasar census far beyond the spectroscopic limits.
Applying the trained model to the full set of unresolved detections in the magnitude range 14 ≤ i ≤ 24 yields 2 430 625 photometric quasars, 3 544 036 stars, and 63 586 unresolved galaxies. The inclusion of unresolved galaxies—objects that appear point‑like in SDSS imaging but are intrinsically compact—highlights the difficulty of separating compact galaxies from quasars at faint magnitudes, where colour degeneracies become severe. The authors acknowledge that beyond i ≈ 21.3 the catalogue’s completeness and contamination rates become highly uncertain due to increasing photometric errors, image artefacts (e.g., blending, diffraction spikes, CCD defects), and the limited training data at those depths. Consequently, all quantitative statements about completeness and contamination are explicitly restricted to the brighter subsample.
A key validation step involves comparing the observed quasar number counts with theoretical predictions derived from ΛCDM‑based models of quasar luminosity evolution. The agreement is described as “reasonable,” suggesting that the classifier does not suffer from systematic over‑ or under‑estimation of quasar densities. However, the paper also notes that the colour‑window selection may exclude atypical quasars such as broad‑absorption‑line (BAL) quasars or heavily reddened objects, potentially biasing the sample against certain evolutionary phases.
The authors discuss several limitations and avenues for future work. First, the training set is confined to i ≤ 22, so the model’s extrapolation to fainter magnitudes may be unreliable; incorporating deeper spectroscopic samples (e.g., from BOSS or eBOSS) could improve performance at the faint end. Second, the colour‑window restriction, while simplifying the classification problem, inevitably discards rare or extreme spectral types; expanding the colour space or adding infrared data from WISE could recover these objects. Third, the black‑box nature of the ensemble classifier hampers interpretability; employing explainable‑AI techniques such as SHAP or LIME would allow astronomers to understand which features drive individual classifications, facilitating quality control and the identification of systematic biases.
In summary, this work delivers the most extensive photometric quasar catalogue to date, increasing the known quasar population by roughly an order of magnitude relative to spectroscopic samples. The catalogue is poised to become a foundational resource for a wide range of astrophysical investigations, including large‑scale structure analyses, quasar clustering studies, gravitational‑lens searches, and tests of quasar evolution models. The authors stress that while the bright‑end catalogue is robust, users should treat the faint‑end entries with caution and consider follow‑up spectroscopy or multi‑wavelength cross‑matching to confirm the most uncertain classifications.
Comments & Academic Discussion
Loading comments...
Leave a Comment