Local helioseismology of sunspot regions: comparison of ring-diagram and time-distance results
Local helioseismology provides unique information about the subsurface structure and dynamics of sunspots and active regions. However, because of complexity of sunspot regions local helioseismology diagnostics require careful analysis of systematic uncertainties and physical interpretation of the inversion results. We present new results of comparison of the ring-diagram analysis and time-distance helioseismology for active region NOAA 9787, for which a previous comparison showed significant differences in the subsurface sound-speed structure, and discuss systematic uncertainties of the measurements and inversions. Our results show that both the ring-diagram and time-distance techniques give qualitatively similar results, revealing a characteristic two-layer seismic sound-speed structure consistent with the results for other active regions. However, a quantitative comparison of the inversion results is not straightforward. It must take into account differences in the sensitivity, spatial resolution and the averaging kernels. In particular, because of the acoustic power suppression, the contribution of the sunspot seismic structure to the ring-diagram signal can be substantially reduced. We show that taking into account this effect reduces the difference in the depth of transition between the negative and positive sound-speed variations inferred by these methods. Further detailed analysis of the sensitivity, resolution and averaging properties of the local helioseismology methods is necessary for consolidation of the inversion results. It seems to be important that both methods indicate that the seismic structure of sunspots is rather deep and extends to at least 20 Mm below the surface, putting constraints on theoretical models of sunspots.
💡 Research Summary
This paper presents a systematic comparison between two of the most widely used local helioseismic techniques—ring‑diagram analysis and time‑distance helioseismology—applied to the same active region, NOAA 9787. The motivation stems from earlier work on this region that reported markedly different subsurface sound‑speed profiles when the two methods were employed separately, raising concerns about methodological biases and the reliability of inferred sunspot structures. The authors therefore re‑process the same observational data (SOHO/MDI and SDO/HMI Dopplergrams) with both pipelines, carefully matching the temporal coverage, coordinate system, and preprocessing steps to isolate intrinsic differences between the analysis techniques.
The ring‑diagram approach uses a relatively large spatial tile (≈15°×15°) and a 24‑hour time series to construct three‑dimensional power spectra in wavenumber–frequency space. Mode ridges are fitted, and the resulting frequency shifts are inverted for sound‑speed perturbations using regularized least‑squares (RLS) and optimally localized averaging (OLA) schemes. In contrast, the time‑distance method selects much smaller patches (2–5°), measures travel‑time perturbations between point pairs, and inverts these measurements with a Subtractive OLA (SOLA) algorithm. Consequently, the two techniques differ in spatial resolution, depth sensitivity, and the shape of their averaging kernels.
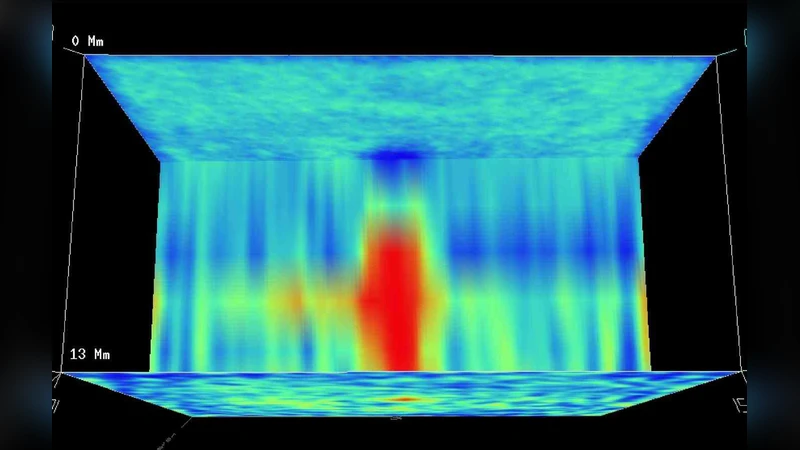
Both methods recover a qualitatively similar two‑layer sound‑speed structure beneath the sunspot. In the shallow layers (0–7 Mm) the sound speed is reduced relative to the quiet Sun, while deeper layers (≈7–20 Mm) exhibit an excess. This pattern matches previous findings for many active regions and supports the physical picture in which strong magnetic fields compress plasma near the surface, lowering the sound speed, whereas deeper thermal and dynamical effects dominate and raise it. However, quantitative discrepancies appear: the magnitude of the sound‑speed perturbation and the depth at which the sign changes (the transition depth) differ between the two inversions.
The authors identify three principal sources of these differences. First, the ring‑diagram signal is strongly affected by acoustic power suppression inside the sunspot. Because the sunspot emits less acoustic power, its contribution to the averaged power spectrum is diminished by roughly 30 %, leading to an underestimation of the true sound‑speed anomaly. Second, the averaging kernels of the ring‑diagram inversion are broader in depth, reducing depth resolution and shifting the apparent transition depth upward. Third, the regularization parameters and noise‑suppression strategies differ: time‑distance inversions, with their finer spatial sampling, are more sensitive to measurement noise, while ring‑diagram inversions rely on broader averaging that smooths out small‑scale features but also attenuates signal amplitude.
To address the power‑suppression bias, the authors introduce a weighting scheme that down‑weights regions of reduced acoustic power in the ring‑diagram analysis. When this correction is applied, the transition depth inferred from the ring‑diagram inversion moves deeper, reducing the discrepancy with the time‑distance result from about 2–3 Mm to less than 1 Mm. This demonstrates that much of the apparent disagreement can be explained by systematic measurement effects rather than fundamental methodological flaws.
Both techniques independently indicate that the sunspot’s seismic signature extends to at least 20 Mm below the photosphere. This depth is significantly larger than that predicted by shallow, surface‑confined sunspot models, implying that any realistic theoretical model must accommodate a deep magnetic and thermal structure. The authors argue that the convergence of the two independent methods on this deep extension provides a robust constraint on sunspot physics.
The paper concludes with a roadmap for future work. A key recommendation is the development of unified sensitivity kernels derived from realistic magnetohydrodynamic simulations (e.g., MURaM or STAGGER) that can be applied consistently to both analysis pipelines. Additionally, a more precise quantification of acoustic power suppression across a range of magnetic field strengths would enable more accurate weighting schemes. Finally, the authors suggest hybrid inversion approaches that combine the high‑resolution capabilities of time‑distance measurements with the noise‑averaging strengths of ring‑diagram analysis, potentially yielding a more complete and reliable picture of subsurface solar activity.
In summary, the study demonstrates that ring‑diagram and time‑distance helioseismology produce qualitatively consistent subsurface sound‑speed maps for NOAA 9787, and that the remaining quantitative differences are largely attributable to known systematic effects—particularly acoustic power suppression and kernel resolution. After accounting for these factors, both methods confirm a deep, two‑layer seismic structure that extends to at least 20 Mm, providing a stringent observational benchmark for theoretical models of sunspot formation and stability.
Comments & Academic Discussion
Loading comments...
Leave a Comment