We present a mathematical analysis of records drawn from independent random variables with a drifting mean. To leading order the change in the record rate is proportional to the ratio of the drift velocity to the standard deviation of the underlying distribution. We apply the theory to time series of daily temperatures for given calendar days, obtained from historical climate recordings of European and American weather stations as well as re-analysis data. We conclude that the change in the mean temperature has increased the rate of record breaking events in a moderate but significant way: For the European station data covering the time period 1976-2005, we find that about 5 of the 17 high temperature records observed on average in 2005 can be attributed to the warming climate.
Deep Dive into Record-breaking temperatures reveal a warming climate.
We present a mathematical analysis of records drawn from independent random variables with a drifting mean. To leading order the change in the record rate is proportional to the ratio of the drift velocity to the standard deviation of the underlying distribution. We apply the theory to time series of daily temperatures for given calendar days, obtained from historical climate recordings of European and American weather stations as well as re-analysis data. We conclude that the change in the mean temperature has increased the rate of record breaking events in a moderate but significant way: For the European station data covering the time period 1976-2005, we find that about 5 of the 17 high temperature records observed on average in 2005 can be attributed to the warming climate.
Introduction. -In current media coverage the occurrence of record-breaking temperatures and other extreme weather conditions is often associated with global climate change. However, record breaking events occur at a certain rate in any stationary random process. In mathematical terms, a record is an entry in a time series that is larger (upper record) or smaller (lower record) than all previous entries [1][2][3]. If the entries are independent and identically distributed random variables drawn from a continuous probability distribution, the probability P n to observe a new record after n steps, hereafter referred to as the record rate, is simply P n = 1/n, because all n values are equally likely to be the largest. Applying this result to maximal temperatures measured at a specific calendar day over a time span of n years, it follows that the expected number of records per year is 365/n, i.e. about 12 records for an observation period of 30 years. Remarkably, this prediction is entirely independent of the underlying probability distribution, which may even differ for different calendar days.
Despite considerable current interest in extreme climate events [4][5][6][7][8][9][10][11][12][13][14], the subject of climate records has received relatively little attention. It is intuitively obvious that an increase in the mean temperature will lead to an increased occurrence of high temperature records, but attempts to detect this effect in observational data have long remained inconclusive [15][16][17][18]. Only very recently an empirical study of temperature data from the US found a significant effect of warming on the relative occurrence of hot and cold records [19].
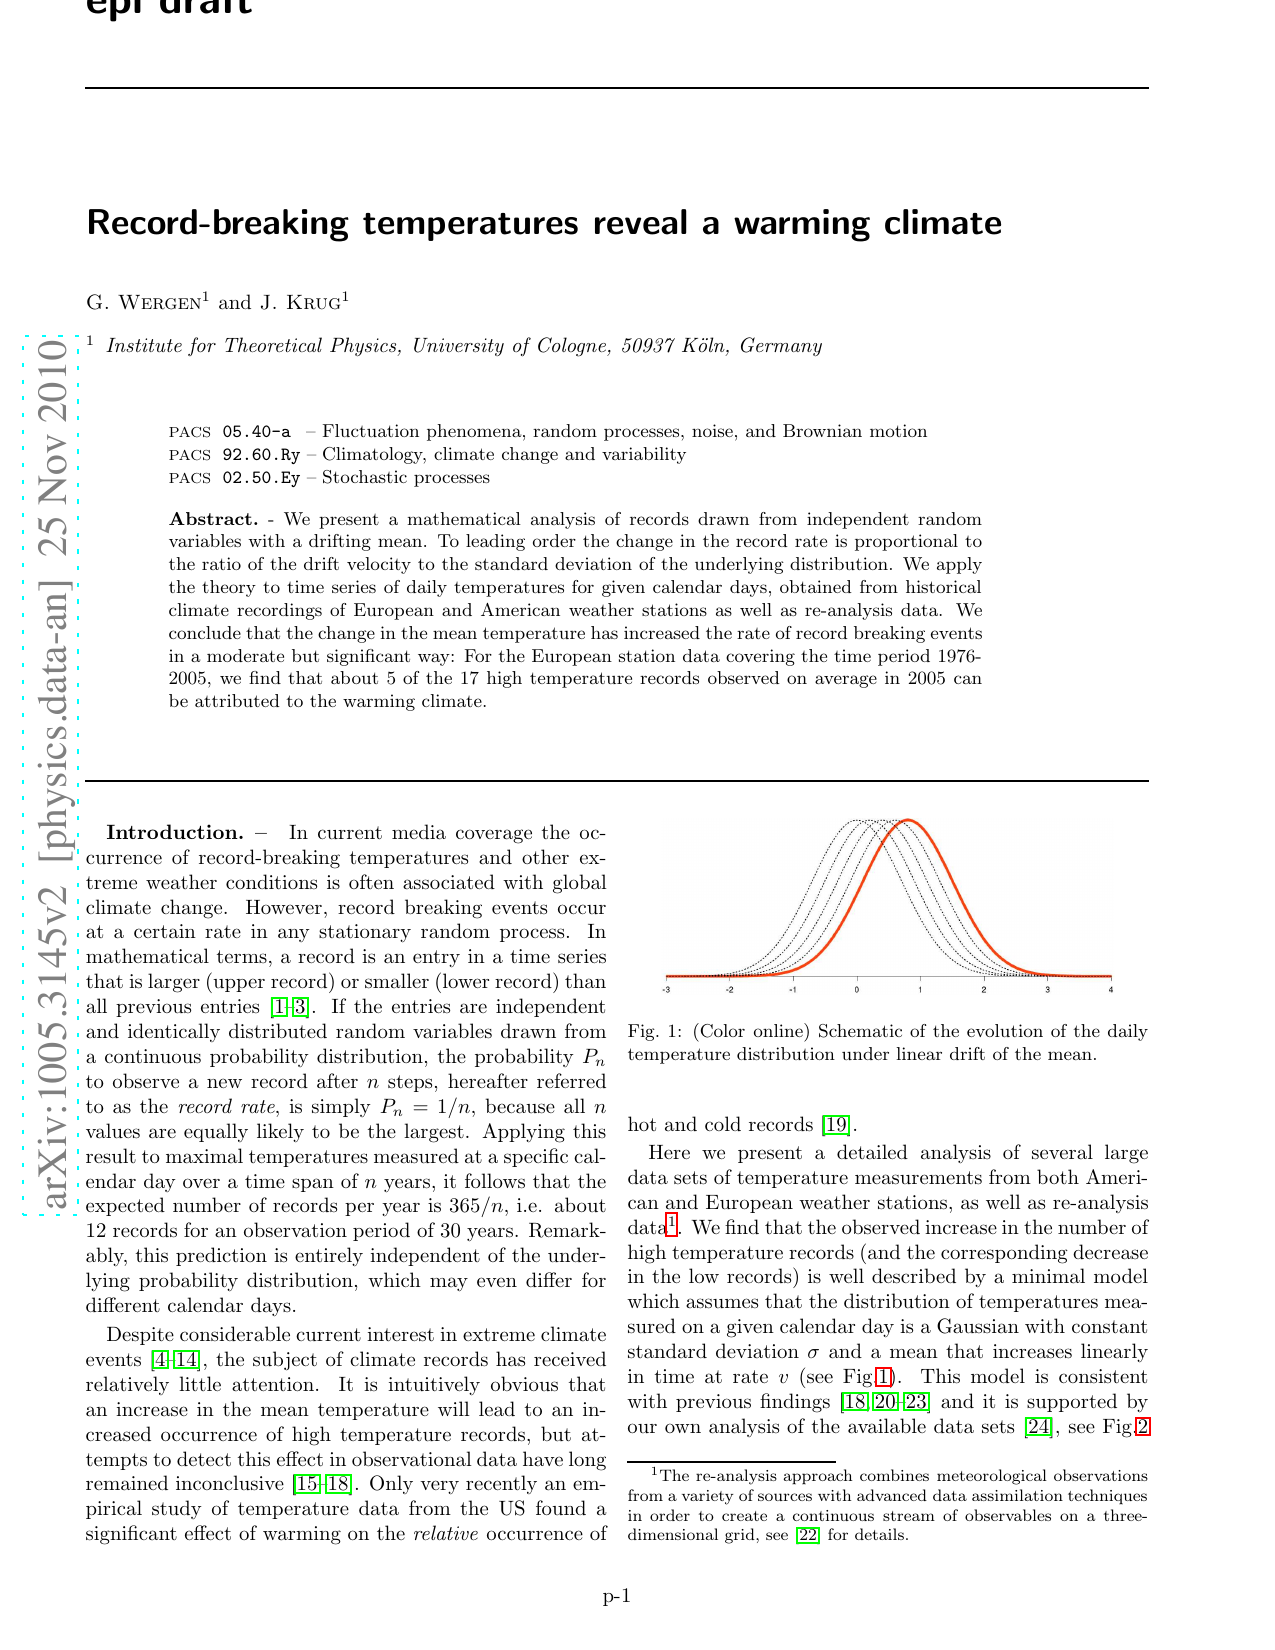
Here we present a detailed analysis of several large data sets of temperature measurements from both American and European weather stations, as well as re-analysis data 1 . We find that the observed increase in the number of high temperature records (and the corresponding decrease in the low records) is well described by a minimal model which assumes that the distribution of temperatures measured on a given calendar day is a Gaussian with constant standard deviation σ and a mean that increases linearly in time at rate v (see Fig. 1). This model is consistent with previous findings [18,[20][21][22][23] and it is supported by our own analysis of the available data sets [24], see Fig. 2 for an example. While changes in temperature variability have also been argued to be important in the generation of extreme temperature events [5,7], we have failed to detect a clear systematic trend in σ in the data [ Fig. 2 (b)]. Moreover, the increase in the mean supersedes a possible effect on σ, in the sense that the former leads to an asymptotically constant record rate [25][26][27][28] whereas the latter only increases the record rate from 1/n to (ln n)/n [29]. For these reasons we restrict ourselves to the simplest setting of a temperature distribution of constant shape and linearly increasing mean. Although temperature fluctuations are well known to display long-term correlations [30,31], the assumption that the daily temperatures are not correlated is justified because individual measurements in a time-series are always one year apart (see [18] and the quantitative discussion below).
Theory. -We begin by deriving an approximate analytic expression for the increase in the record rate P n caused by a linear drift of the mean. In general, the record rate for a sequence of independent but not identically distributed random variables x n is given by [29]
where f n (x) denotes the probability density at time step n. Here we consider a drifting distribution of constant shape, which implies f n (x) = f (xvn) with a common density f (x). This reduces (1) to
An explicit evaluation of (2) is possible for special choices of f (x), but in general it is only known that P n converges to a nonzero limit P * = lim n→∞ P n when v > 0 [25][26][27][28]. In the climate context the drift speed is expected to be small compared to the standard deviation of the distribution. We therefore expand (1) to linear order in v, which yields
where F (x) is the cumulative distribution function of f (x). In [28] the integral in the second term is evaluated for various elementary distributions. For distributions with a power law tail one finds that the correction term decreases for large n. On the other hand, for distributions that decay faster than exponential, the correction term generally increases with n. In the Gaussian case of interest here the integral can be evaluated in closed form only for n = 2 and 3, with the result Using a saddle point approximation and the properties of the Lambert W-functions [32] to extract the behavior for large n one arrives at the asymptotic expression [28]
which is accurate for n ≥ 7. For n = 4, 5, 6 the integral can be evaluated numerically. For a typical value of v/σ ≈ 0.01 and a time span of 30 years, ( 5) implies an increase of the record rate from 1
…(Full text truncated)…
This content is AI-processed based on ArXiv data.