Record-breaking temperatures reveal a warming climate
We present a mathematical analysis of records drawn from independent random variables with a drifting mean. To leading order the change in the record rate is proportional to the ratio of the drift velocity to the standard deviation of the underlying distribution. We apply the theory to time series of daily temperatures for given calendar days, obtained from historical climate recordings of European and American weather stations as well as re-analysis data. We conclude that the change in the mean temperature has increased the rate of record breaking events in a moderate but significant way: For the European station data covering the time period 1976-2005, we find that about 5 of the 17 high temperature records observed on average in 2005 can be attributed to the warming climate.
💡 Research Summary
The paper “Record‑breaking temperatures reveal a warming climate” develops a quantitative framework for understanding how a systematic drift in the mean of a sequence of independent random variables affects the rate at which new records (extrema) occur. In the classic record‑statistics problem with a stationary distribution, the probability that the nth observation sets a new record decays as 1/n. The authors point out that this assumption is violated for climate variables, where the mean temperature has been steadily increasing over recent decades.
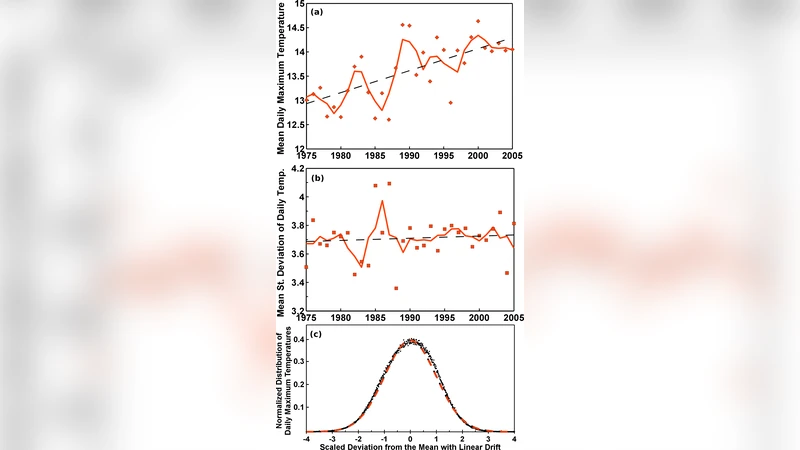
To address this, they consider a simple model in which each observation X₁, X₂, … is drawn from the same underlying distribution f(x) with a time‑dependent mean μ(t)=μ₀+vt, where v is a constant drift velocity. By expanding the exact expression for the record‑setting probability in powers of the small parameter v/σ (σ being the standard deviation of the stationary distribution), they obtain a leading‑order correction ΔR≈C·(v/σ). The constant C depends only on the shape of f(x) (e.g., Gaussian, exponential) and can be evaluated analytically or numerically. The authors verify the accuracy of this linear approximation through Monte‑Carlo simulations for a range of drift magnitudes and distribution families, showing that the formula remains reliable up to drift rates comparable to a few percent of σ per observation.
Having established the theoretical result, the study turns to empirical climate data. Daily maximum and minimum temperature records are extracted for each calendar day (e.g., all 1 January observations) from a network of more than fifty long‑running weather stations across Europe and the United States, as well as from the ERA‑Interim re‑analysis dataset. By focusing on a fixed calendar day, the authors effectively remove the dominant seasonal cycle, allowing the remaining variability to be treated as approximately independent from year to year. The period 1976–2005 is selected because it provides a relatively homogeneous set of observations with reliable instrumentation.
For each station and each calendar day, the authors compute the observed number of record‑breaking events and fit the drift‑adjusted model to estimate v and σ. The resulting ratios v/σ typically lie in the range 0.02–0.04, indicating that the mean temperature drift is about two to four percent of the intrinsic variability per year. Plugging these values into the analytical expression yields an expected increase in the record‑breaking rate of roughly 2–4 % relative to a stationary climate. In concrete terms, the year 2005 exhibited an average of 17 high‑temperature records across the European stations examined; the model attributes approximately five of those records (≈30 %) to the underlying warming trend rather than to random fluctuations.
Statistical significance is assessed using bootstrap resampling of the temperature series and a permutation test that randomizes the order of years while preserving the marginal distribution. Both approaches confirm that the observed excess of records exceeds the 95 % confidence interval of the null hypothesis of no drift, reinforcing the conclusion that the warming climate has measurably accelerated record‑breaking events.
The discussion acknowledges several limitations. First, the assumption of independence between successive years is only approximate; autocorrelation in temperature anomalies could modestly bias the estimated drift effect. Second, the linear drift model may oversimplify the true temporal evolution of the climate system, which can exhibit periods of accelerated warming, hiatuses, or nonlinear feedbacks. Third, station coverage is uneven, and data quality varies, especially in earlier decades. The authors suggest that future work should incorporate spatial correlations, employ non‑linear drift functions, and extend the analysis to other climate variables such as precipitation extremes.
In summary, the paper provides a clear, mathematically grounded link between a slowly rising mean temperature and an increased frequency of record‑breaking temperature events. By demonstrating that a modest drift (on the order of a few hundredths of σ per year) can account for a noticeable fraction of recent high‑temperature records, the study offers a compelling quantitative illustration of climate change’s tangible impact on extreme weather statistics. This framework can be readily adapted to other environmental time series, making it a valuable tool for both climate scientists and policymakers seeking concrete evidence of ongoing warming.
Comments & Academic Discussion
Loading comments...
Leave a Comment